. 2020 Jan;19(1):195-204.
doi: 10.3892/ol.2019.11100. Epub 2019 Nov 14.

Bioinformatics analysis to screen key genes in papillary thyroid carcinoma

Affiliations

Bioinformatics analysis to screen key genes in papillary thyroid carcinoma

Yuanhu Liu et al. Oncol Lett. 2020 Jan.

Abstract

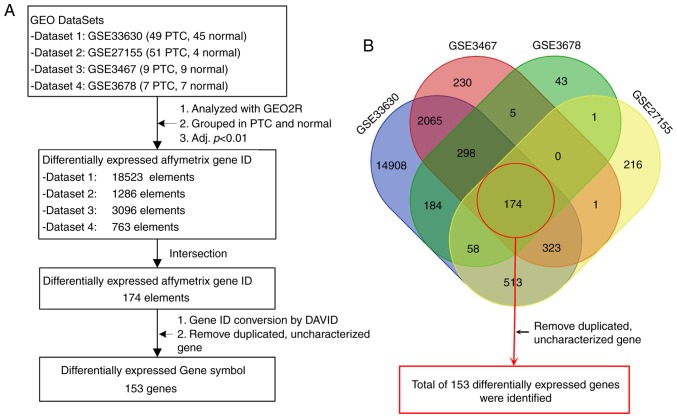
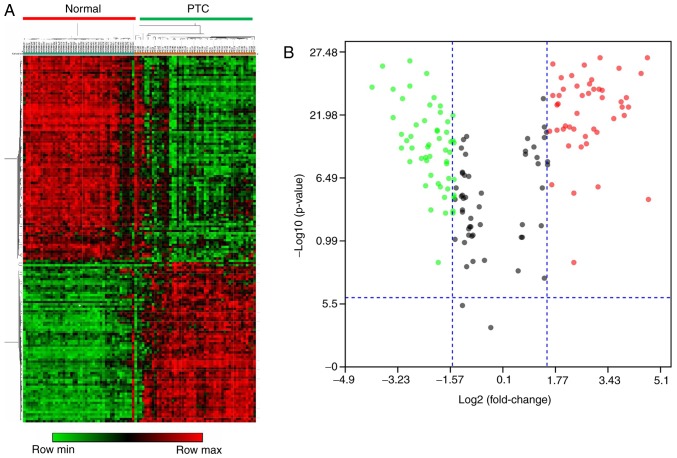
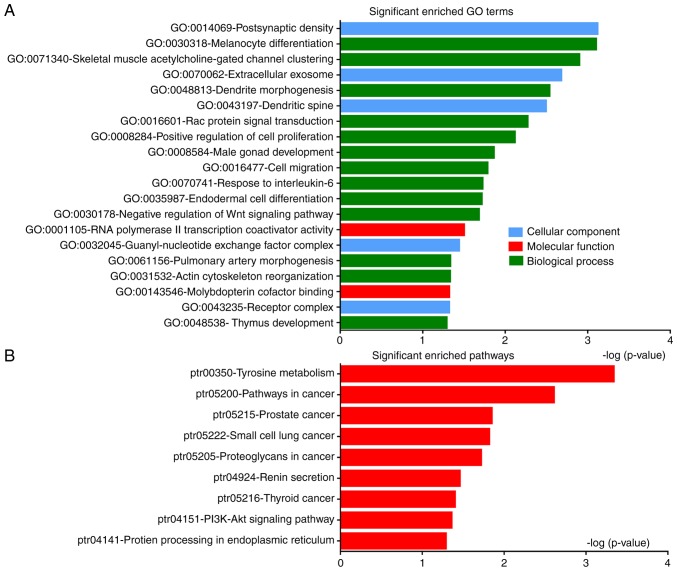
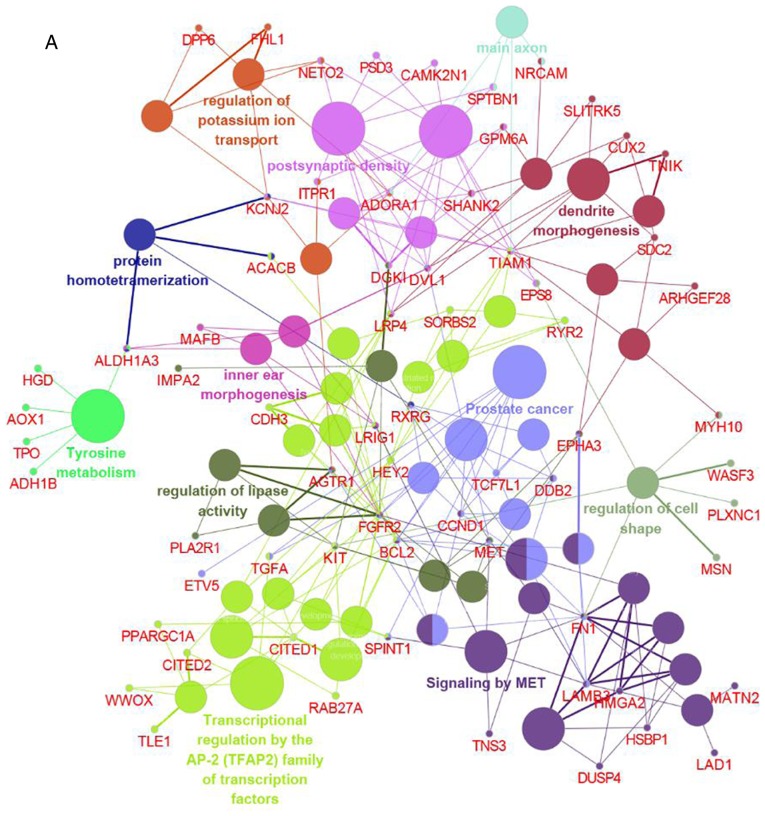
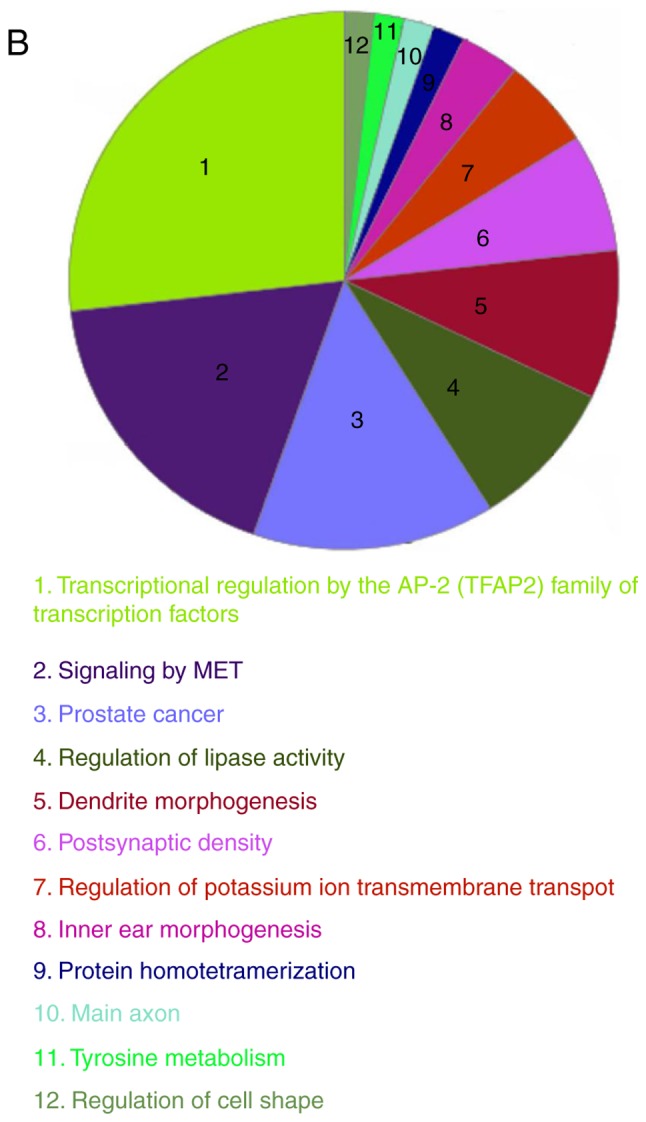
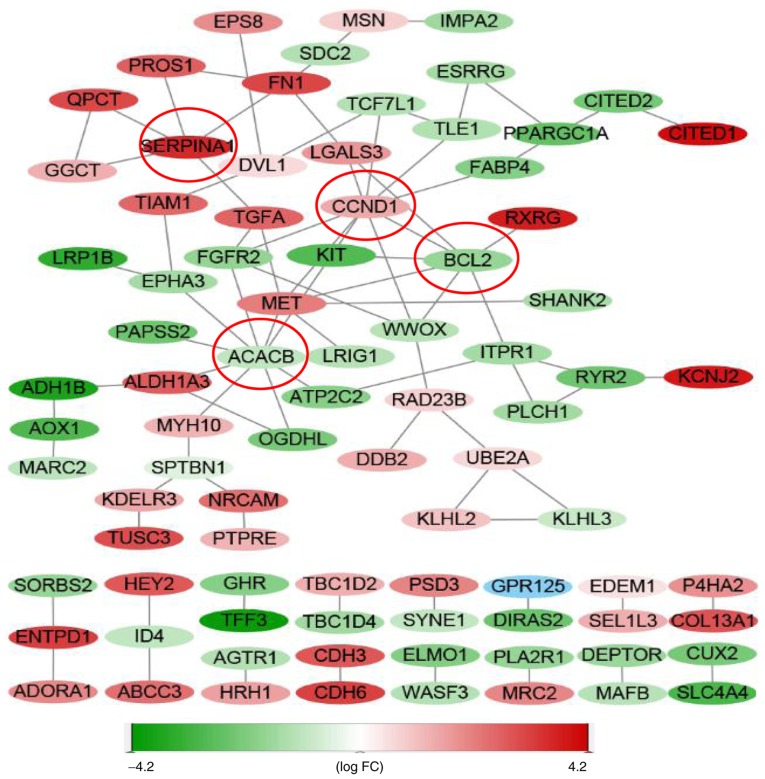
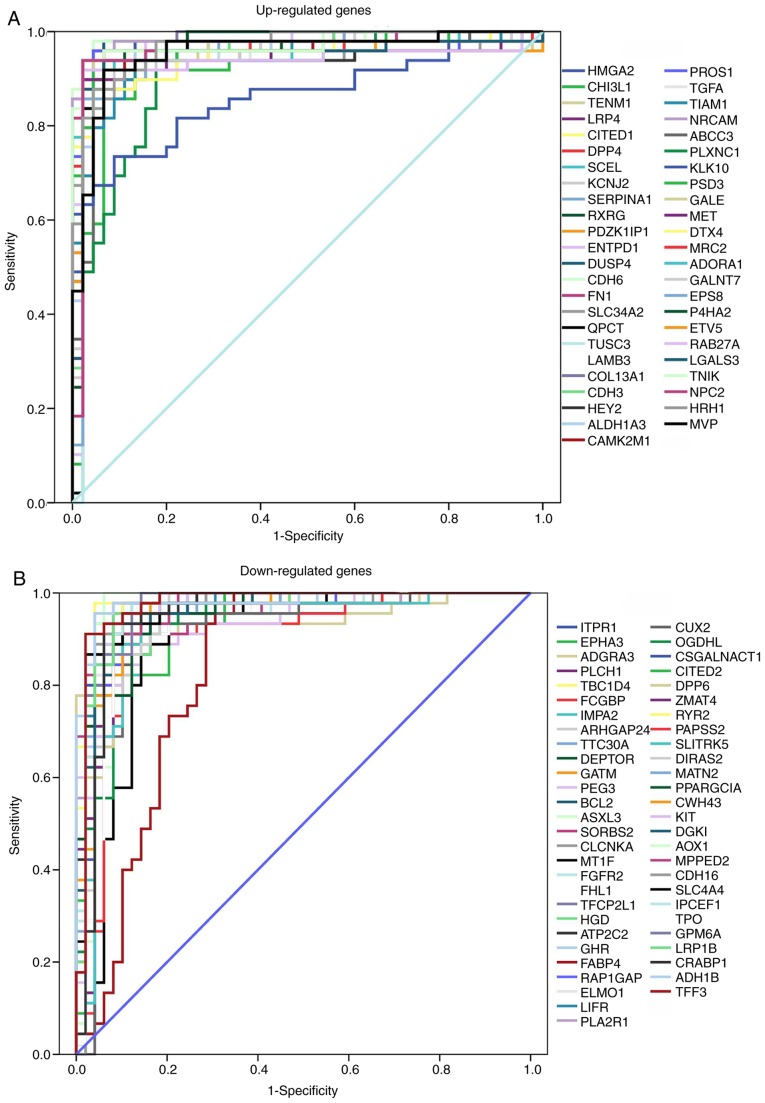
Papillary thyroid carcinoma (PTC) is the most common type of thyroid carcinoma, and its incidence has been on the increase in recent years. However, the molecular mechanism of PTC is unclear and misdiagnosis remains a major issue. Therefore, the present study aimed to investigate this mechanism, and to identify key prognostic biomarkers. Integrated analysis was used to explore differentially expressed genes (DEGs) between PTC and healthy thyroid tissue. To investigate the functions and pathways associated with DEGs, Gene Ontology, pathway and protein-protein interaction (PPI) network analyses were performed. The predictive accuracy of DEGs was evaluated using the receiver operating characteristic (ROC) curve. Based on the four microarray datasets obtained from the Gene Expression Omnibus database, namely GSE33630, GSE27155, GSE3467 and GSE3678, a total of 153 DEGs were identified, including 66 upregulated and 87 downregulated DEGs in PTC compared with controls. These DEGs were significantly enriched in cancer-related pathways and the phosphoinositide 3-kinase-AKT signaling pathway. PPI network analysis screened out key genes, including acetyl-CoA carboxylase beta, cyclin D1, BCL2, and serpin peptidase inhibitor clade A member 1, which may serve important roles in PTC pathogenesis. ROC analysis revealed that these DEGs had excellent predictive performance, thus verifying their potential for clinical diagnosis. Taken together, the findings of the present study suggest that these genes and related pathways are involved in key events of PTC progression and facilitate the identification of prognostic biomarkers.

Keywords: integrated analysis; key genes; microarray; papillary thyroid carcinoma.


Figures

Figure 1.
Figure 1.
Gene screening strategy. (A) The four datasets of GSE33630 (dataset 1), GSE27155 (dataset 2), GSE3467 (dataset 3) and GSE3678 (dataset 4) were selected for the identification of DEGs. (B) Different colored areas represent different datasets. The crossed areas correspond to the common DEGs. DEGs, differentially expressed genes; GEO, Gene Expression Omnibus; PTC, papillary thyroid carcinoma; adj. P, adjusted P-value; DAVID, Database for Annotation, Visualization and Integrated Discovery.
Figure 2.
Figure 2.
Validation and visualization of DEGs in dataset 1. (A) Heat maps were established based on the gene expression profile of dataset 1. Expression levels of the DEGs are represented by the different colors Red, up-regulated; black, normal expression; and green, down-regulated. (B) Volcano plot demonstrating the expression of DEGs with log2 value (fold-change)>1.5 and P<0.05. Blue dotted lines represent cut-off levels, red dots indicate high gene expression, black dots represent normal expression and green dots indicate low gene expression. DEGs, differentially expressed genes; PTC, papillary thyroid carcinoma.
Figure 3.
Figure 3.
GO and pathway enrichment analyses of DEGs in PTC. (A) Significantly enriched GO terms of DEGs in PTC classified based on their biological functions. (B) Signaling pathway enrichment analysis of DEGs using KEGG. GO, Gene Ontology; DEGs, differentially expressed genes; PTC, papillary thyroid carcinoma; KEGG, Kyoto Encyclopedia of Genes and Genomes.
Figure 4.
Figure 4.
Integrated GO and pathway enrichment analyses. (A) Functionally grouped networks presented as colored circles. Circle size represents the enrichment significance of each term. Functionally associated groups were observed to partially overlap. (B) Overview chart illustrating the functional groups of DEGs. GO, Gene Ontology; DEGs, differentially expressed genes; CCND1, cyclin D1; ACACB, acetyl-CoA carboxylase β; TPO, thyroid peroxidase; FN1, fibronectin 1; ADH1B, dehydrogenase 1B (class I), β polypeptide.
Figure 4.
Figure 4.
Integrated GO and pathway enrichment analyses. (A) Functionally grouped networks presented as colored circles. Circle size represents the enrichment significance of each term. Functionally associated groups were observed to partially overlap. (B) Overview chart illustrating the functional groups of DEGs. GO, Gene Ontology; DEGs, differentially expressed genes; CCND1, cyclin D1; ACACB, acetyl-CoA carboxylase β; TPO, thyroid peroxidase; FN1, fibronectin 1; ADH1B, dehydrogenase 1B (class I), β polypeptide.
Figure 5.
Figure 5.
PPI network of DEGs. PPI network was constructed based on the gene expression values of dataset 1. ACACB (9 edges), CCND1 (9 edges), BCL2 (7 edges) and SERPINA1 (5 edges) were identified as the central genes. Expression levels of the DEGs are represented by the different colors: Red denotes upregulated and green denotes downregulated expression. PPI, protein-protein interaction; DEGs, differentially expressed genes; FC, fold-change; CCND1, cyclin D1; ACACB, acetyl-CoA carboxylase beta; FN1, fibronectin 1; SERPINA1, serpin peptidase inhibitor clade A member 1.
Figure 6.
Figure 6.
ROC curve analysis presenting the sensitivity and specificity of DEGs in PTC diagnosis. (A) ROC curves of upregulated genes (B) ROC curves of downregulated genes. PTC, papillary thyroid carcinoma; ROC, receiver operating characteristic; SERPINA1, serpin peptidase inhibitor clade A member 1; FN1, fibronectin 1; PROS1, protein S; TPO, thyroid peroxidase; ADH1B, dehydrogenase 1B (class I), β polypeptide; CDH6, cadherin 6.

Similar articles

Cited by

References

    1. Siegel R, Naishadham D, Jemal A. Cancer statistics, 2013. CA Cancer J Clin. 2013;63:11–30. doi: 10.3322/caac.21166. - DOI - PubMed
    1. Brennan K, Holsinger C, Dosiou C, Sunwoo JB, Akatsu H, Haile R, Gevaert O. Development of prognostic signatures for intermediate-risk papillary thyroid cancer. BMC Cancer. 2016;16:736. doi: 10.1186/s12885-016-2771-6. - DOI - PMC - PubMed
    1. Zhang H, Teng X, Liu Z, Zhang L, Liu Z. Gene expression profile analyze the molecular mechanism of CXCR7 regulating papillary thyroid carcinoma growth and metastasis. J Exp Clin Cancer Res. 2015;34:16. doi: 10.1186/s13046-015-0132-y. - DOI - PMC - PubMed
    1. Carling T, Udelsman R. Thyroid cancer. Annu Rev Med. 2014;65:125–137. doi: 10.1146/annurev-med-061512-105739. - DOI - PubMed
    1. Qu T, Li YP, Li XH, Chen Y. Identification of potential biomarkers and drugs for papillary thyroid cancer based on gene expression profile analysis. Mol Med Rep. 2016;14:5041–5048. doi: 10.3892/mmr.2016.5855. - DOI - PMC - PubMed