Identification of key genes for predicting colorectal cancer prognosis by integrated bioinformatics analysis
- PMID: 31897151
- PMCID: PMC6924121
- DOI: 10.3892/ol.2019.11068
Identification of key genes for predicting colorectal cancer prognosis by integrated bioinformatics analysis
Abstract
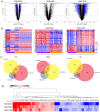
Colorectal cancer (CRC) is a life-threatening disease with a poor prognosis. Therefore, it is crucial to identify molecular prognostic biomarkers for CRC. The present study aimed to identify potential key genes that could be used to predict the prognosis of patients with CRC. Three CRC microarray datasets (GSE20916, GSE73360 and GSE44861) were downloaded from the Gene Expression Omnibus (GEO) database, and one dataset was obtained from The Cancer Genome Atlas (TCGA) database. The three GEO datasets were analyzed to detect differentially expressed genes (DEGs) using the BRB-ArrayTools software. Functional and pathway enrichment analyses of these DEGs were performed using the Database for Annotation, Visualization and Integrated Discovery tool. A protein-protein interaction (PPI) network of DEGs was constructed, hub genes were extracted, and modules of the PPI network were analyzed. To investigate the prognostic values of the hub genes in CRC, data from the CRC datasets of TCGA were used to perform the survival analyses based on the sample splitting method and Cox regression model. Correlation among the hub genes was evaluated using Spearman's correlation analysis. In the three GEO datasets, a total of 105 common DEGs were identified, including 51 down- and 54 up-regulated genes in CRC compared with normal colorectal tissues. A PPI network consisting of 100 DEGs and 551 edges was constructed, and 44 nodes were identified as hub genes. Among these 44 genes, the four hub genes TIMP metallopeptidase inhibitor 1 (TIMP1), solute carrier family 4 member 4 (SLC4A4), aldo-keto reductase family 1 member B10 (AKR1B10) and ATP binding cassette subfamily E member 1 (ABCE1) were associated with overall survival (OS) in patients with CRC. Three significant modules were extracted from the PPI network. The hub gene TIMP1 was present in Module 1, ABCE1 was involved in Module 2 and SLC4A4 was identified in Module 3. Univariate analysis revealed that TIMP1, SLC4A4, AKR1B10 and ABCE1 were associated with the OS of patients with CRC. Multivariate analysis demonstrated that SLC4A4 may be an independent prognostic factor associated with OS. Furthermore, the results from correlation analysis revealed that there was no correlation between TIMP1, SLC4A4 and ABCE1, whereas AKR1B10 was positively correlated with SLC4A4. In conclusion, the four key genes TIMP1, SLC4A4, AKR1B10 and ABCE1 associated with the OS of patients with CRC were identified by integrated bioinformatics analysis. These key genes may be used as prognostic biomarkers to predict the survival of patients with CRC, and may therefore represent novel therapeutic targets for CRC.
Keywords: colorectal cancer; differentially expressed genes; protein-protein interaction; survival.
Copyright: © Dai et al.
Figures


References
-
- Renkonen-Sinisalo L, Aarnio M, Mecklin JP, Järvinen HJ. Surveillance improves survival of colorectal cancer in patients with hereditary nonpolyposis colorectal cancer. Cancer Detect Prev. 2000;24:137–142. - PubMed
LinkOut - more resources
Full Text Sources
Research Materials
Miscellaneous
