Clinical Trial
. 2020 Mar;63(3):473-485.
doi: 10.1007/s00125-019-05065-8. Epub 2020 Jan 2.

Effects of once-weekly semaglutide vs once-daily canagliflozin on body composition in type 2 diabetes: a substudy of the SUSTAIN 8 randomised controlled clinical trial

Affiliations
Clinical Trial

Effects of once-weekly semaglutide vs once-daily canagliflozin on body composition in type 2 diabetes: a substudy of the SUSTAIN 8 randomised controlled clinical trial

Rory J McCrimmon et al. Diabetologia. 2020 Mar.

Abstract

Aims/hypothesis: Intra-abdominal or visceral obesity is associated with insulin resistance and an increased risk for cardiovascular disease. This study aimed to compare the effects of semaglutide 1.0 mg and canagliflozin 300 mg on body composition in a subset of participants from the SUSTAIN 8 Phase IIIB, randomised double-blind trial who underwent whole-body dual-energy x-ray absorptiometry (DXA) scanning.

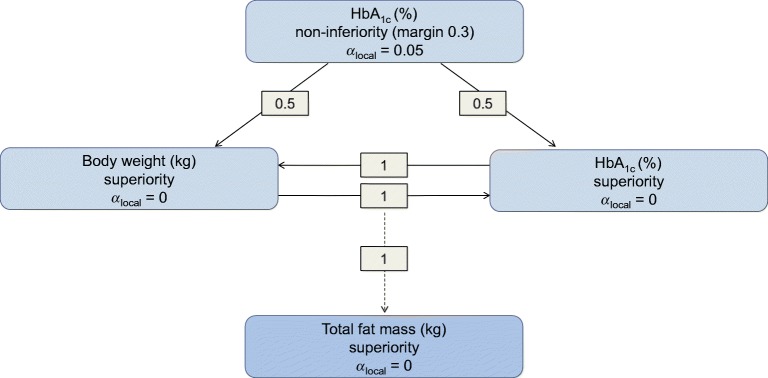
Methods: Adults (age ≥18 years) with type 2 diabetes, HbA1c 53-91 mmol/mol (7.0-10.5%), on a stable daily dose of metformin (≥1500 mg or maximum tolerated dose) and with an eGFR ≥60 ml min-1 [1.73 m]-2 were randomised 1:1 to semaglutide 1.0 mg once weekly and canagliflozin placebo once daily, or canagliflozin 300 mg once daily and semaglutide placebo once weekly. Body composition was assessed using whole-body DXA scans. The study participants and investigator remained blinded throughout the trial, and quality of DXA scans was evaluated in a blinded manner. Change from baseline to week 52 in total fat mass (kg) was the confirmatory efficacy endpoint.

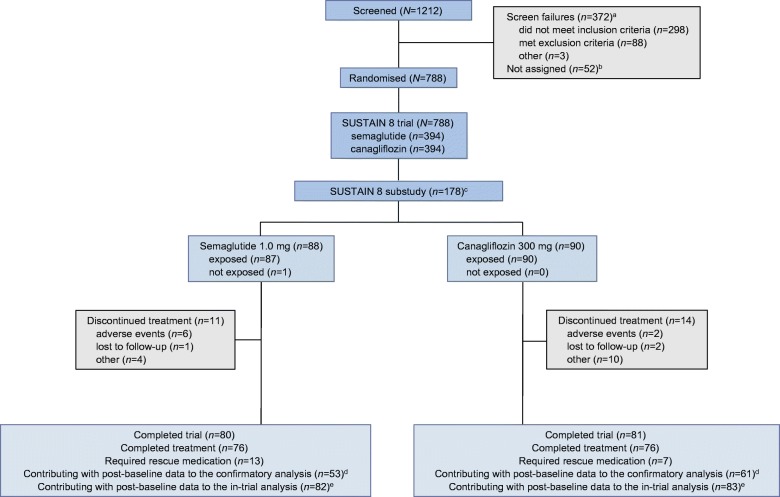
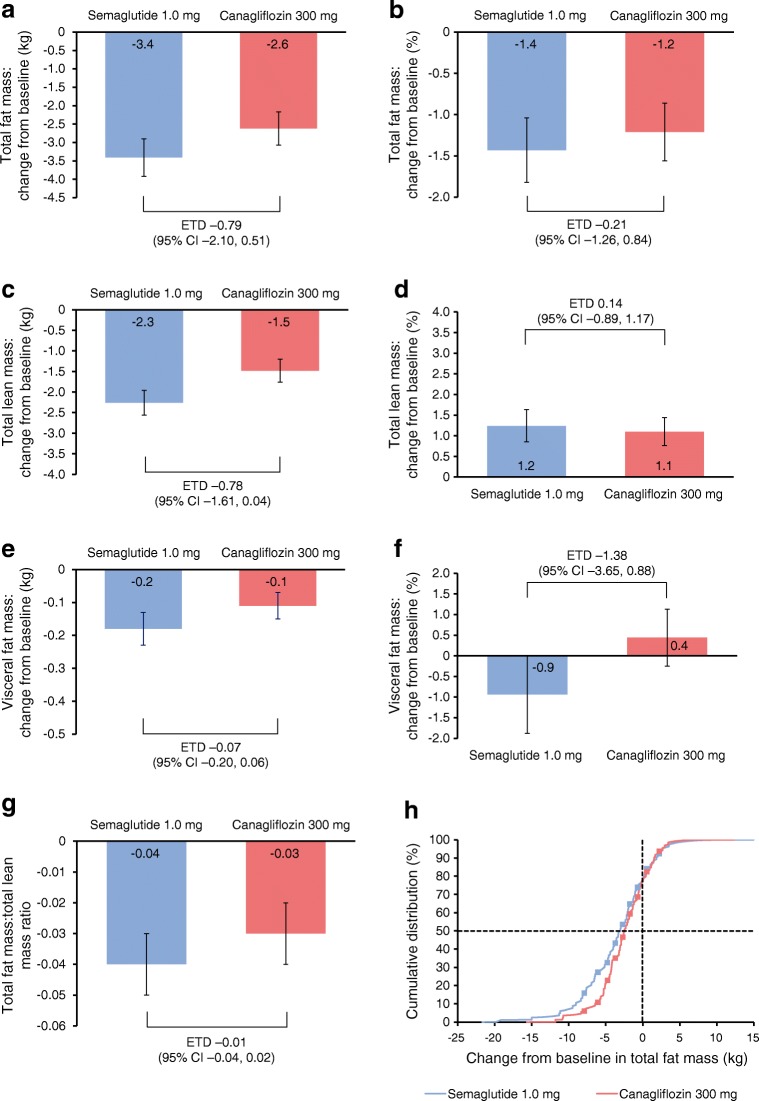
Results: A subset of 178 participants (semaglutide, n = 88; canagliflozin, n = 90) underwent DXA scanning at screening and were randomised into the substudy. Of these, 114 (semaglutide, n = 53; canagliflozin, n = 61) participants had observed end-of-treatment data included in the confirmatory efficacy analysis. Of the 178 participants in the substudy, numerical improvements in body composition (including fat mass, lean mass and visceral fat mass) were observed after 52 weeks with both treatments. Total fat mass (baseline 33.2 kg) was reduced by 3.4 kg and 2.6 kg with semaglutide and canagliflozin, respectively (estimated treatment difference: -0.79 [95% CI -2.10, 0.51]). Although total lean mass (baseline 51.3 kg) was also reduced by 2.3 kg and 1.5 kg with semaglutide and canagliflozin, respectively (estimated treatment difference: -0.78 [-1.61, 0.04]), the proportion of lean mass (baseline 59.4%) increased by 1.2%- and 1.1%-point, respectively (estimated treatment difference 0.14 [-0.89, 1.17]). Changes in visceral fat mass and overall changes in body composition (assessed by the fat to lean mass ratio) were comparable between the two treatment groups.

Conclusions/interpretation: In individuals with uncontrolled type 2 diabetes on stable-dose metformin therapy, the changes in body composition with semaglutide and canagliflozin were not significantly different. Although numerical improvements in body composition were observed following treatment in both treatment arms, the specific impact of both treatments on body composition in the absence of a placebo arm is speculative at this stage.

Trial registration: ClinicalTrials.gov NCT03136484.

Funding: This trial was supported by Novo Nordisk A/S, Denmark.

Keywords: Body composition; Canagliflozin; Fat mass; Glucagon-like peptide receptor agonists; Randomised controlled trial; Semaglutide; Type 2 diabetes; Weight.


Figures

Fig. 1
Fig. 1
Graphical illustration of the closed testing procedure. The overall significance level of α = 0.05 (two-sided) is initially allocated to the HbA1c non-inferiority test. The local significance level (αlocal) will be reallocated if a hypothesis is confirmed according to the weight given by the directed edges between nodes (hypotheses). The total fat-mass superiority test will receive the overall significance of α = 0.05 (two-sided) if, and only if, both HbA1c and body weight superiority are confirmed at their respective local significance levels
Fig. 2
Fig. 2
Participant disposition. aParticipants could meet more than one exclusion criterion. b‘Not assigned’ includes individuals who withdrew consent before randomisation. cParticipants in the substudy were a subset of the overall SUSTAIN 8 trial population. dIn participants for whom data were outside the relevant observation period, only baseline participant data were included in the analysis, and the corresponding end-of-treatment data were multiple imputed. eThe in-trial analysis included all available post-baseline data. Missing data were multiple imputed
Fig. 3
Fig. 3
Body composition outcomes after 52 weeks of treatment. Change from baseline in total fat mass: kg (a) and % (b); total lean mass: kg (c) and % (d); visceral fat mass: kg (e) and % (f); ratio of total fat mass to total lean mass (g); and cumulative change in total fat mass (h). ‘On-treatment without rescue medication’ data ( n =114 [semaglutide, n = 53; canagliflozin, n = 61]). Missing data were multiple imputed using observed data from participants within the same group defined by randomised treatment, using a regression model including region as categorical effect and data from baseline as covariate. (ag) Responses were analysed using an ANCOVA with treatment and region as fixed factors and baseline value as covariate. Regions were defined as North America (USA and Canada); Region Europe (UK, Ireland and Sweden); or International Operations (Lebanon, Malaysia, Argentina, Mexico, Brazil and India). Numbers on the bars may not match the numbers on the scale due to rounding. (h) The dashed line on the y-axis shows the 50th percentile, while the dashed line on the x-axis shows the reference value for no change
Fig. 4
Fig. 4
Correlation of absolute change in total fat mass (kg) with change in body weight (a), HbA1c (b), SBP (c) and DBP (d) after 52 weeks of treatment. Each point represents data (observed or imputed) from one participant. ‘On-treatment without rescue medication’ data for all randomised participants (n = 178 [semaglutide, n = 88; canagliflozin, n = 90]). Missing data were multiple imputed using data from participants within the same group defined by randomised treatment. Data are plotted for the first ten out of 500 imputations. DBP, diastolic BP; SBP, systolic BP
Fig. 5
Fig. 5
Proportion of participants achieving weight loss ≥3%, 5%, 10% or 15% of body weight from baseline after 52 weeks of treatment with semaglutide 1.0 mg (a) and canagliflozin 300 mg (b) in SUSTAIN 8 (n = 788) and the SUSTAIN 8 substudy (n = 178). ‘On-treatment without rescue medication’ data. Missing data were multiple imputed using observed data from participants within the same group defined by randomised treatment, using a regression model including region and stratification factor as categorical effects and data from baseline and all previous visits as covariates. Regions were defined as North America (USA and Canada); Region Europe (UK, Ireland and Sweden); or International Operations (Lebanon, Malaysia, Argentina, Mexico, Brazil and India). This post hoc comparison of change in body weight within the substudy vs the primary study was performed in order to confirm that weight loss in participants undergoing a DXA scan in the substudy was representative of the weight loss in the primary study

References

    1. Gatineau M, Hancock C, Holman N et al (2014) Adult obesity and type 2 diabetes. Available from https://assets.publishing.service.gov.uk/government/uploads/system/uploa.... Accessed 25 November 2019
    1. Van Gaal L, Scheen A. Weight management in type 2 diabetes: current and emerging approaches to treatment. Diabetes Care. 2015;38(6):1161–1172. doi: 10.2337/dc14-1630. - DOI - PubMed
    1. Castro AV, Kolka CM, Kim SP, Bergman RN. Obesity, insulin resistance and comorbidities? Mechanisms of association. Arq Bras Endocrinol Metabol. 2014;58(6):600–609. doi: 10.1590/0004-2730000003223. - DOI - PMC - PubMed
    1. Ormazabal V, Nair S, Elfeky O, Aguayo C, Salomon C, Zuniga FA. Association between insulin resistance and the development of cardiovascular disease. Cardiovasc Diabetol. 2018;17(1):122. doi: 10.1186/s12933-018-0762-4. - DOI - PMC - PubMed
    1. Hubert HB, Feinleib M, McNamara PM, Castelli WP. Obesity as an independent risk factor for cardiovascular disease: a 26-year follow-up of participants in the Framingham Heart Study. Circulation. 1983;67(5):968–977. doi: 10.1161/01.cir.67.5.968. - DOI - PubMed

Publication types

MeSH terms

Associated data