

Trends in Diabetes Management Among US Adults: 1999-2016
- PMID: 31898135
- PMCID: PMC7210372
- DOI: 10.1007/s11606-019-05587-2
Trends in Diabetes Management Among US Adults: 1999-2016
Abstract
Background: Updating national trends in diabetes management is important for identifying areas of progress and remaining gaps in diabetes care.
Objective: Evaluate trends in diabetes management.
Design: Three nationally representative, serial cross-sectional surveys (National Health and Nutrition Examination Survey [n = 5800], National Health Interview Survey [n = 48,519], and Behavioral Risk Factor Surveillance System [n = 741,497]) were used to estimate trends in diabetes management from 1999 to 2016.
Participants: Non-pregnant US adults (aged ≥ 18 years) diagnosed with diabetes.
Main measures: American Diabetes Association's general recommendations for glycemic and cardiovascular risk factor control, medication usage, physical activity, preventive practices, and dietary intake.
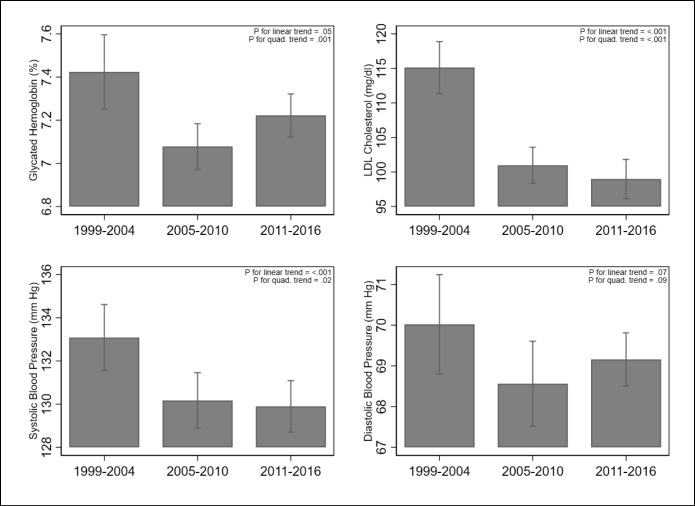
Key results: From 1999 to 2016, the proportion of US adults with diabetes who attained glycemic control (HbA1c < 7.0%) followed a quadratic trend (49.6% in 1999-2004 to 58.6% in 2005-2010 to 55.8% in 2011-2016, P < 0.05 for trend). Control of blood pressure (< 140/90 mmHg) and lipids (LDL cholesterol < 100 mg/dl) increased by 6.6 and 18.7 percentage points, respectively (P < 0.05 for trends). The proportion that attained glycemic, blood pressure, and lipid control followed a quadratic trend (13.3% in 1999-2004 to 24.8% in 2005-2010 to 20.2% in 2011-2016, P < 0.05 for trend). Use of antidiabetic, antihypertensive, and statin medication among those who were eligible rose by 8.6, 5.0, and 24.0 percentage points, respectively (P < 0.05 for trends). Aerobic inactivity declined 7.1 percentage points, while adherence to aerobic activity (≥ 150 min/week) and resistance training (≥ 2 times/week) recommendations grew 3.4 and 3.2 percentage points, respectively (P < 0.05 for trends). Engagement in preventive practices (e.g., receipt of vaccinations) consistently increased for 6 out of 8 outcomes. However, the adherence to saturated fat (< 10% of total daily calories) and sodium (< 2300 mg/day) recommendations fell by 6.5 and 5.2 percentage points (P < 0.05 for trends).
Conclusions: Despite notable improvements, declines in glycemic control and adherence to dietary recommendations may be growing challenges in diabetes care.
Keywords: diabetes mellitus; risk factor control; social disparities.
Conflict of interest statement
The author declares that he does not have a conflict of interest.
Figures
References
-
- Fowler MJ. Microvascular and macrovascular complications of diabetes. Clin Diabetes. 2008;26(2):77–82. doi: 10.2337/diaclin.26.2.77. - DOI
Publication types
MeSH terms
Substances
Grants and funding
LinkOut - more resources
Full Text Sources
Medical
