Meta-Analysis
. 2020 Jan 3;18(1):1.
doi: 10.1186/s12916-019-1443-1.

Drug-resistant enteric fever worldwide, 1990 to 2018: a systematic review and meta-analysis

Affiliations
Meta-Analysis

Drug-resistant enteric fever worldwide, 1990 to 2018: a systematic review and meta-analysis

Annie J Browne et al. BMC Med. .

Abstract

Background: Antimicrobial resistance (AMR) is an increasing threat to global health. There are > 14 million cases of enteric fever every year and > 135,000 deaths. The disease is primarily controlled by antimicrobial treatment, but this is becoming increasingly difficult due to AMR. Our objectives were to assess the prevalence and geographic distribution of AMR in Salmonella enterica serovars Typhi and Paratyphi A infections globally, to evaluate the extent of the problem, and to facilitate the creation of geospatial maps of AMR prevalence to help targeted public health intervention.

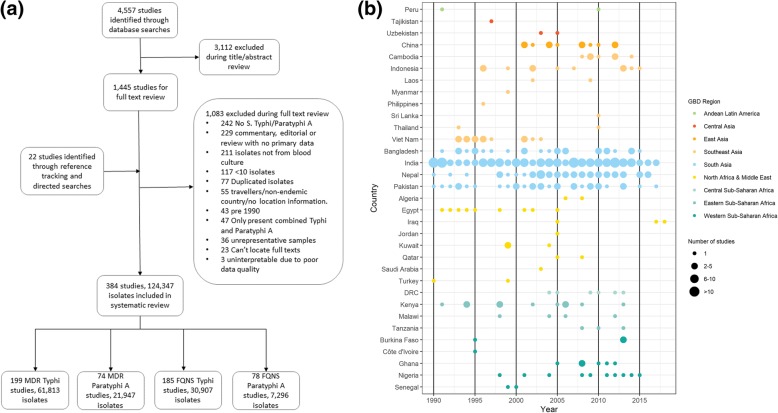
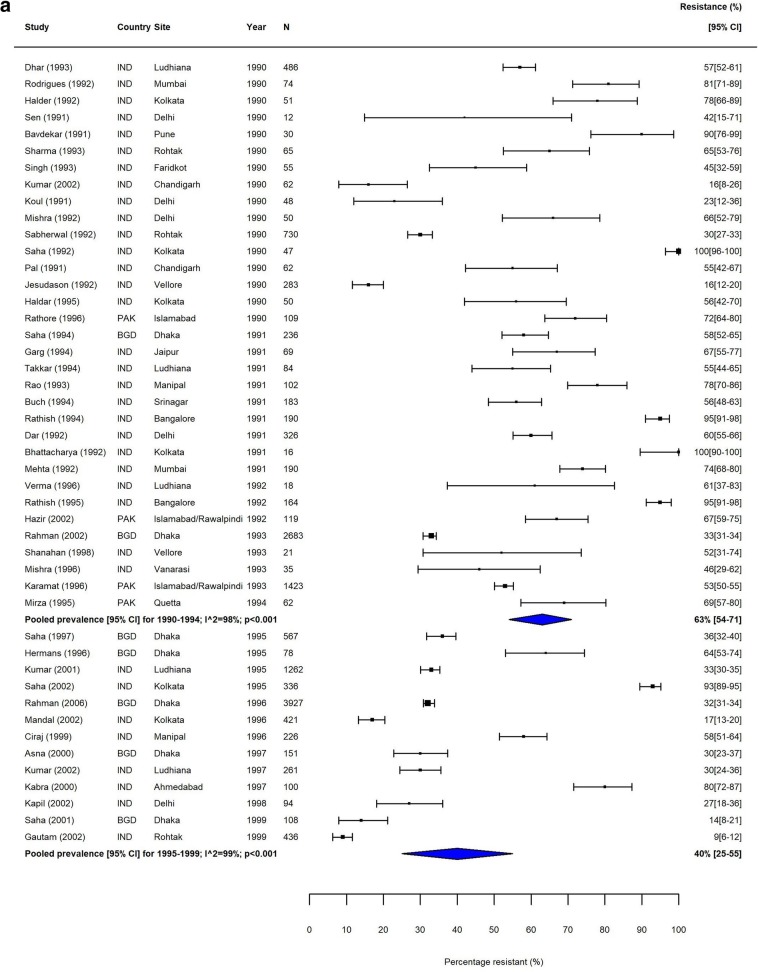
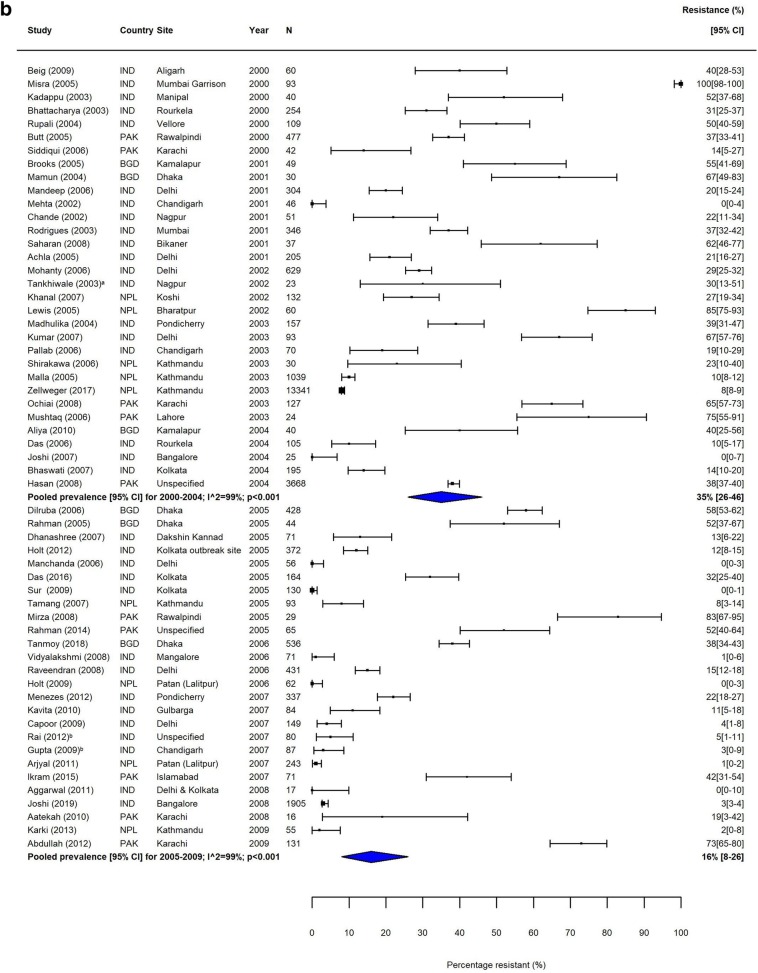
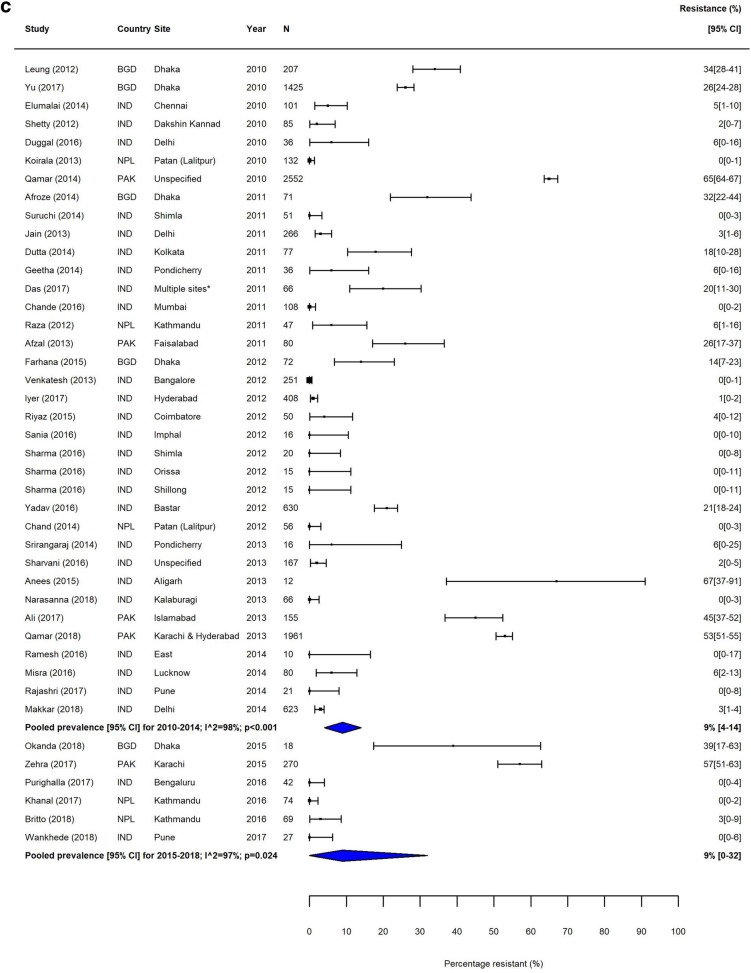
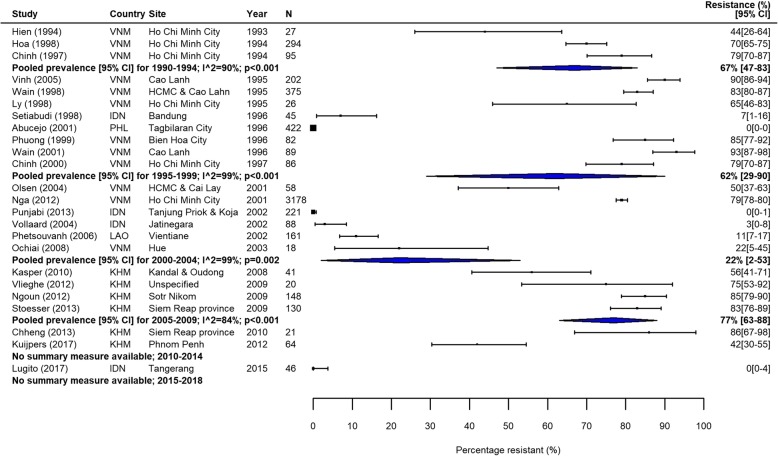
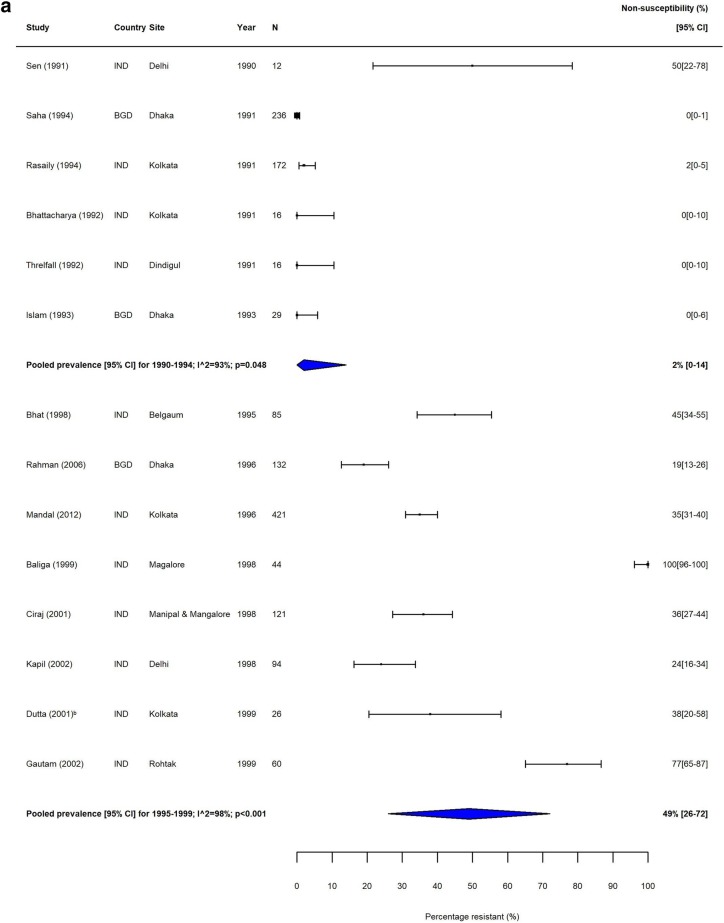
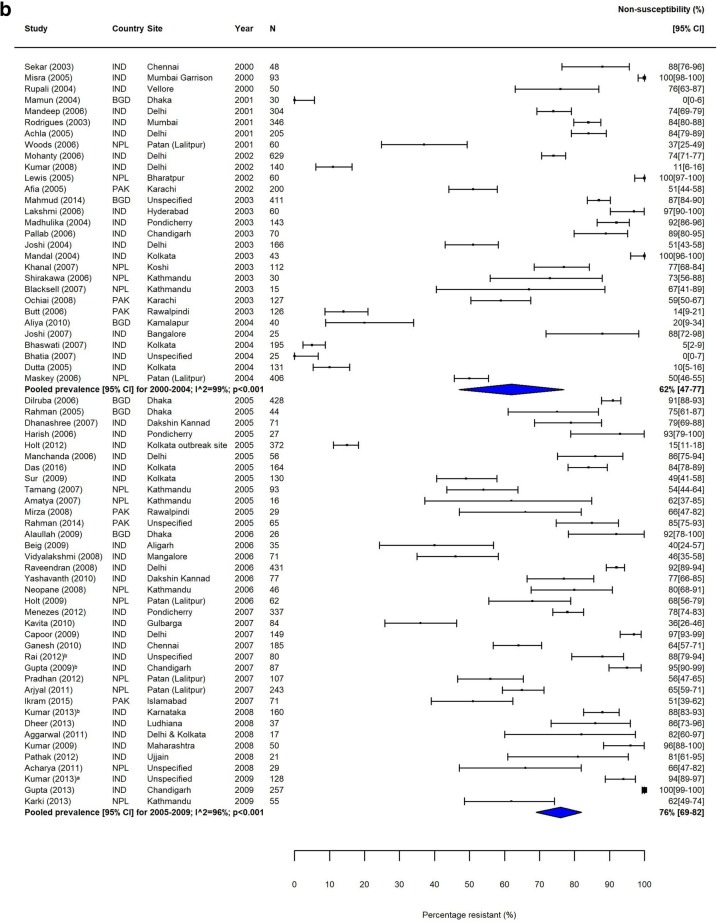
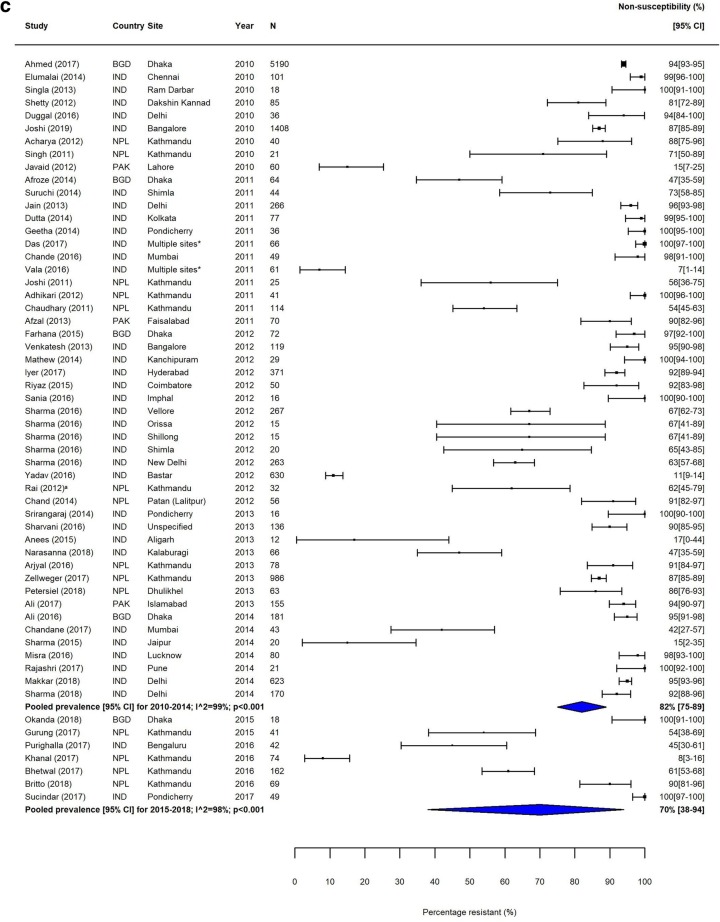
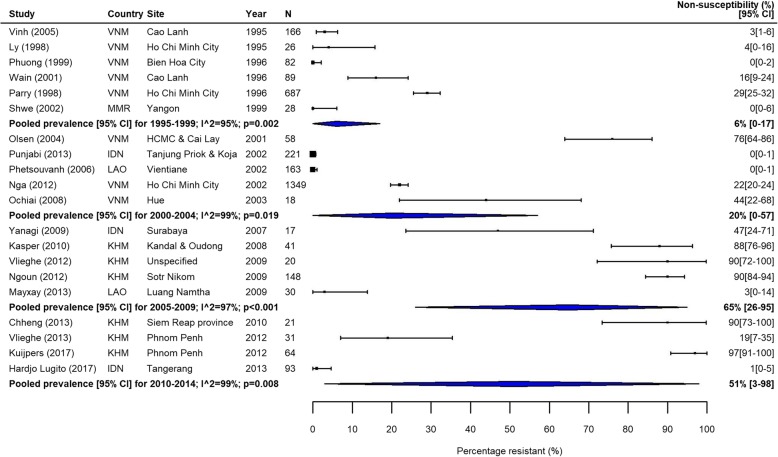
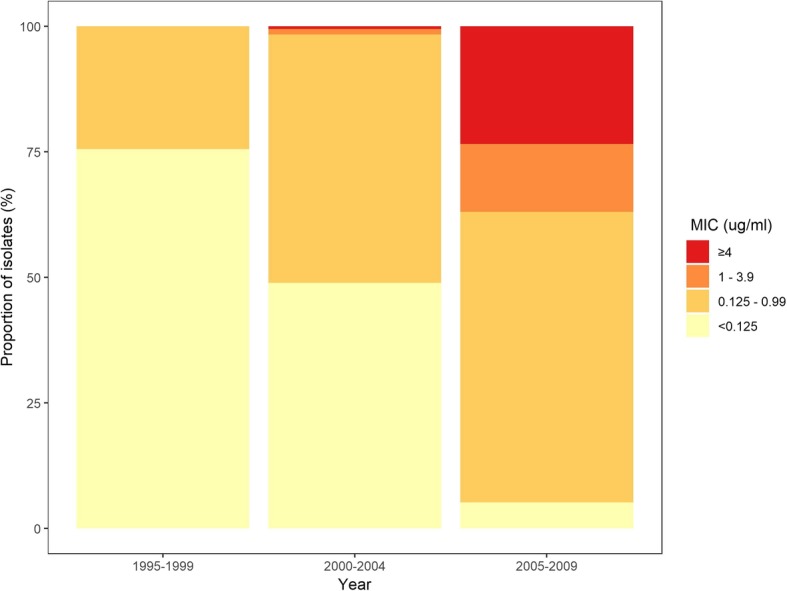
Methods: We performed a systematic review of the literature by searching seven databases for studies published between 1990 and 2018. We recategorised isolates to allow the analysis of fluoroquinolone resistance trends over the study period. The prevalence of multidrug resistance (MDR) and fluoroquinolone non-susceptibility (FQNS) in individual studies was illustrated by forest plots, and a random effects meta-analysis was performed, stratified by Global Burden of Disease (GBD) region and 5-year time period. Heterogeneity was assessed using the I2 statistics. We present a descriptive analysis of ceftriaxone and azithromycin resistance.

Findings: We identified 4557 articles, of which 384, comprising 124,347 isolates (94,616 S. Typhi and 29,731 S. Paratyphi A) met the pre-specified inclusion criteria. The majority (276/384; 72%) of studies were from South Asia; 40 (10%) articles were identified from Sub-Saharan Africa. With the exception of MDR S. Typhi in South Asia, which declined between 1990 and 2018, and MDR S. Paratyphi A, which remained at low levels, resistance trends worsened for all antimicrobials in all regions. We identified several data gaps in Africa and the Middle East. Incomplete reporting of antimicrobial susceptibility testing (AST) and lack of quality assurance were identified.

Interpretation: Drug-resistant enteric fever is widespread in low- and middle-income countries, and the situation is worsening. It is essential that public health and clinical measures, which include improvements in water quality and sanitation, the deployment of S. Typhi vaccination, and an informed choice of treatment are implemented. However, there is no licenced vaccine for S. Paratyphi A. The standardised reporting of AST data and rollout of external quality control assessment are urgently needed to facilitate evidence-based policy and practice.

Trial registration: PROSPERO CRD42018029432.

Keywords: Antimicrobial drug resistance; Azithromycin resistance; Ceftriaxone resistance; Drug-resistant infections; ESBL-producing; Enteric fever; Fluoroquinolone resistance; Harmonisation of breakpoints; Meta-analysis; Multidrug resistance; Paratyphoid fever; Prevalence of resistance; Salmonella Paratyphi A; Salmonella Typhi; Typhoid fever.


Conflict of interest statement

The authors declare that they have no competing interests.

Figures

Fig. 1
Fig. 1
Study selection. a PRISMA flow chart depicting study screening and selection; approximately 150 studies were received from the Bodleian Library/British National Library. b Data availability plotted by year (x-axis) and country (y‐axis), grouped by region. The number of studies for each country‐year is depicted by the size of the point
Fig. 2
Fig. 2
MDR S. Typhi in South Asia. Forest plots illustrating the prevalence of MDR amongst S. Typhi strains isolates in South Asia, grouped by 5‐year time periods. Individual study results are displayed with 95% confidence intervals; the pooled prevalence [95%CI] for each subgroup is represented by the blue diamond: a 1990–1999, b 2000–2009, and c 2010–2018. Multidrug resistance is defined as concurrent resistance against ampicillin, chloramphenicol and co‐trimoxazole
Fig. 2
Fig. 2
MDR S. Typhi in South Asia. Forest plots illustrating the prevalence of MDR amongst S. Typhi strains isolates in South Asia, grouped by 5‐year time periods. Individual study results are displayed with 95% confidence intervals; the pooled prevalence [95%CI] for each subgroup is represented by the blue diamond: a 1990–1999, b 2000–2009, and c 2010–2018. Multidrug resistance is defined as concurrent resistance against ampicillin, chloramphenicol and co‐trimoxazole
Fig. 3
Fig. 3
MDR S. Typhi in Southeast Asia. Forest plots illustrating the prevalence of MDR amongst S. Typhi strains isolates in Southeast Asia, grouped by 5‐year time periods. Individual study results are displayed with 95% confidence intervals; the pooled prevalence [95%CI] for each subgroup is represented by the blue diamond. Multidrug resistance is defined as concurrent resistance against ampicillin, chloramphenicol and co‐trimoxazole
Fig. 4
Fig. 4
FQNS S. Typhi in South Asia. Forest plots illustrating the prevalence of FQNS amongst S. Typhi in South Asia, grouped by 5‐year time periods. Individual study results are displayed with 95% confidence intervals; the pooled prevalence [95%CI] for each subgroup is represented by the blue diamonds: a 1990–1999, b 2000–2009, and c 2010–2018. To allow the analysis of resistance trends over time despite typhoid‐specific breakpoint changes for ciprofloxacin (CLSI, 2012) coming into effect during our study (1990–2018), we categorised intermediate (ciprofloxacin MIC 0.12–0.5 μg/ml) and resistant strains isolates (≥ 1 μg/ml) according to the updated breakpoints, as well as isolates with ‘decreased ciprofloxacin (or fluoroquinolone) susceptibility’ (ciprofloxacin MIC 0.125–1.0 μg/ml) and nalidixic acid-resistant strains isolates (as proxy marker for ‘decreased ciprofloxacin (or fluoroquinolone) susceptibility’) as fluoroquinolone non‐susceptible (FQNS)
Fig. 4
Fig. 4
FQNS S. Typhi in South Asia. Forest plots illustrating the prevalence of FQNS amongst S. Typhi in South Asia, grouped by 5‐year time periods. Individual study results are displayed with 95% confidence intervals; the pooled prevalence [95%CI] for each subgroup is represented by the blue diamonds: a 1990–1999, b 2000–2009, and c 2010–2018. To allow the analysis of resistance trends over time despite typhoid‐specific breakpoint changes for ciprofloxacin (CLSI, 2012) coming into effect during our study (1990–2018), we categorised intermediate (ciprofloxacin MIC 0.12–0.5 μg/ml) and resistant strains isolates (≥ 1 μg/ml) according to the updated breakpoints, as well as isolates with ‘decreased ciprofloxacin (or fluoroquinolone) susceptibility’ (ciprofloxacin MIC 0.125–1.0 μg/ml) and nalidixic acid-resistant strains isolates (as proxy marker for ‘decreased ciprofloxacin (or fluoroquinolone) susceptibility’) as fluoroquinolone non‐susceptible (FQNS)
Fig. 5
Fig. 5
FQNS S. Typhi in Southeast Asia. Forest plots illustrating the prevalence of FQNS amongst S. Typhi in South Asia, grouped by 5‐year time periods. Individual study results are displayed with 95% confidence intervals; the pooled prevalence [95%CI] for each subgroup is represented by the blue diamonds
Fig. 6
Fig. 6
Stacked bar chart of S. Typhi ciprofloxacin MIC distributions. Data are from three selected studies [–66] with sample sizes of more than 90 strains isolates performed in Delhi, India

References

    1. GBD Typhoid and Paratyphoid Collaborators The global burden of typhoid and paratyphoid fevers: a systematic analysis for the Global Burden of Disease Study 2017. Lancet Infect Dis. 2019;19(4):369–381. doi: 10.1016/S1473-3099(18)30685-6. - DOI - PMC - PubMed
    1. Deen J, von Seidlein L, Andersen F, Elle N, White NJ, Lubell Y. Community-acquired bacterial bloodstream infections in developing countries in South and Southeast Asia: a systematic review. Lancet Infect Dis. 2012;12(6):480–487. doi: 10.1016/S1473-3099(12)70028-2. - DOI - PubMed
    1. Reddy EA, Shaw AV, Crump JA. Community-acquired bloodstream infections in Africa: a systematic review and meta-analysis. Lancet Infect Dis. 2010;10(6):417–432. doi: 10.1016/S1473-3099(10)70072-4. - DOI - PMC - PubMed
    1. Maskey AP, Day JN, Phung QT, Thwaites GE, Campbell JI, Zimmerman M, et al. Salmonella enterica serovar Paratyphi A and S. enterica serovar Typhi cause indistinguishable clinical syndromes in Kathmandu, Nepal. Clin Infect Dis. 2006;42(9):1247–1253. doi: 10.1086/503033. - DOI - PubMed
    1. Ochiai RL, Wang X, von Seidlein L, Yang J, Bhutta ZA, Bhattacharya SK, et al. Salmonella paratyphi A rates. Asia Emerg Infect Dis. 2005;11(11):1764–1766. doi: 10.3201/eid1111.050168. - DOI - PMC - PubMed

Publication types

MeSH terms

LinkOut - more resources