

Association between short-term exposure to air pollution and ischemic stroke onset: a time-stratified case-crossover analysis using a distributed lag nonlinear model in Shenzhen, China
- PMID: 31898503
- PMCID: PMC6941275
- DOI: 10.1186/s12940-019-0557-4
Association between short-term exposure to air pollution and ischemic stroke onset: a time-stratified case-crossover analysis using a distributed lag nonlinear model in Shenzhen, China
Abstract
Background: Stroke, especially ischemic stroke (IS), has been a severe public health problem around the world. However, the association between air pollution and ischemic stroke remains ambiguous.
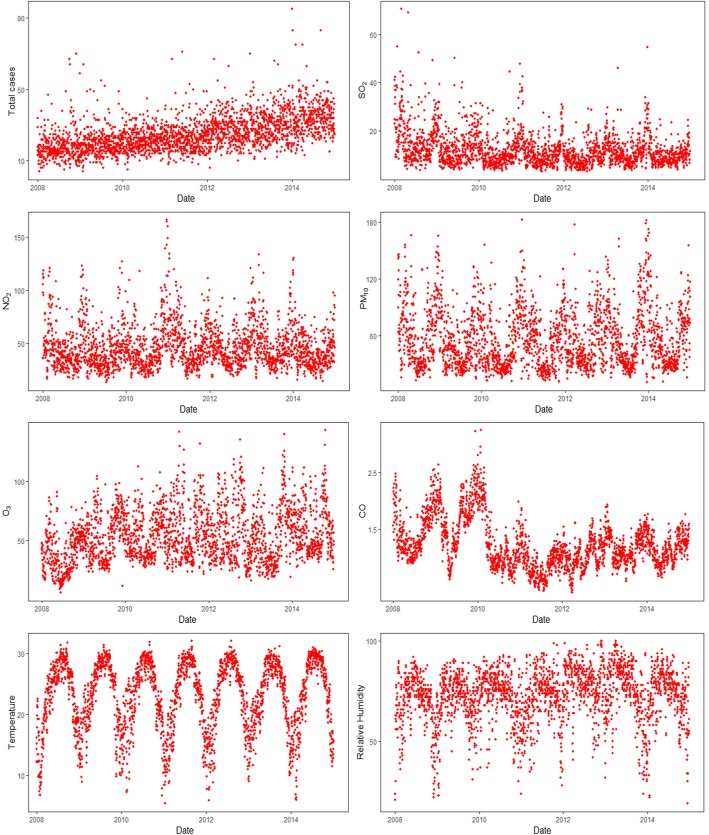
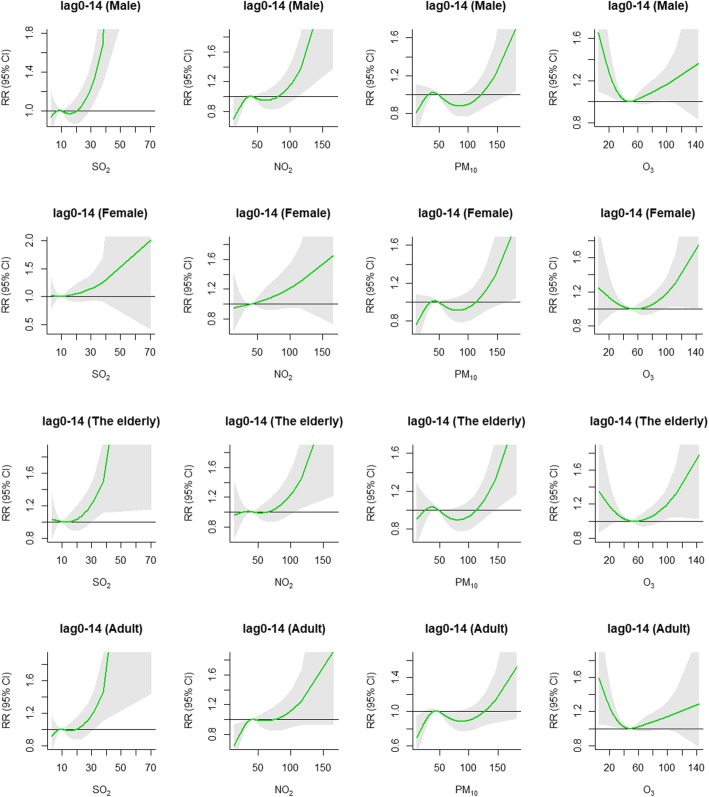
Methods: A total of 63, 997 IS cases aged 18 years or above in Shenzhen were collected from 2008 to 2014. We used the time-stratified case-crossover design combining with distributed lag nonlinear model (DLNM) to estimate the association between air pollution and IS onset. Furthermore, this study explored the variability across gender and age groups.
Results: The cumulative exposure-response curves were J-shaped for SO2, NO2 and PM10, and V-shaped for O3, and crossed over the relative risk (RR) of one. The 99th, 50th (median) and 1st percentiles of concentration (μg/m3) respectively were 37.86, 10.06, 3.71 for SO2, 116.26, 41.29, 18.51 for NO2, 145.94, 48.29, 16.14 for PM10, and 111.57, 49.82, 16.00 for O3. Extreme high-SO2, high-NO2, high-PM10, high-O3, and low-O3 concentration increased the risk of IS, with the maximum RR values and 95% CIs: 1.50(1.22, 1.84) (99th vs median) at 0-12 lag days, 1.37(1.13, 1.67) (99th vs median) at 0-10 lag days, 1.26(1.04, 1.53) (99th vs median) at 0-12 lag days, 1.25(1.04, 1.49) (99th vs median) at 0-14 lag days, and 1.29(1.03, 1.61) (1st vs median) at 0-14 lag days, respectively. The statistically significant minimal RR value and 95% CI was 0.79(0.66,0.94) at 0-10 lag days for extreme low-PM10. The elderly aged over 65 years were susceptible to extreme pollution conditions. Difference from the vulnerability of males to extreme high-SO2, high-NO2 and low-O3, females were vulnerable to extreme high-PM10 and high-O3. Comparing with the elderly, adults aged 18-64 year were immune to extreme low-NO2 and low-PM10. However, no association between CO and IS onset was found.
Conclusions: SO2, NO2, PM10 and O3 exerted non-linear and delayed influence on IS, and such influence varied with gender and age. These findings may have significant public health implications for the prevention of IS.
Keywords: Air pollution; Case-crossover design; Distributed lag nonlinear model; Ischemic stroke; Quasi-Poisson regression.
Conflict of interest statement
The authors declare that they have no competing interests.
Figures


Similar articles
-
Effects of short-term exposure to air pollution on hospital admissions of young children for acute lower respiratory infections in Ho Chi Minh City, Vietnam.Res Rep Health Eff Inst. 2012 Jun;(169):5-72; discussion 73-83. Res Rep Health Eff Inst. 2012. PMID: 22849236
-
Multicity study of air pollution and mortality in Latin America (the ESCALA study).Res Rep Health Eff Inst. 2012 Oct;(171):5-86. Res Rep Health Eff Inst. 2012. PMID: 23311234
-
Part 2. Association of daily mortality with ambient air pollution, and effect modification by extremely high temperature in Wuhan, China.Res Rep Health Eff Inst. 2010 Nov;(154):91-217. Res Rep Health Eff Inst. 2010. PMID: 21446212
-
Association between exposure to ambient air pollution and hospital admission, incidence, and mortality of stroke: an updated systematic review and meta-analysis of more than 23 million participants.Environ Health Prev Med. 2021 Jan 26;26(1):15. doi: 10.1186/s12199-021-00937-1. Environ Health Prev Med. 2021. PMID: 33499804 Free PMC article.
-
Short-term Exposure to Air Pollution and Ischemic Stroke: A Systematic Review and Meta-analysis.Neurology. 2023 Nov 7;101(19):e1922-e1932. doi: 10.1212/WNL.0000000000207856. Epub 2023 Sep 27. Neurology. 2023. PMID: 37758483 Free PMC article.
Cited by
-
Air Pollution and Ischaemic Stroke.Ann Indian Acad Neurol. 2022 Sep;25(Suppl 1):S26-S34. doi: 10.4103/aian.aian_1130_21. Epub 2022 May 3. Ann Indian Acad Neurol. 2022. PMID: 36213103 Free PMC article.
-
Effect of ambient temperature and other environmental factors on stroke emergency department visits in Beijing: A distributed lag non-linear model.Front Public Health. 2022 Nov 16;10:1034534. doi: 10.3389/fpubh.2022.1034534. eCollection 2022. Front Public Health. 2022. PMID: 36466462 Free PMC article.
-
The protracted neurotoxic consequences in mice of developmental exposures to inhaled iron nanoparticles alone or in combination with SO2.Front Behav Neurosci. 2025 Jul 25;19:1544974. doi: 10.3389/fnbeh.2025.1544974. eCollection 2025. Front Behav Neurosci. 2025. PMID: 40786615 Free PMC article.
-
Machine Learning Potential for Identifying and Forecasting Complex Environmental Drivers of Vibrio vulnificus Infections in the United States.Environ Health Perspect. 2025 Jan;133(1):17006. doi: 10.1289/EHP15593. Epub 2025 Jan 23. Environ Health Perspect. 2025. PMID: 39847704 Free PMC article.
-
Short-Term Effects of Low-Level Ambient Air NO2 on the Risk of Incident Stroke in Enshi City, China.Int J Environ Res Public Health. 2022 May 30;19(11):6683. doi: 10.3390/ijerph19116683. Int J Environ Res Public Health. 2022. PMID: 35682266 Free PMC article.
References
-
- GBD 2013 Mortality and Causes of Death Collaborators Global, regional, and national age-sex specific all-cause and cause-specific mortality for 240 causes of death, 1990–2013: A systematic analysis for the global burden of disease study 2013. Lancet. 2015;385(9963):117–171. doi: 10.1016/S0140-6736(14)61682-2. - DOI - PMC - PubMed
-
- Murray CJ, Barber RM, Foreman KJ, et al. Global, regional, and national disability-adjusted life years (DALYs) for 306 diseases and injuries and healthy life expectancy (HALE) for 188 countries, 1990-2013: Quantifying the epidemiological transition. Lancet. 2015;386(10009):2145–2191. doi: 10.1016/S0140-6736(15)61340-X. - DOI - PMC - PubMed
Publication types
MeSH terms
Substances
Grants and funding
LinkOut - more resources
Full Text Sources
Medical
