Comparative Study
. 2020 Jan 2;18(1):1.
doi: 10.1186/s12915-019-0728-3.

Evolutionary superscaffolding and chromosome anchoring to improve Anopheles genome assemblies

Affiliations
Comparative Study

Evolutionary superscaffolding and chromosome anchoring to improve Anopheles genome assemblies

Robert M Waterhouse et al. BMC Biol. .

Abstract

Background: New sequencing technologies have lowered financial barriers to whole genome sequencing, but resulting assemblies are often fragmented and far from 'finished'. Updating multi-scaffold drafts to chromosome-level status can be achieved through experimental mapping or re-sequencing efforts. Avoiding the costs associated with such approaches, comparative genomic analysis of gene order conservation (synteny) to predict scaffold neighbours (adjacencies) offers a potentially useful complementary method for improving draft assemblies.

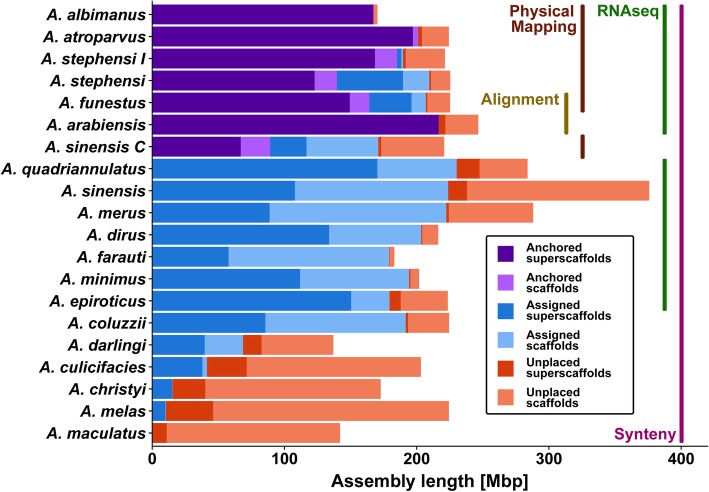
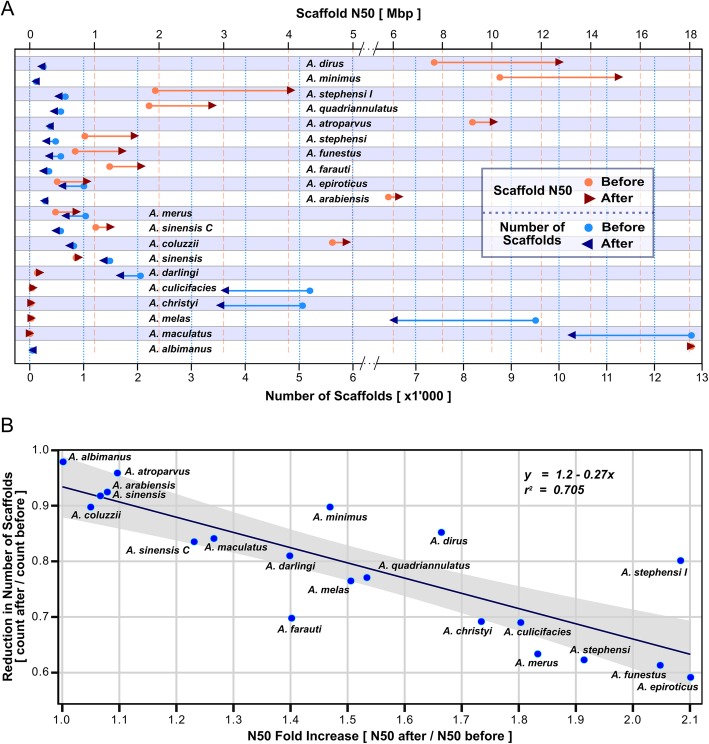
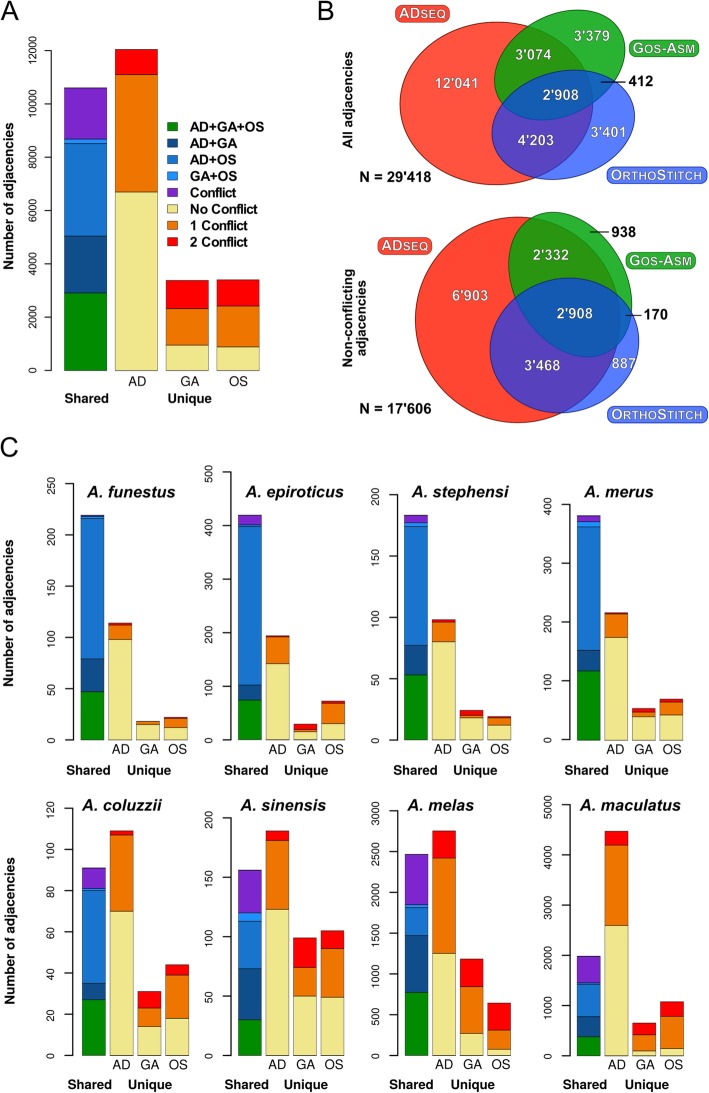
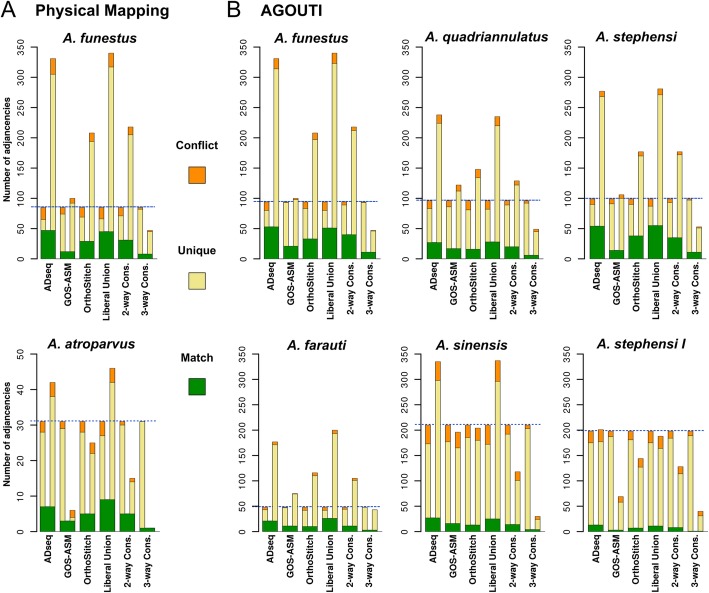
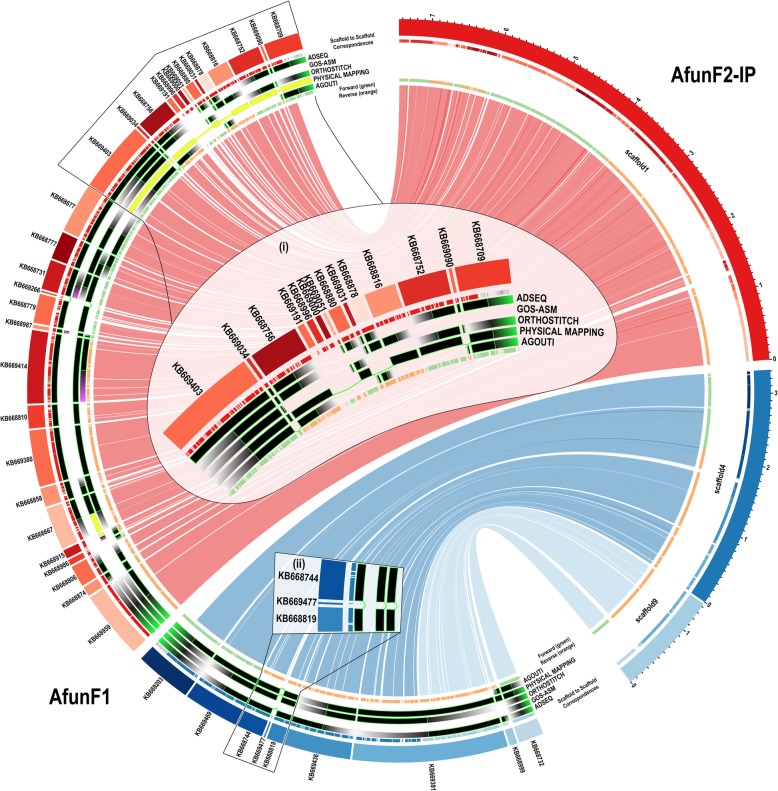
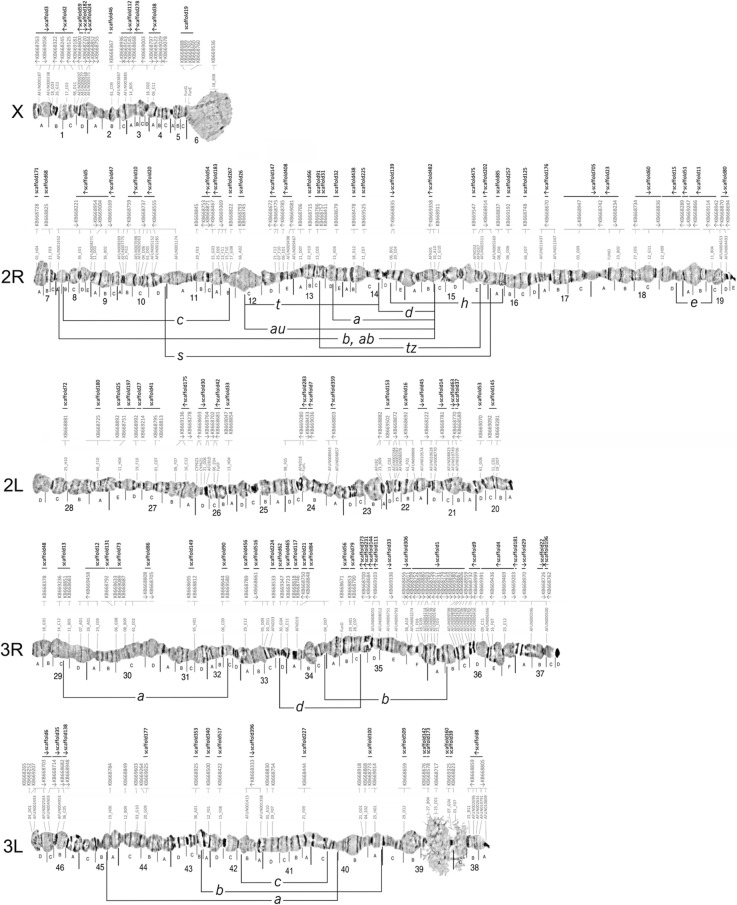
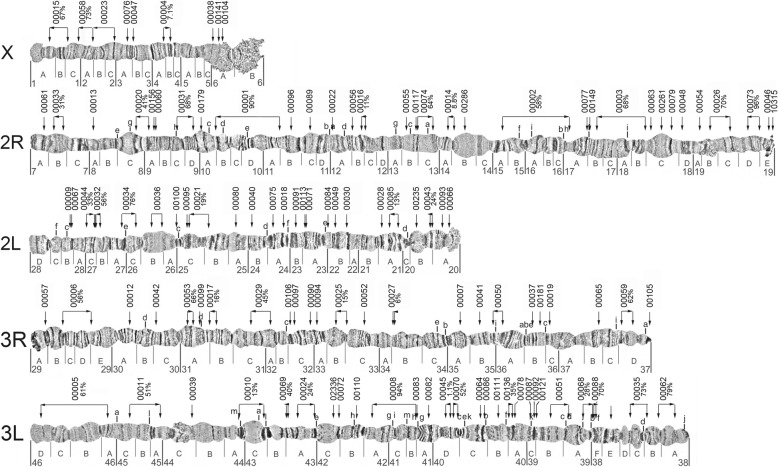
Results: We evaluated and employed 3 gene synteny-based methods applied to 21 Anopheles mosquito assemblies to produce consensus sets of scaffold adjacencies. For subsets of the assemblies, we integrated these with additional supporting data to confirm and complement the synteny-based adjacencies: 6 with physical mapping data that anchor scaffolds to chromosome locations, 13 with paired-end RNA sequencing (RNAseq) data, and 3 with new assemblies based on re-scaffolding or long-read data. Our combined analyses produced 20 new superscaffolded assemblies with improved contiguities: 7 for which assignments of non-anchored scaffolds to chromosome arms span more than 75% of the assemblies, and a further 7 with chromosome anchoring including an 88% anchored Anopheles arabiensis assembly and, respectively, 73% and 84% anchored assemblies with comprehensively updated cytogenetic photomaps for Anopheles funestus and Anopheles stephensi.

Conclusions: Experimental data from probe mapping, RNAseq, or long-read technologies, where available, all contribute to successful upgrading of draft assemblies. Our evaluations show that gene synteny-based computational methods represent a valuable alternative or complementary approach. Our improved Anopheles reference assemblies highlight the utility of applying comparative genomics approaches to improve community genomic resources.

Keywords: Bioinformatics; Chromosomes; Comparative genomics; Computational evolutionary biology; Gene synteny; Genome assembly; Mosquito genomes; Orthology; Physical mapping.


Conflict of interest statement

The authors declare that they have no competing interests.

Figures

Fig. 1
Fig. 1
Genomic spans of scaffolds and superscaffolds with and without chromosome anchoring or arm assignments for 20 improved Anopheles assemblies. Consensus gene synteny-based methods were employed across the 21-assembly input dataset (also including Anopheles gambiae) to delineate scaffold adjacencies and build new superscaffolded assemblies with improved contiguities. These were integrated with results from additional complementary approaches for subsets of the anophelines including transcriptome (RNAseq) and genome sequencing data, whole genome alignments, and chromosome anchoring data from physical mapping of probes. Chromosome mapping data for 7 assemblies enabled anchoring of superscaffolds and scaffolds to their chromosomal locations (purple colours). Enumerating shared orthologues further enabled the assignment of non-anchored superscaffolds and scaffolds to chromosome arms (blue colours). Unplaced superscaffolds and scaffolds (orange colours) still comprise the majority of the least contiguous input assemblies, but they make up only a small proportion of the assemblies for which the available data allowed for substantial improvements to assembly contiguity and/or anchoring and/or arm assignments. Results for two strains are shown for Anopheles sinensis, SINENSIS and Chinese (C), and Anopheles stephensi, SDA-500 and Indian (I)
Fig. 2
Fig. 2
Improved genome assemblies for 20 anophelines from solely synteny-based scaffold adjacency predictions. Results from ADseq, Gos-Asm, and OrthoStitch predictions were compared to define two-way consensus adjacencies predicted by at least two of the three approaches, where the third approach did not conflict. These adjacencies were used to build new assemblies with improved contiguities, quantified by comparing before and after scaffold counts and N50 values (half the total assembly length comprises scaffolds of length N50 or longer). The counts, values, and ratios represent only scaffolds with annotated orthologous genes used as the input dataset for the scaffold adjacency predictions. To make the N50s before and after superscaffolding directly comparable, the values for the new assemblies do not include the 100 Ns used to join scaffold adjacencies. a Scaffold counts (blues, bottom axis) and N50 values (red/orange, top axis) are shown before (dots) and after (arrowheads) synteny-based improvements were applied. The 20 anopheline assemblies are ordered from the greatest N50 improvement at the top for Anopheles dirus to the smallest at the bottom for Anopheles albimanus. Note axis scale changes for improved visibility after N50 of 5 Mbp and scaffold count of 6000. b Plotting before to after ratios of scaffold counts versus N50 values (counts or N50 after/counts or N50 before superscaffolding of the adjacencies) reveals a general trend of a ~ 33% reduction in scaffold numbers resulting in a ~ 2-fold increase of N50 values. The line shows the linear regression with a 95% confidence interval in grey. Results for two strains are shown for Anopheles sinensis, SINENSIS and Chinese (C), and Anopheles stephensi, SDA-500 and Indian (I)
Fig. 3
Fig. 3
Comparisons of synteny-based scaffold adjacency predictions from ADseq (AD), Gos-Asm (GA), and OrthoStitch (OS). Bar charts show counts of predicted adjacencies (pairs of neighbouring scaffolds) that are shared amongst all three methods (green), or two methods without (blues) and with (purple) third-method conflicts, or that are unique to a single method and do not conflict (yellow) or do conflict with predictions from one (orange) or both (red) of the other methods. a Results of all adjacencies summed across all 20 anopheline assemblies. b Area-proportional Euler diagrams showing (top) the extent of the agreements amongst the three methods for all 29,418 distinct scaffold adjacencies, and (bottom) the extent of the agreements amongst the three methods for the 17,606 distinct and non-conflicting scaffold adjacencies (the liberal union sets), both summed over all 20 assemblies. c Individual results of adjacencies for representative anopheline assemblies, four with more than 50% agreement (top row), and four with lower levels of agreement (bottom row). Colours for each fraction are the same as in a, y-axes vary for each assembly with maxima of 120 for Anopheles coluzzii to 5000 for Anopheles maculatus. Results for Anopheles stephensi are for the SDA-500 strain
Fig. 4
Fig. 4
Comparisons of synteny-based scaffold adjacency predictions with physical mapping and RNA sequencing data. The bar charts show counts from each set of synteny-based scaffold adjacency predictions compared with the adjacencies from the physical mapping (a) or RNAseq Agouti-based (b) sets. The synteny-based sets comprise predictions from three different methods, ADseq, Gos-Asm, and OrthoStitch, as well as their liberal union (all non-conflicting predictions), their two-way consensus (2-way Cons. predicted by two methods and not conflicting with the third method), and their three-way consensus (3-way Cons. predicted by all three methods). Adjacencies that are exactly matching form the green base common to both sets in each comparison, from which extend bars showing physical mapping or Agouti adjacency counts (left) and synteny-based adjacency counts (right) that are unique (yellow) or conflicting (orange) in each comparison. Blue dashed lines highlight the total adjacencies for the physical mapping or Agouti sets. For comparison, all y-axes are fixed at a maximum of 350 adjacencies, except for Anopheles atroparvus. Results for two strains are shown for Anopheles stephensi, SDA-500 and Indian (I)
Fig. 5
Fig. 5
Whole genome alignment comparisons of selected Anopheles funestus AfunF1 and AfunF2-IP scaffolds. The plot shows correspondences of three AfunF2-IP scaffolds (right) with AfunF1 (left) scaffolds based on whole genome alignments, with links coloured according to their AfunF2-IP scaffold. Putative adjacencies between AfunF1 scaffolds are highlighted with tracks showing confirmed neighbours (black with bright green borders), supported neighbours with conflicting orientations (yellow), scaffolds with putative adjacencies that conflict with the alignments (purple gradient), scaffolds without putative adjacencies and thus no conflicts with the alignments (grey gradient) for: from outer to inner tracks, ADseq, Gos-Asm, OrthoStitch, physical mapping, and Agouti. The innermost track shows alignments in forward (green) and reverse (orange) orientations. The outermost track shows alignments coloured according to the corresponding scaffold in the other assemblies (light grey if aligned to scaffolds not shown). Inset (i) shows how corrected orientations of physically mapped scaffolds agree with the other methods. Inset (ii) shows how the alignments identified a short scaffold that was placed between two scaffolds identified by three other methods
Fig. 6
Fig. 6
The Anopheles funestus cytogenetic photomap of polytene chromosomes with anchored scaffolds from the AfunF1 and AfunF2-IP assemblies. FISH-mapped DNA markers (grey probe identifiers directly above each chromosome) show the density of physical mapping along the chromosome arm subdivisions (labelled with letters A, B, C, etc. directly below each chromosome) and divisions (labelled with numbers 1–46 below the subdivision labels). Scaffolds from the AfunF1 (KB66XXXX identifiers, grey font and thin horizontal lines) and AfunF2-IP (scaffoldXX identifiers, black font and thick horizontal lines) assemblies are ordered along the photomap above each chromosome. Orientation of the scaffolds in the genome, if known, is shown by the arrows below each of the scaffold identifiers. Known polymorphic inversions are shown for chromosome arms 2R, 3R, and 3L
Fig. 7
Fig. 7
The Anopheles stephensi cytogenetic photomap of polytene chromosomes with anchored scaffolds from the AsteI2 assembly. The updated cytogenetic photomap is shown with chromosome arm subdivisions (labelled with letters A, B, C, etc. directly below each chromosome) and divisions (labelled with numbers 1–46 below the subdivision labels). Locations of known polymorphic inversions are indicated with lowercase letters above chromosome arms 2R, 2L, 3R, and 3L. The AsteI2 assembly identifiers of the 118 mapped scaffolds are shown above each chromosome arm (scaffold identifiers are abbreviated, e.g. ‘scaffold_00001’ is shown on the map as ‘00001’), and the locations of FISH probes used to map the scaffolds are shown with downward-pointing arrows. For scaffolds with two mapped FISH probes, the orientations along the genome map are shown with horizontal arrows below each of the scaffold identifiers, with labels indicating the proportion (%) of each scaffold located between the probe pairs

References

    1. Bauman JGJ, Wiegant J, Borst P, van Duijn P. A new method for fluorescence microscopical localization of specific DNA sequences by in situ hybridization of fluorochrome-labelled RNA. Exp Cell Res. 1980;128:485–490. doi: 10.1016/0014-4827(80)90087-7. - DOI - PubMed
    1. Hahn MW, Zhang SV, Moyle LC. Sequencing, assembling, and correcting draft genomes using recombinant populations. G3. 2014;4:669–679. doi: 10.1534/g3.114.010264. - DOI - PMC - PubMed
    1. Fierst JL. Using linkage maps to correct and scaffold de novo genome assemblies: methods, challenges, and computational tools. Frontiers Genet. 2015;6:220. doi: 10.3389/fgene.2015.00220. - DOI - PMC - PubMed
    1. Levy-Sakin M, Ebenstein Y. Beyond sequencing: optical mapping of DNA in the age of nanotechnology and nanoscopy. Curr Opin Biotechnol. 2013;24:690–698. doi: 10.1016/j.copbio.2013.01.009. - DOI - PubMed
    1. Kaplan N, Dekker J. High-throughput genome scaffolding from in vivo DNA interaction frequency. Nat Biotechnol. 2013;31:1143–1147. doi: 10.1038/nbt.2768. - DOI - PMC - PubMed

Publication types

LinkOut - more resources