. 2020 Jan 2;20(1):3.
doi: 10.1186/s12885-019-6465-8.

Loss of Stag2 cooperates with EWS-FLI1 to transform murine Mesenchymal stem cells

Affiliations

Loss of Stag2 cooperates with EWS-FLI1 to transform murine Mesenchymal stem cells

Marc El Beaino et al. BMC Cancer. .

Abstract

Background: Ewing sarcoma is a malignancy of primitive cells, possibly of mesenchymal origin. It is probable that genetic perturbations other than EWS-FLI1 cooperate with it to produce the tumor. Sequencing studies identified STAG2 mutations in approximately 15% of cases in humans. In the present study, we hypothesize that loss of Stag2 cooperates with EWS-FLI1 in generating sarcomas derived from murine mesenchymal stem cells (MSCs).

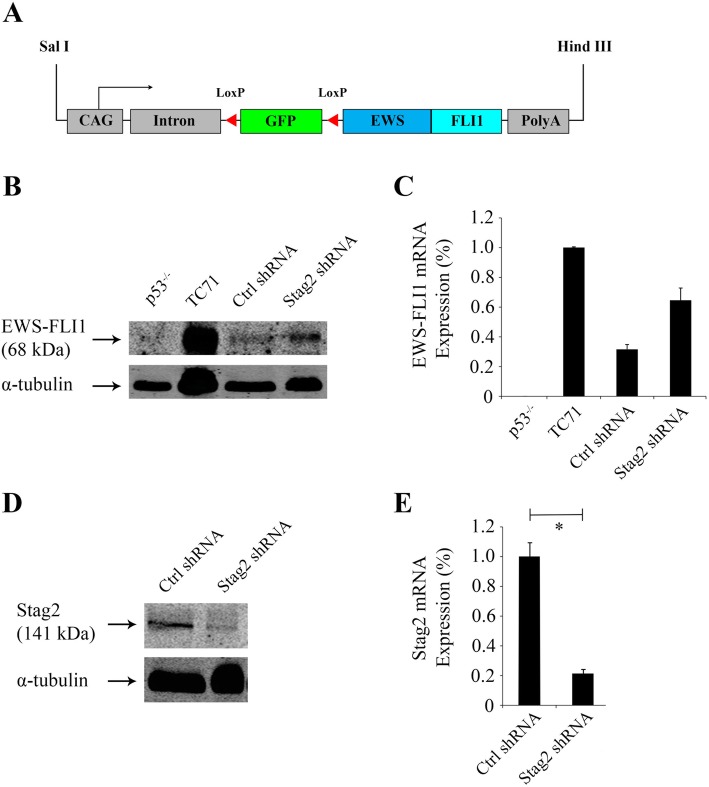
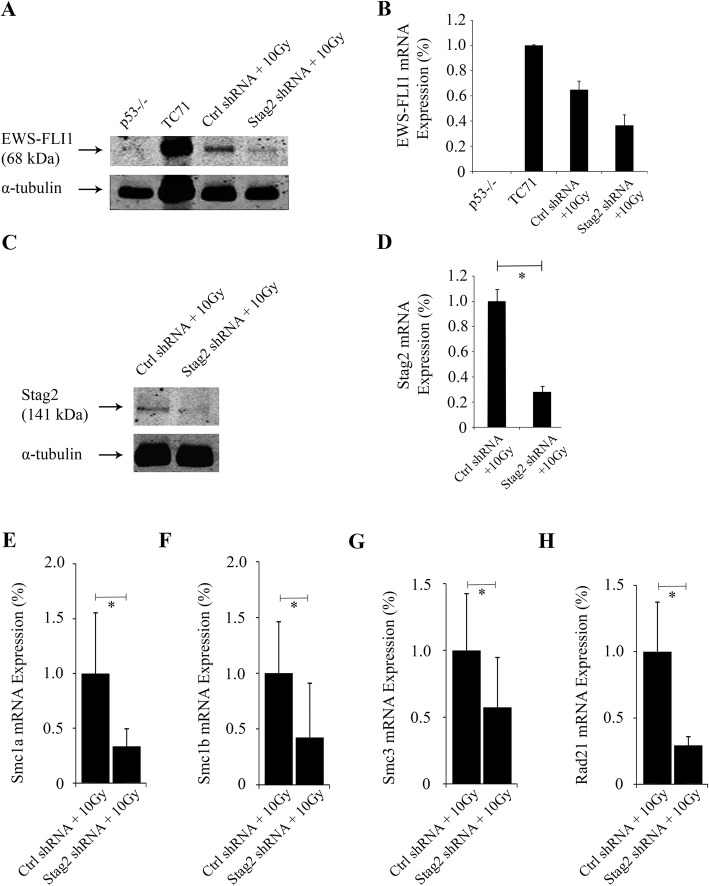
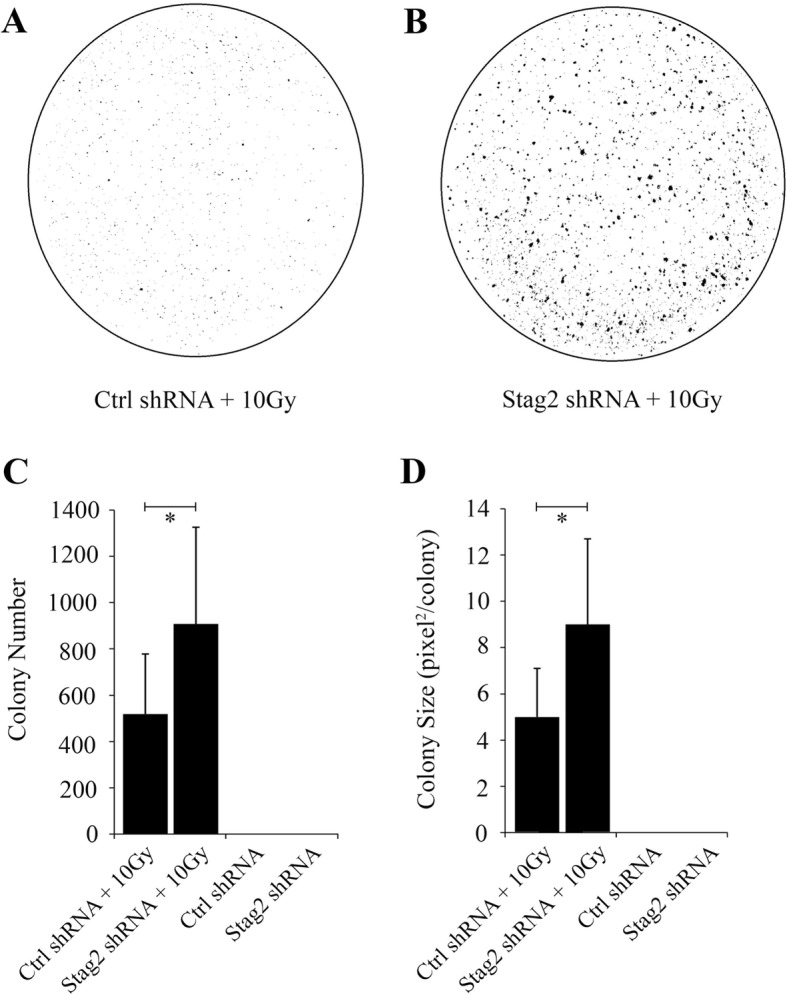
Methods: Mice bearing an inducible EWS-FLI1 transgene were crossed to p53-/- mice in pure C57/Bl6 background. MSCs were derived from the bone marrow of the mice. EWS-FLI1 induction and Stag2 knockdown were achieved in vitro by adenovirus-Cre and shRNA-bearing pGIPZ lentiviral infection, respectively. The cells were then treated with ionizing radiation to 10 Gy. Anchorage independent growth in vitro was assessed by soft agar assays. Cellular migration and invasion were evaluated by transwell assays. Cells were injected with Matrigel intramuscularly into C57/Bl6 mice to test for tumor formation.

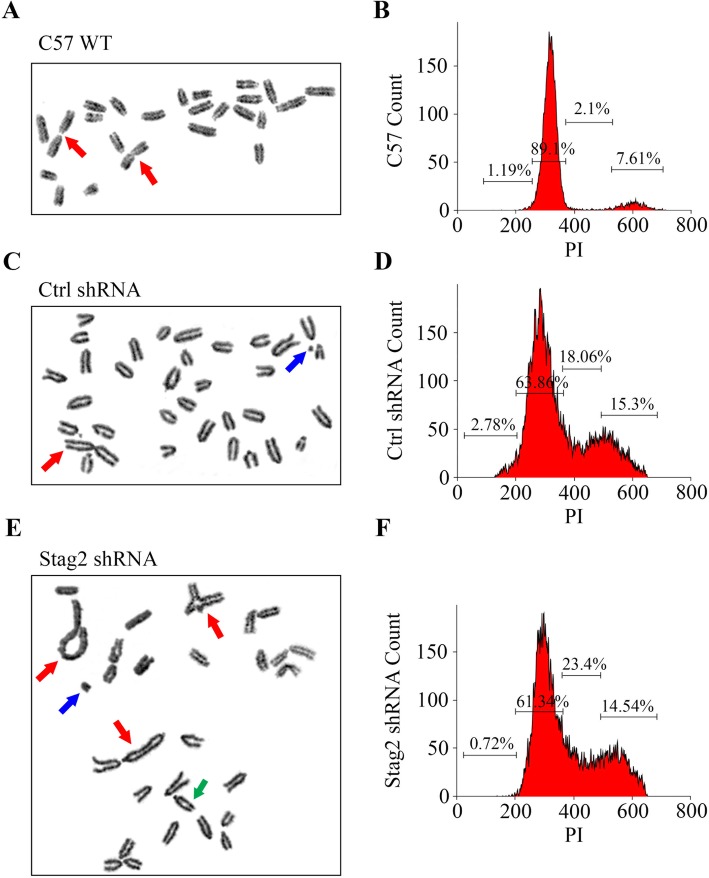
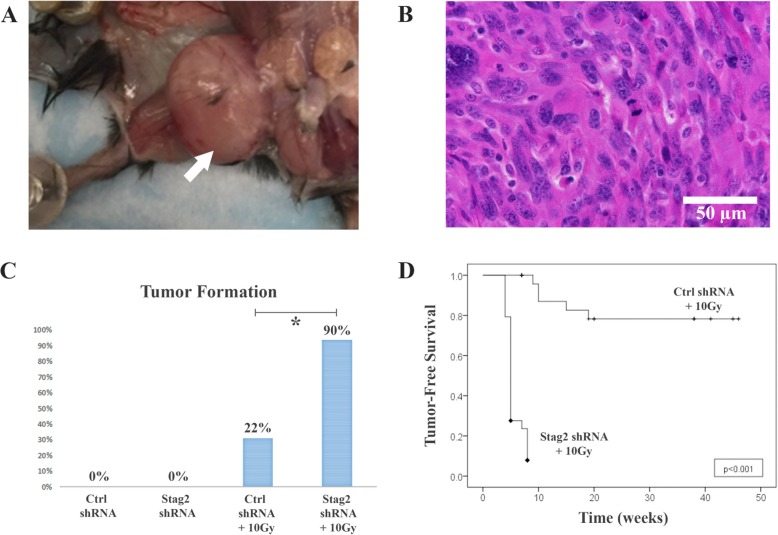
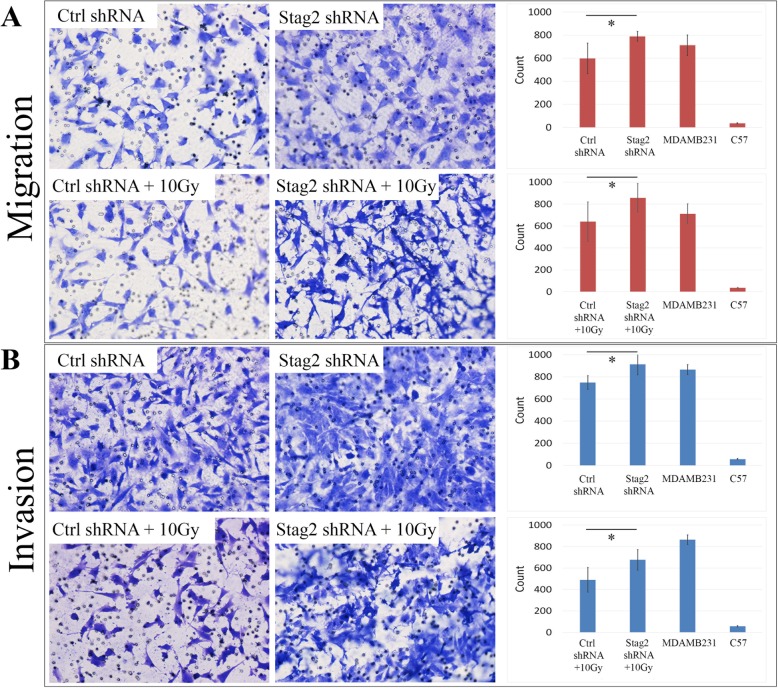
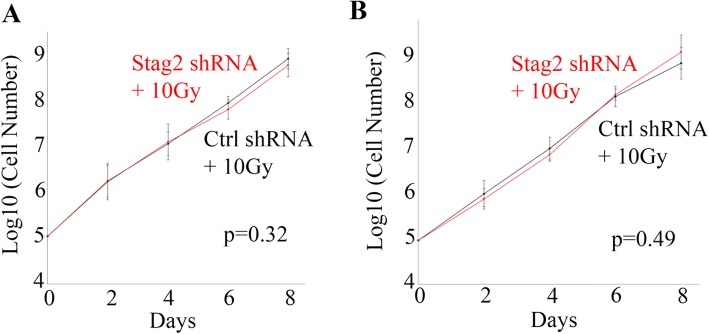
Results: Primary murine MSCs with the genotype EWS-FLI1 p53-/- were resistant to transformation and did not form tumors in syngeneic mice without irradiation. Stag2 inhibition increased the efficiency and speed of sarcoma formation significantly in irradiated EWS-FLI1 p53-/- MSCs. The efficiency of tumor formation was 91% for cells in mice injected with Stag2-repressed cells and 22% for mice receiving cells without Stag2 inhibition (p < .001). Stag2 knockdown reduced survival of mice in Kaplan-Meier analysis (p < .001). It also increased MSC migration and invasion in vitro but did not affect proliferation rate or aneuploidy.

Conclusion: Loss of Stag2 has a synergistic effect with EWS-FLI1 in the production of sarcomas from murine MSCs, but the mechanism may not relate to increased proliferation or chromosomal instability. Primary murine MSCs are resistant to transformation, and the combination of p53 null mutation, EWS-FLI1, and Stag2 inhibition does not confer immediate conversion of MSCs to sarcomas. Irradiation is necessary in this model, suggesting that perturbations of other genes beside Stag2 and p53 are likely to be essential in the development of EWS-FLI1-driven sarcomas from MSCs.

Keywords: EWS-FLI1; Ewing sarcoma; Mesenchymal stem cells; Mouse model; Stag2; p53.


Conflict of interest statement

The authors declare that they have no competing interests.

Figures

Fig. 1
Fig. 1
EWS-FLI1 expression and knockdown of Stag2 in MSCs. a Schematic diagram is shown for the EWS-FLI1 transgene. Transcription (arrow) is driven by the CAG synthetic promoter, consisting of the chick β-actin core promoter with the cytomegalovirus immediate early enhancer and rabbit β-globin splice acceptor. LoxP sites flank the green fluorescent protein (GFP) gene. b Western blot with anti-FLI1 antibody shows EWS-FLI1 expression in the Ewing sarcoma cell line TC71 carrying the Type 1 fusion (positive control) but not murine MSCs bearing the p53 null mutation alone without EWS-FLI1 (p53−/−, negative control). Positive expression of EWS-FLI1 was observed in EWS-FLI1 p53−/− MSCs after treatment with random control shRNA (“Ctrl shRNA” cells) and EWS-FLI1 p53−/− MSCs after treatment with Stag2 shRNA (“Stag2 shRNA” cells). Digital scanning of the Western blot showed that the level of protein expression of EWS-FLI1 (band intensity as a percentage of TC71) was 32% in Ctrl shRNA and 65% in Stag2 shRNA cells. c Quantitative RT-PCR, with Rplp0 as the internal reference, confirms mRNA expression of EWS-FLI1 in the same cells. d Stag2 shRNA cells show a decrease in expression of Stag2 compared to Ctrl shRNA cells on Western blot. e Quantitative RT-PCR, with Rplp0 as the internal reference, showed that Stag2 expression was reduced by 78% in Stag2 shRNA cells compared to Ctrl shRNA cells (p < .01)
Fig. 2
Fig. 2
Chromosomal abnormalities. Metaphase chromosomal spreads were prepared from MSCs with the following genotypes a pure wild-type C57/Bl6 (C57 WT) cells; c EWS-FLI1 p53−/− cells expressing random control shRNA (Ctrl shRNA cells); and e EWS-FLI1 p53−/− cells expressing Stag2 shRNA (Stag2 shRNA cells). Examination of 125 metaphase spreads showed more abnormal metaphases for Ctrl shRNA and Stag2 shRNA cells compared to C57 WT cells. Ctrl shRNA and Stag2 shRNA cells exhibited frequent non-reciprocal translocations (red arrows), chromosomal fragments (blue arrows) and chromosomal breaks (green arrows). However, there was no significant difference between Ctrl shRNA and Stag2 shRNA cells in terms of percentage of aberrant metaphases (34% vs. 34%, respectively), chromosomal breaks (18% vs. 16%, respectively), and chromosomal fusions/translocations (24% vs. 24%). b The cell cycle distribution of C57/Bl6 WT cells stained with propidium iodide (PI) showed 89.1% of cells in G0-G1, 2.1% in S, and 7.6% in G2-M phases. Cell cycle distribution of Ctrl shRNA cells d and Stag2 shRNA cells f showed a higher fraction of non-G0-G1 cells compared to the control C57 WT cells. The cell cycle distribution of Ctrl shRNA cells was not statistically different compared to Stag2 shRNA cells
Fig. 3
Fig. 3
Verification of EWS-FLI1 expression and Stag2 knockdown after irradiation of MSCs. a Western blot with anti-FLI1 antibody shows EWS-FLI1 expression in the Ewing sarcoma cell line TC71 (positive control) but not p53−/− cells without EWS-FLI1 (negative control). Both Ctrl shRNA+10Gy and Stag2 shRNA+10Gy irradiated cells showed positive EWS-FLI1 expression. Digital scanning of the Western blot showed that the level of protein expression of EWS-FLI1 (band intensity as a percentage of TC71) was 64.9% in Ctrl shRNA+10Gy and 36.5% in Stag2 shRNA+10Gy cells. b Quantitative RT-PCR, with Rplp0 as the internal reference, confirms mRNA expression of EWS-FLI1 in the same cells. c Western blot for Stag2 shows diminished expression in Stag2 shRNA+10Gy compared to Ctrl shRNA+10Gy cells. d Quantitative RT-PCR, with Rplp0 as the internal reference, showed that Stag2 expression was reduced by 63% in Stag2 shRNA+10Gy compared to Ctrl shRNA+10Gy cells (p < .01). e–h For the genes of the cohesin complex that are coordinately expressed with Stag2, the expression levels of Smc1a e, Smc1b f, Smc3 g, and Rad21 h were reduced by 66, 57, 43, and 71%, respectively, in Stag2 shRNA+10Gy cells compared to Ctrl shRNA+10Gy cells (p < .01). Values were normalized to Rplp0 expression, and the level of gene expression in Ctrl shRNA+10Gy cells was set as the reference baseline
Fig. 4
Fig. 4
Anchorage-independent growth in soft agar after Stag2 knockdown. Representative plates are shown for a Ctrl shRNA+10Gy cells and b Stag2 shRNA+10Gy cells. c The mean number of colonies per plate was 908 (95% CI 744–1072) for Stag2 shRNA+10Gy cells and 520 (95% CI 422–618) for Ctrl shRNA+10Gy cells (p < .001). d Digital image analysis to determine colony size by pixels showed a mean size of 4.6 pixels/colony (95% CI 3.9–5.4) for Ctrl shRNA+10Gy cells compared to 8.8 pixels/colony (95% CI 7.4–10.3) for shRNA+10Gy cells (p < .001). Assays were done in triplicate
Fig. 5
Fig. 5
Formation of sarcomas after injection of mice with MSCs in Matrigel carrier. a Tumor formation (arrow) in the quadriceps muscle is shown after injection of 1 × 106 Stag2 shRNA+10Gy cells (irradiated MSCs with Stag2 knockdown, EWS-FLI1 expression, and p53−/− null mutation). b Histopathology shows a pleomorphic spindle cell sarcoma with frequent mitotic figures. c The rate of tumor formation is significantly higher for Stag2 shRNA+10Gy compared to Ctrl shRNA+10Gy cells (p < .001). d Kaplan-Meier survival is significantly shorter for mice injected with Stag2 shRNA+10Gy compared to Ctrl shRNA+10Gy cells (p < .001)
Fig. 6
Fig. 6
Migration and invasion assays. Transwell migration a and invasion b assays are depicted. A graph with a quantitative analysis is shown for each pair of cells. Normal C57/Bl6 MSCs were used as negative controls, whereas the breast cancer cell line MDAMB231 was the positive control. All assays were done in triplicate. Statistical significance is marked with an asterisk “*”. a For non-irradiated cells in the migration assay, we found that the mean number of migratory cells per plate was 597 (95% CI 497–696) for Ctrl shRNA cells compared to 789 (95% CI 759–818) for Stag2 shRNA cells (p = .004). For radiated cells, mean number of migratory cells per plate was 640 (95% CI 538–742) for Ctrl shRNA+10Gy migratory cells per plate compared to 857 (95% CI 785–929) for Stag2 shRNA+10Gy cells (p = .002). b For non-irradiated cells in the invasion assay, the mean number of invasive cells per plate was 749 (95% CI 704–794) for Ctrl shRNA compared to 914 (95% CI 831–996) for Stag2 shRNA cells (p = .006). For the radiated cells, the mean number of invasive cells per plate was 542 (95% CI 4907–594) for Ctrl shRNA+10Gy compared to 676 (95% CI 601–751) for Stag2 shRNA+10Gy cells (p = .008)
Fig. 7
Fig. 7
Proliferation rate in cell culture. Comparison of anchorage-dependent growth on plastic plates did not show a significant difference in growth rate between a Ctrl shRNA and Stag2 shRNA cells; and b Ctrl shRNA+10Gy and Stag2 shRNA+10Gy cells

References

    1. Cotterill SJ, Ahrens S, Paulussen M, Jurgens HF, Voute PA, Gadner H, Craft AW. Prognostic factors in Ewing’s tumor of bone: analysis of 975 patients from the European intergroup cooperative Ewing’s sarcoma study group. J Clin Oncol. 2000;18(17):3108–3114. doi: 10.1200/JCO.2000.18.17.3108. - DOI - PubMed
    1. Rodriguez-Galindo C, Liu T, Krasin MJ, Wu J, Billups CA, Daw NC, Spunt SL, Rao BN, Santana VM, Navid F. Analysis of prognostic factors in Ewing sarcoma family of tumors: review of St. Jude Children’s Research Hospital studies. Cancer. 2007;110(2):375–384. doi: 10.1002/cncr.22821. - DOI - PubMed
    1. Turc-Carel C, Philip I, Berger MP, Philip T, Lenoir GM. Chromosome study of Ewing’s sarcoma (ES) cell lines. Consistency of a reciprocal translocation t (11;22)(q24;q12) Cancer Genet Cytogenet. 1984;12(1):1–19. doi: 10.1016/0165-4608(84)90002-5. - DOI - PubMed
    1. Delattre O, Zucman J, Plougastel B, Desmaze C, Melot T, Peter M, Kovar H, Joubert I, de Jong P, Rouleau G, et al. Gene fusion with an ETS DNA-binding domain caused by chromosome translocation in human tumours. Nature. 1992;359(6391):162–165. doi: 10.1038/359162a0. - DOI - PubMed
    1. Chaturvedi A, Hoffman LM, Welm AL, Lessnick SL, Beckerle MC. The EWS/FLI oncogene drives changes in cellular morphology, adhesion, and migration in Ewing sarcoma. Genes Cancer. 2012;3(2):102–116. doi: 10.1177/1947601912457024. - DOI - PMC - PubMed

MeSH terms