

Water-fat separation in spiral magnetic resonance fingerprinting for high temporal resolution tissue relaxation time quantification in muscle
- PMID: 31898834
- PMCID: PMC7217066
- DOI: 10.1002/mrm.28143
Water-fat separation in spiral magnetic resonance fingerprinting for high temporal resolution tissue relaxation time quantification in muscle
Abstract
Purpose: To minimize the known biases introduced by fat in rapid T1 and T2 quantification in muscle using a single-run magnetic resonance fingerprinting (MRF) water-fat separation sequence.
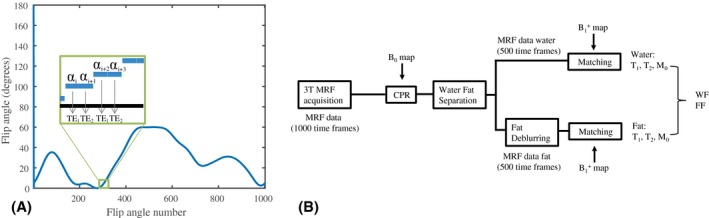
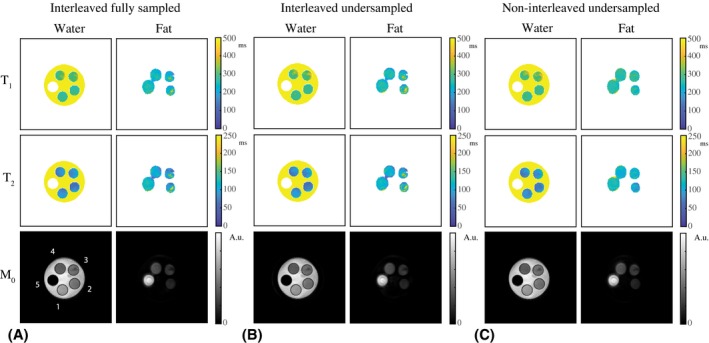
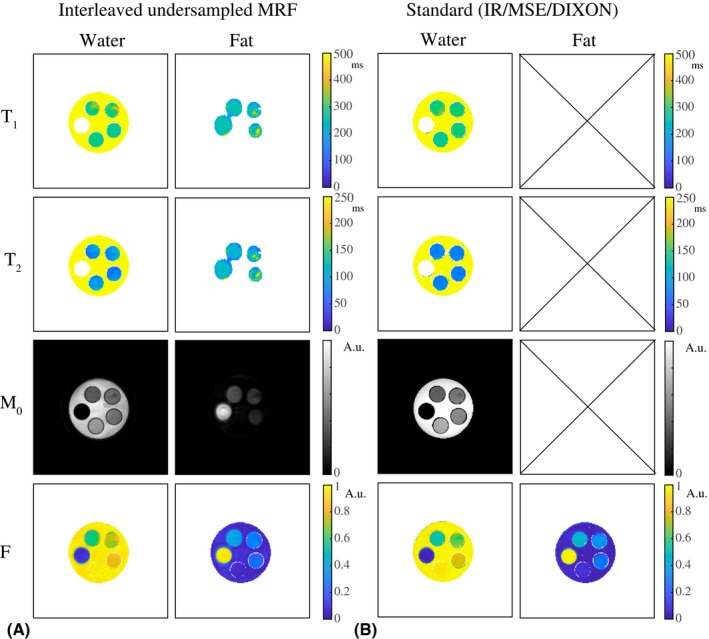
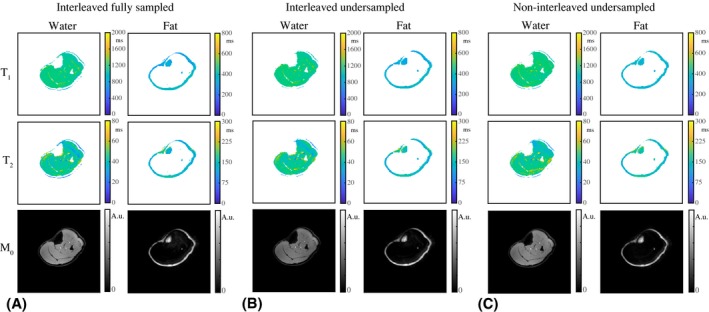
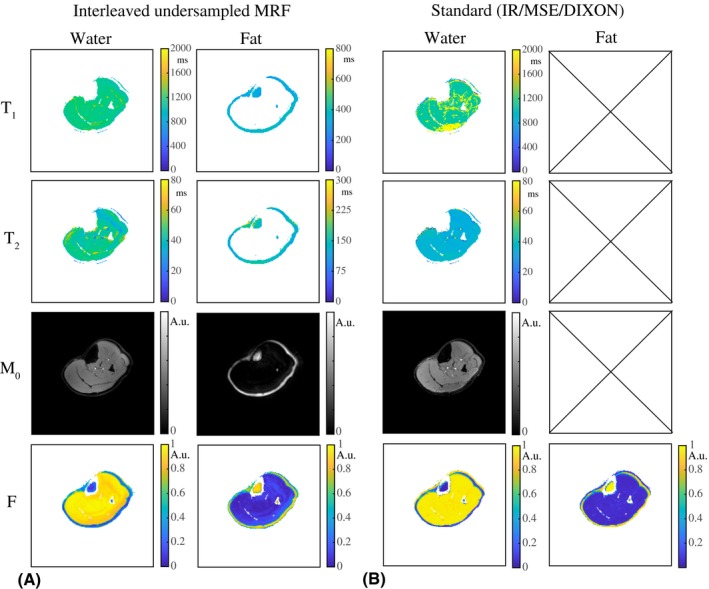
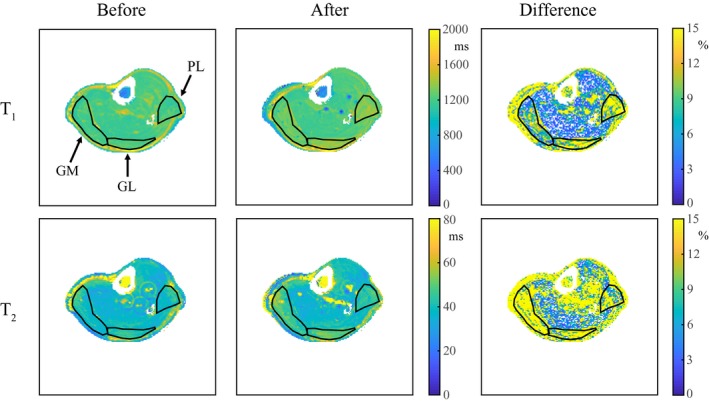
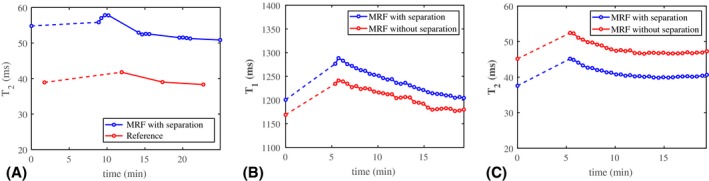
Methods: The single-run MRF acquisition uses an alternating in-phase/out-of-phase TE pattern to achieve water-fat separation based on a 2-point DIXON method. Conjugate phase reconstruction and fat deblurring were applied to correct for B0 inhomogeneities and chemical shift blurring. Water and fat signals were matched to the on-resonance MRF dictionary. The method was first tested in a multicompartment phantom. To test whether the approach is capable of measuring small in vivo dynamic changes in relaxation times, experiments were run in 9 healthy volunteers; parameter values were compared with and without water-fat separation during muscle recovery after plantar flexion exercise.
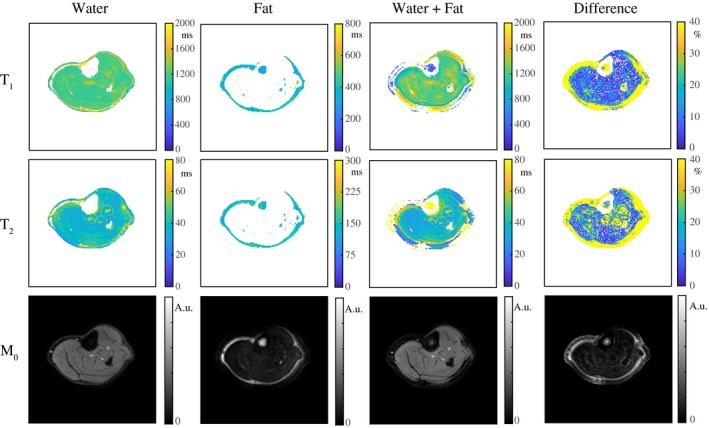
Results: Phantom results show the robustness of the water-fat resolving MRF approach to undersampling. Parameter maps in volunteers show a significant (P < .01) increase in T1 (105 ± 94 ms) and decrease in T2 (14 ± 6 ms) when using water-fat-separated MRF, suggesting improved parameter quantification by reducing the well-known biases introduced by fat. Exercise results showed smooth T1 and T2 recovery curves.
Conclusion: Water-fat separation using conjugate phase reconstruction is possible within a single-run MRF scan. This technique can be used to rapidly map relaxation times in studies requiring dynamic scanning, in which the presence of fat is problematic.
Keywords: conjugate phase reconstruction; exercise; fat; magnetic resonance fingerprinting; muscle; spiral.
© 2020 The Authors. Magnetic Resonance in Medicine published by Wiley Periodicals, Inc. on behalf of International Society for Magnetic Resonance in Medicine.
Figures
Similar articles
-
Spiral blurring correction with water-fat separation for magnetic resonance fingerprinting in the breast.Magn Reson Med. 2020 Apr;83(4):1192-1207. doi: 10.1002/mrm.27994. Epub 2019 Oct 21. Magn Reson Med. 2020. PMID: 31631385
-
Magnetic resonance fingerprinting with dictionary-based fat and water separation (DBFW MRF): A multi-component approach.Magn Reson Med. 2019 May;81(5):3032-3045. doi: 10.1002/mrm.27628. Epub 2018 Dec 21. Magn Reson Med. 2019. PMID: 30578569 Free PMC article.
-
MR fingerprinting with simultaneous T1, T2, and fat signal fraction estimation with integrated B0 correction reduces bias in water T1 and T2 estimates.Magn Reson Imaging. 2019 Jul;60:7-19. doi: 10.1016/j.mri.2019.03.017. Epub 2019 Mar 23. Magn Reson Imaging. 2019. PMID: 30910696 Free PMC article.
-
Cardiac Magnetic Resonance Fingerprinting: Technical Developments and Initial Clinical Validation.Curr Cardiol Rep. 2019 Jul 27;21(9):91. doi: 10.1007/s11886-019-1181-1. Curr Cardiol Rep. 2019. PMID: 31352620 Free PMC article. Review.
-
Magnetic Resonance Fingerprinting of the Pediatric Brain.Magn Reson Imaging Clin N Am. 2021 Nov;29(4):605-616. doi: 10.1016/j.mric.2021.06.010. Magn Reson Imaging Clin N Am. 2021. PMID: 34717848 Free PMC article. Review.
Cited by
-
Cardiac MRF using rosette trajectories for simultaneous myocardial T1, T2, and proton density fat fraction mapping.Front Cardiovasc Med. 2022 Sep 20;9:977603. doi: 10.3389/fcvm.2022.977603. eCollection 2022. Front Cardiovasc Med. 2022. PMID: 36204572 Free PMC article.
-
Feasibility of joint mapping of triglyceride saturation and water longitudinal relaxation in a single breath hold applied to high fat-fraction adipose depots in the periclavicular anatomy.Magn Reson Imaging. 2023 Jun;99:58-66. doi: 10.1016/j.mri.2023.02.001. Epub 2023 Feb 9. Magn Reson Imaging. 2023. PMID: 36764629 Free PMC article.
-
Reducing SAR in 7T brain fMRI by circumventing fat suppression while removing the lipid signal through a parallel acquisition approach.Sci Rep. 2021 Jul 28;11(1):15371. doi: 10.1038/s41598-021-94692-6. Sci Rep. 2021. PMID: 34321529 Free PMC article.
-
Multicomponent MR fingerprinting reconstruction using joint-sparsity and low-rank constraints.Magn Reson Med. 2023 Jan;89(1):286-298. doi: 10.1002/mrm.29442. Epub 2022 Sep 19. Magn Reson Med. 2023. PMID: 36121015 Free PMC article.
-
Feasibility study of 2D Dixon-Magnetic Resonance Fingerprinting (MRF) of breast cancer.Eur J Radiol Open. 2022 Nov 16;9:100453. doi: 10.1016/j.ejro.2022.100453. eCollection 2022. Eur J Radiol Open. 2022. PMID: 36411785 Free PMC article.
References
-
- Strijkers GJ, Araujo ECA, Azzabou N, et al. Exploration of new contrasts, targets, and MR imaging and spectroscopy techniques for neuromuscular disease—a workshop report of working group 3 of the biomedicine and molecular biosciences COST action BM1304 MYO‐MRI. J Neuromuscul Dis. 2019;6:1–30. - PMC - PubMed
-
- Yoshioka H, Anno I, Kuramoto K, et al. Acute effects of exercise on muscle MRI in peripheral arterial occlusive disease. Magn Reson Imaging. 1995;13:651–659. - PubMed
-
- Mitomo S, Hata M, Ogawa D, et al. Sequential changes in activity of hip abductors seen on muscle functional magnetic resonance imaging after hip abduction exercises. Bone Muscle. 2018;1:1–4.
-
- Mendiguchia J, Arcos AL, Garrues MA, et al. The use of MRI to evaluate posterior thigh muscle activity and damage during Nordic hamstring exercise. J Strength Cond Res. 2013;27:3426–3435. - PubMed
Publication types
MeSH terms
Substances
LinkOut - more resources
Full Text Sources
Miscellaneous
