

The Effects of Policy-Driven Air Quality Improvements on Children's Respiratory Health
- PMID: 31898879
- PMCID: PMC7266378
The Effects of Policy-Driven Air Quality Improvements on Children's Respiratory Health
Abstract
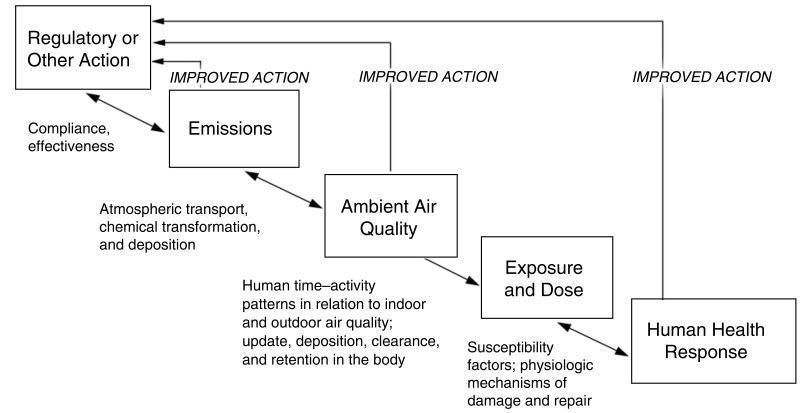
Introduction: Ambient air pollution causes substantial morbidity and mortality in the United States and worldwide. To reduce this burden of adverse health effects, a broad array of strategies to reduce ambient air pollution has been developed and applied over past decades to achieve substantial reductions in ambient air pollution levels. This has been especially true in California, where the improvement of air quality has been a major focus for more than 50 years. Direct links between regulatory policies, changes in ambient pollutant concentrations, and improvements in public health have not been extensively documented. Data from the Children's Health Study (CHS), a multiyear study of children's respiratory health development, offered a unique opportunity to evaluate the effects of long-term reductions in air pollution on children's health.
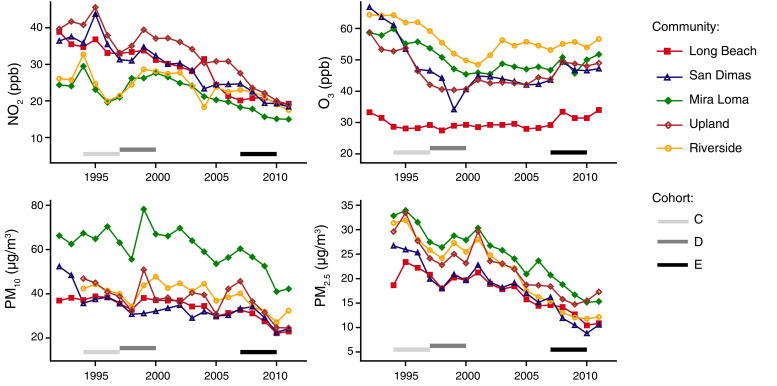
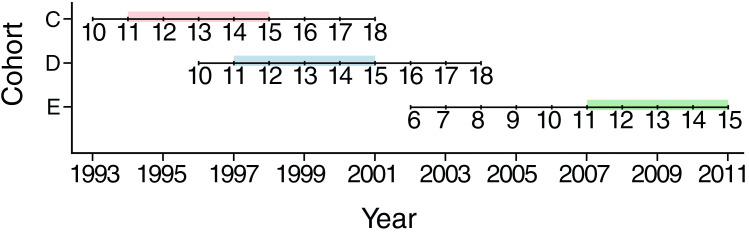
Methods: We assessed whether changes in ambient air quality and emissions were reflected in three important indices of children's respiratory health: lung-function growth, lung-function level, and bronchitic symptoms. To make the best use of available data, these analyses were performed across the longest chronological period and largest CHS population available for the respective lung-function or bronchitic symptoms data sets. During field study operations over the course of the CHS, children's health status was documented annually by testing lung-function performance and the completion of standardized questionnaires covering a broad range of respiratory symptoms. Air quality data for the periods of interest were obtained from community monitoring stations, which operated in collaboration with regional air monitoring networks over the 20-year study time frame. Over the 20-year sampling period, common protocols were applied to collect data across the three cohorts of children. Each cohort's data set was assessed to investigate the relationship between temporal changes in lung-function development, prevalence of bronchitic symptoms, and ambient air pollution concentrations during a similar, vulnerable adolescent growth period (age 11 to 15 years). Analyses were performed separately for particulate matter ≤10 µm in aerodynamic diameter (PM₁₀), particulate matter ≤2.5 µm in aerodynamic diameter (PM₂.₅), ozone (O₃), and nitrogen dioxide (NO₂). Emissions data and regulatory policies were collected from the staff of state and regional regulatory agencies, modeling estimates, and archived reports.
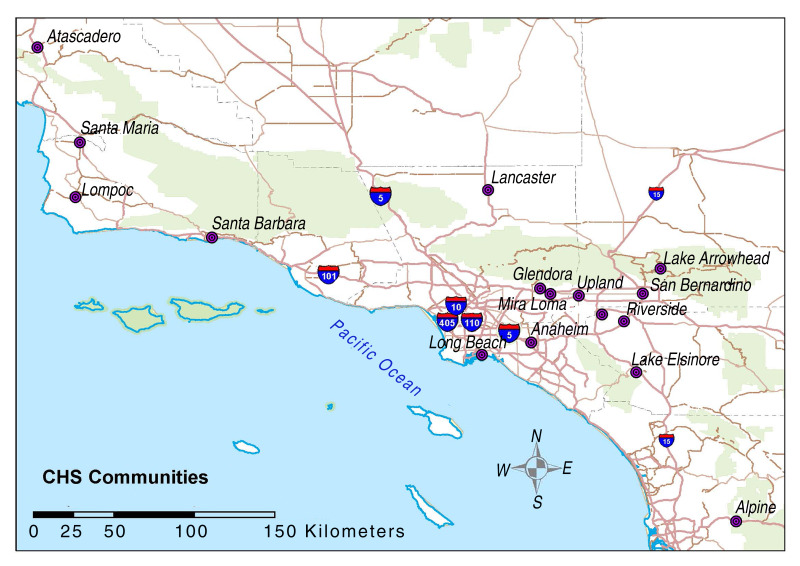
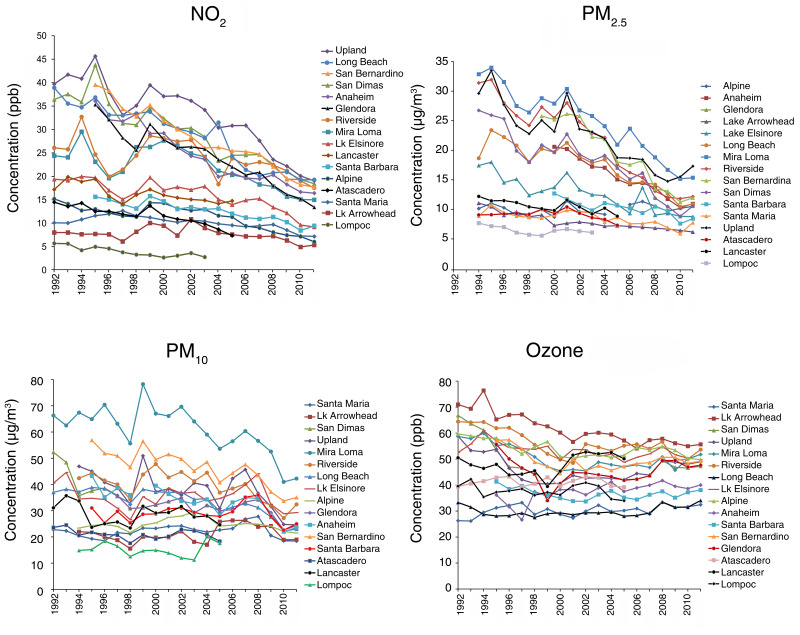
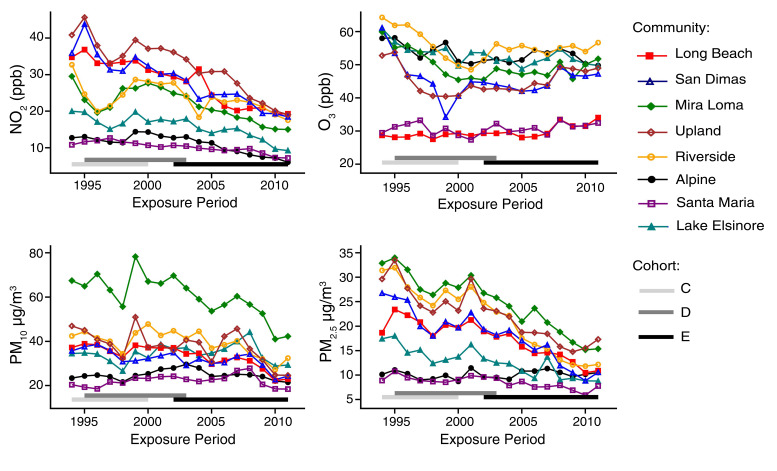
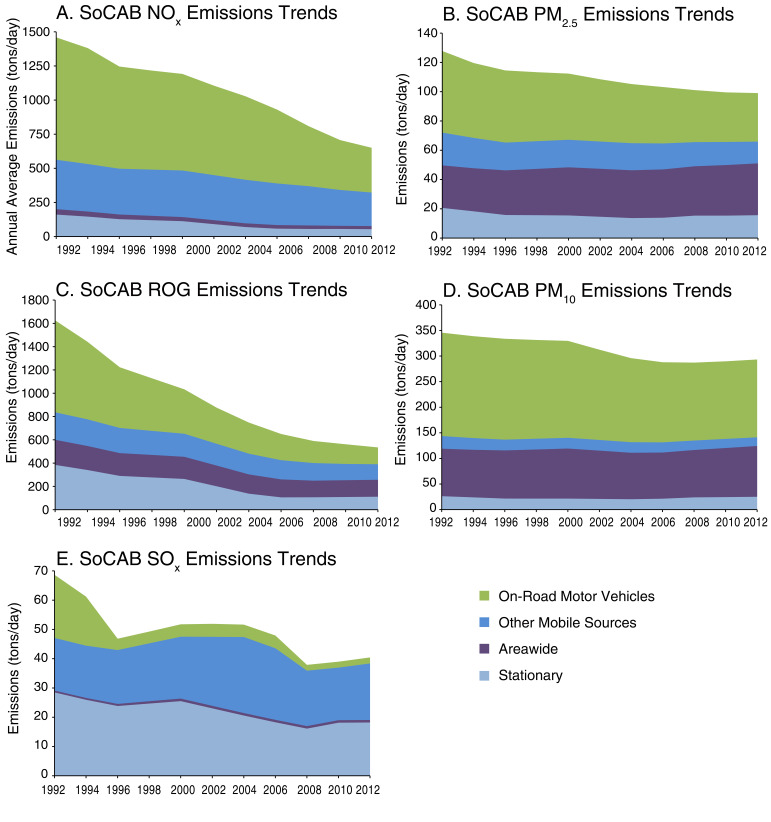
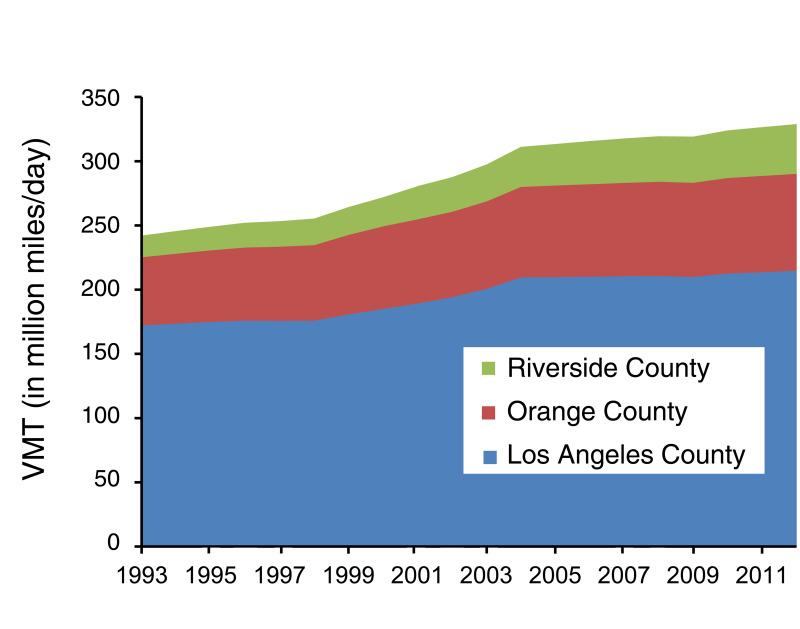
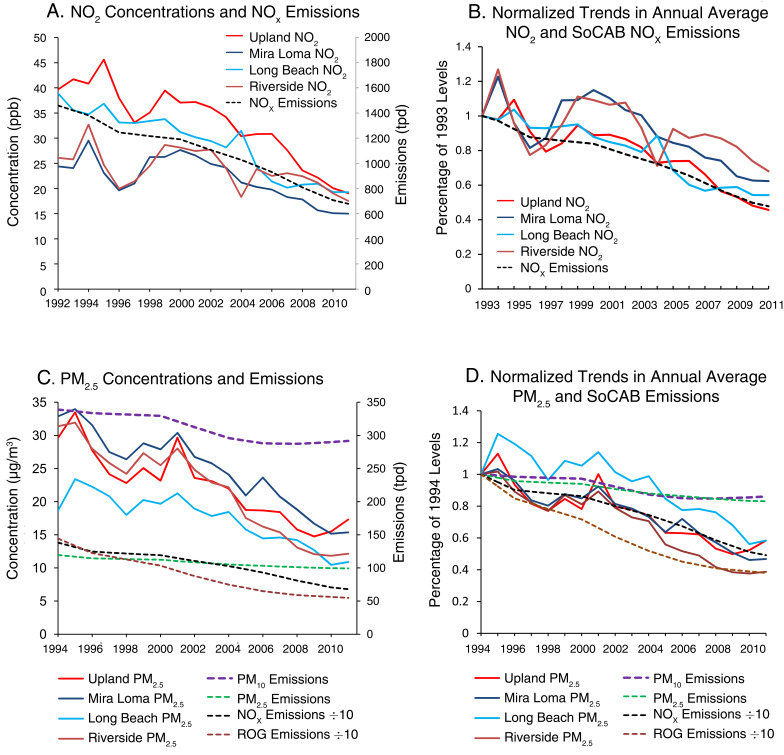
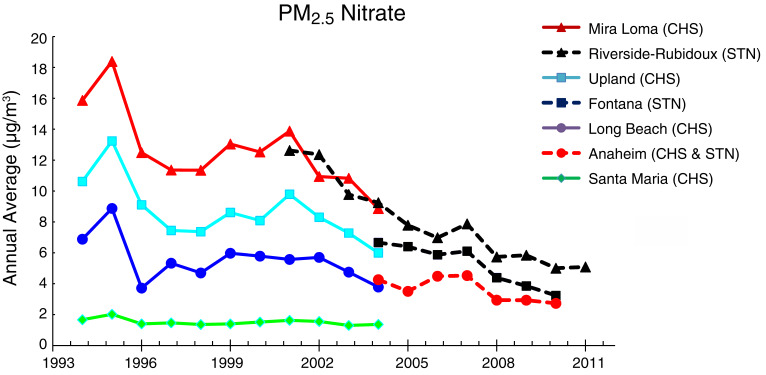
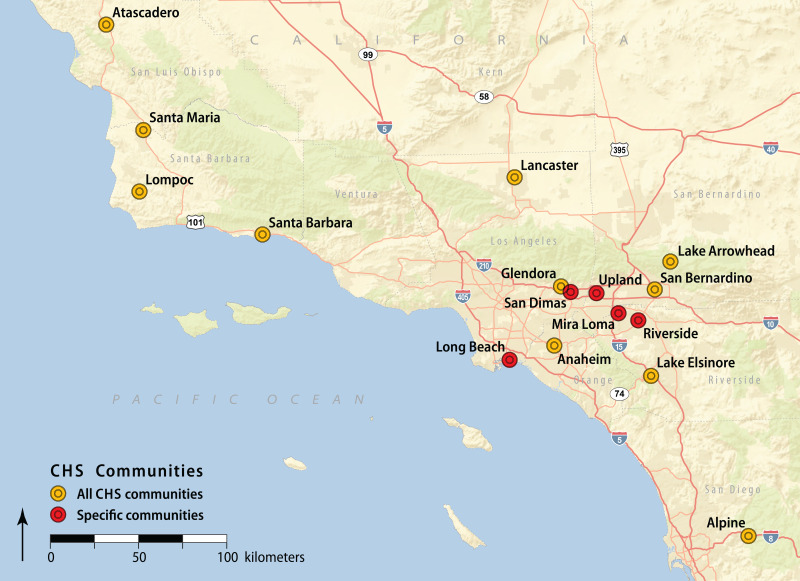
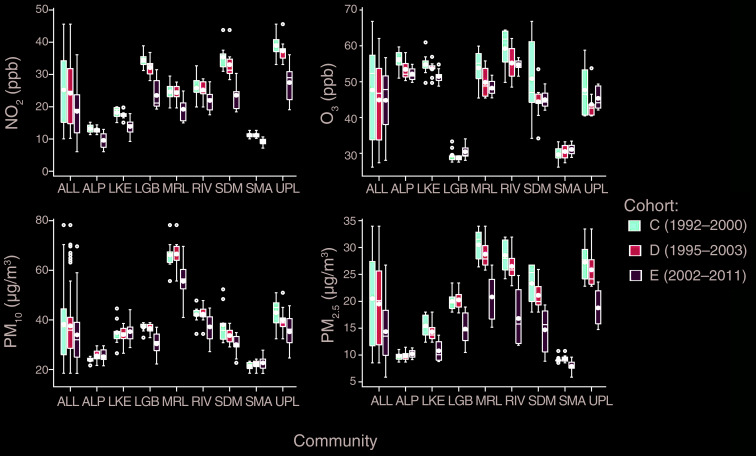
Results: Emissions in the regions of California studied during the 20-year period decreased by 54% for oxides of nitrogen (NOₓ), 65% for reactive organic gases (ROG), 21% for PM₂.₅, and 15% for PM₁₀. These reductions occurred despite a concurrent 22% increase in population and a 38% increase in motor vehicle miles driven during that time frame. Air quality improved over the same time frame, with reductions in NO₂ and PM₂.₅ in virtually all of the CHS communities. Annual average NO₂ decreased by about 53% (from ~41 to 19 ppb) in the highest NO₂-reporting community (Upland) and by about 28% (from ~10 to 7 ppb) in one of the lowest NO₂-reporting communities (Santa Maria). Reductions in annual average PM₂.₅ concentrations ranged from 54% (~33 to 15 µg/m³) in the community with the highest concentration (Mira Loma) to 13% (~9 to 8 µg/m³) in a community with one of the lowest concentrations (Santa Maria). Improvements in PM₁₀ and O₃ (measured during eight daytime hours, 10 AM to 6 PM) were most evident in the CHS communities that initially had the highest levels of PM and O₃. Trends in annual average NO₂, PM₂.₅, and PM₁₀ ambient air concentrations in the communities with higher-pollution levels were generally consistent with observed trends in NOₓ, ROG, PM₂.₅, and PM₁₀ emissions.
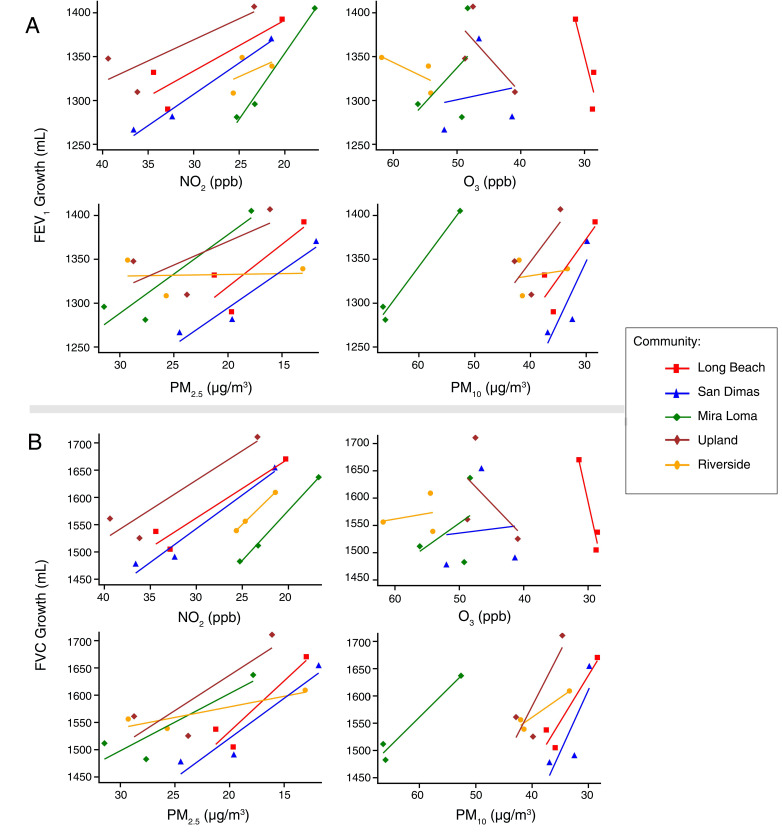
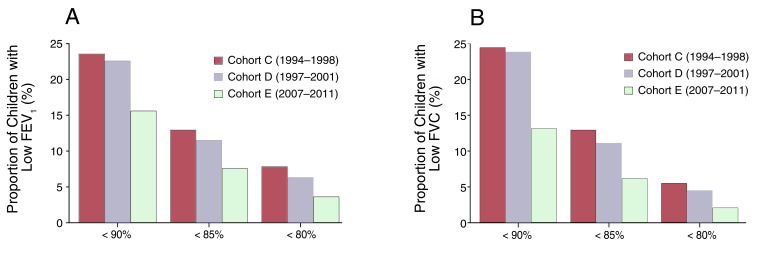
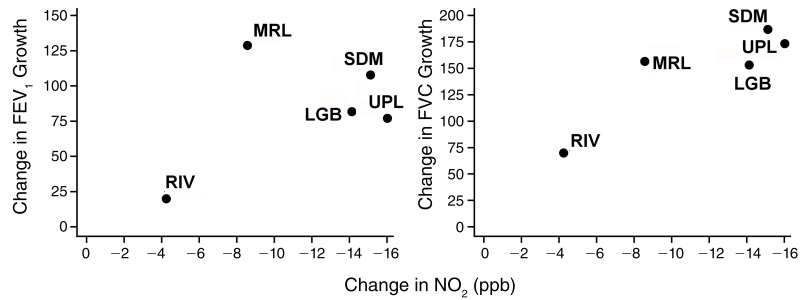
Significant improvements in lung-function growth in progressive cohorts were observed as air quality improved over the study period. Improvements in four-year growth of both forced expiratory volume in the first second of exhalation (FEV1) and forced vital capacity (FVC) were associated with declining levels of NO₂ (P < 0.0001), PM₂.₅ (P < 0.01), and PM₁₀ (P < 0.001). These associations persisted after adjustment for important potential confounders. Further, significant improvements in lung-function growth were observed in both boys and girls and among asthmatic and non-asthmatic children. Within-community decreases in O₃ exposure were not significantly associated with lung-function growth. The proportion of children with clinically low FEV1 (defined as <80% predicted) at age 15 declined significantly, from 7.9% to 3.6% across the study periods, respectively, as the air quality improved (P < 0.005). We found little evidence to suggest that improvements in lung-function development were attributable to temporal confounding.
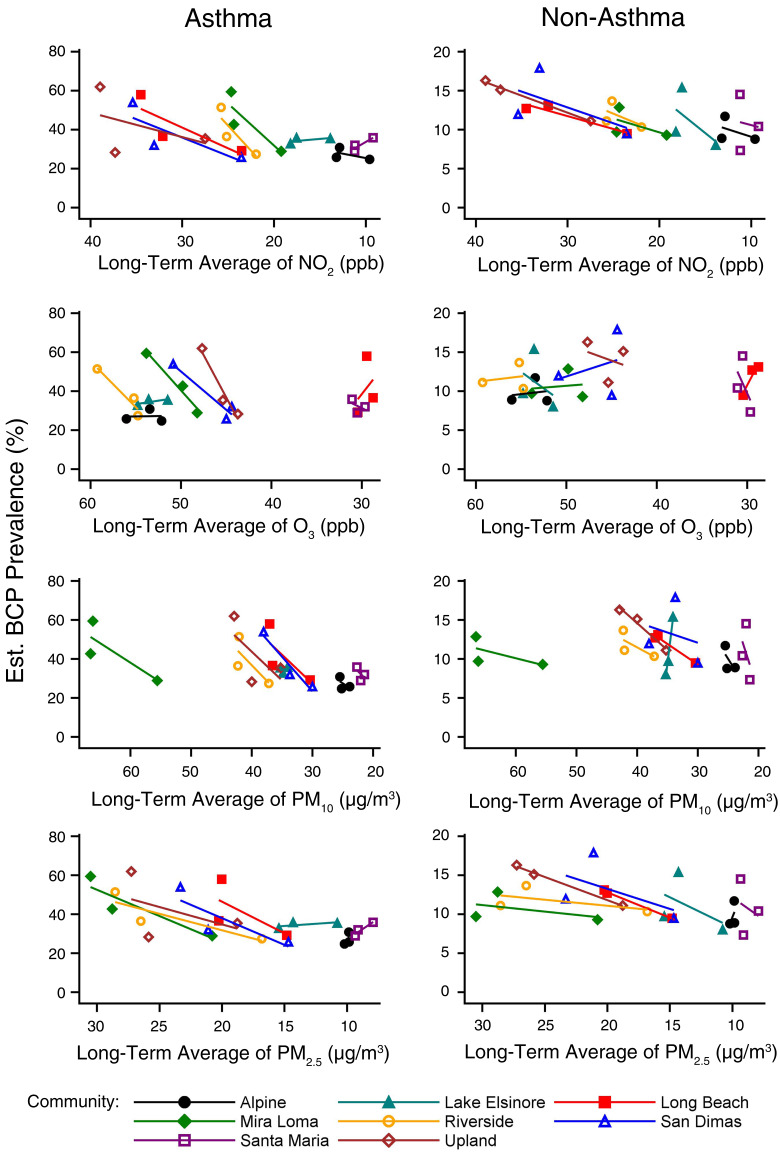
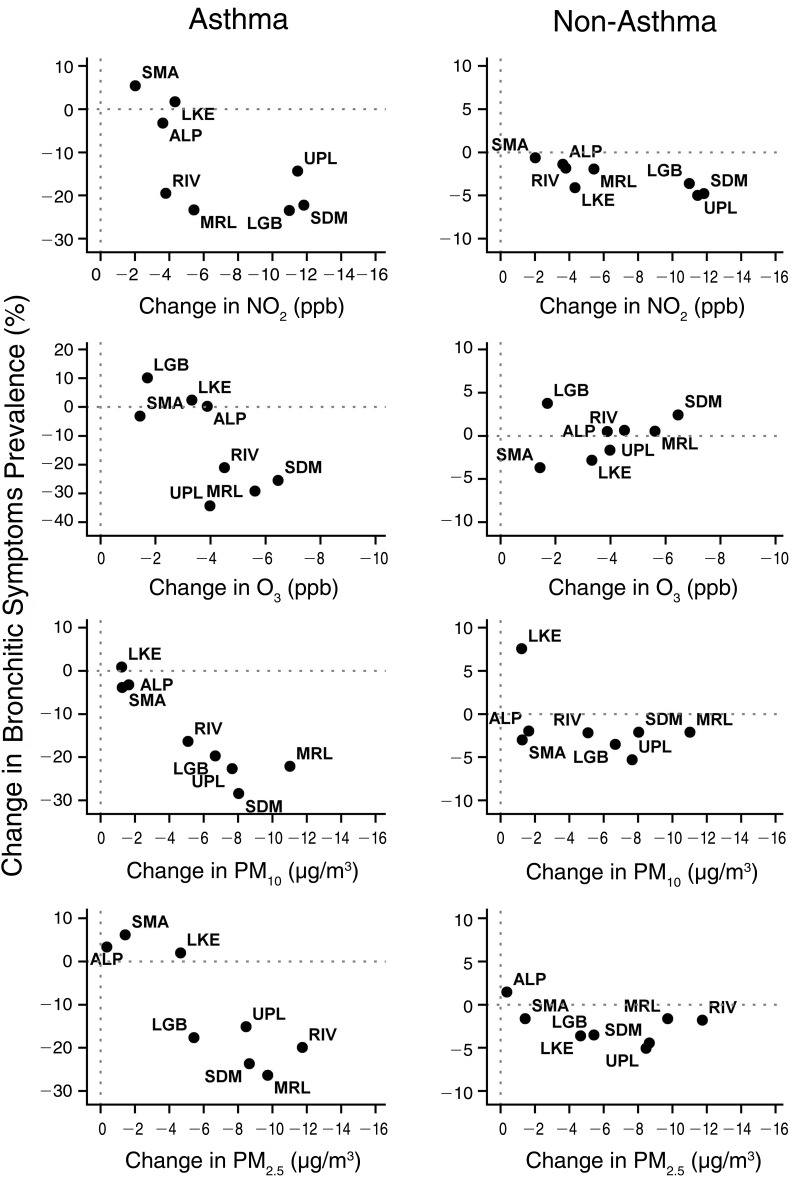
Reductions in outdoor levels of NO₂, O₃, PM₁₀, and PM₂.₅ across the cohort years of participation were associated with significant reductions in the prevalence of bronchitic symptoms regardless of asthma status, but observed improvements were larger in children with asthma. Among asthmatic children, the reductions in prevalence of bronchitic symptoms at age 10 were 21% (P < 0.01) for NO₂, 34% (P < 0.01) for O₃, 39% (P < 0.01) for PM₁₀, and 32% (P < 0.01) for PM₂.₅ for reductions of 4.9 ppb, 3.6 ppb, 5.8 µg/m³, and 6.8 µg/m³, respectively. Similar reductions in prevalence of bronchitic symptoms were observed at age 15 among these same asthmatic children. As in the lung-function analyses, we found little evidence that temporal confounding accounted for the observed associations of symptoms reduction with air quality improvement.
The large number and breadth of regulatory activities, as well as the prolonged phase-in periods of several policy approaches to reduce emissions, precluded the close temporal linkage of specific policies with specific changes in health status. However, the combination of policies addressing motor vehicle emissions - from on-board diagnostics to emission controls, from low-sulfur fuels to vehicle smog-check recertification, and from re-formulated gasoline to the various strategies contained within the San Pedro Bay Ports Clean Air Plan (especially the Clean Truck Program) - all contributed to an impressive and substantial reduction in emissions. These reductions collectively improved local and regional air quality, and improvements in local and regional air quality were associated with improvements in respiratory health.
Conclusions: This study provides evidence that multiyear improvements in air quality and emissions, primarily driven through a broad array of science-based regulatory policy initiatives, have resulted in improved public health outcomes. Our study demonstrates that improvements in air quality, brought about by science-based regulatory actions, are associated with improved respiratory health in children. These respiratory health metrics include reductions in respiratory symptoms and improvements in lung-function development in a population widely accepted to be at risk and highly vulnerable to the effects of air pollution. Our research findings underscore the importance of sustained air regulatory efforts as an effective means of achieving improved respiratory health in communities and regions affected by airborne pollution.
© 2020 Health Effects Institute. All rights reserved.
Figures


Similar articles
-
Impacts of Regulations on Air Quality and Emergency Department Visits in the Atlanta Metropolitan Area, 1999-2013.Res Rep Health Eff Inst. 2018 Apr;2018(195):1-93. Res Rep Health Eff Inst. 2018. PMID: 31883240 Free PMC article.
-
Mortality and Morbidity Effects of Long-Term Exposure to Low-Level PM2.5, BC, NO2, and O3: An Analysis of European Cohorts in the ELAPSE Project.Res Rep Health Eff Inst. 2021 Sep;2021(208):1-127. Res Rep Health Eff Inst. 2021. PMID: 36106702 Free PMC article.
-
Effects of short-term exposure to air pollution on hospital admissions of young children for acute lower respiratory infections in Ho Chi Minh City, Vietnam.Res Rep Health Eff Inst. 2012 Jun;(169):5-72; discussion 73-83. Res Rep Health Eff Inst. 2012. PMID: 22849236
-
The 2023 Latin America report of the Lancet Countdown on health and climate change: the imperative for health-centred climate-resilient development.Lancet Reg Health Am. 2024 Apr 23;33:100746. doi: 10.1016/j.lana.2024.100746. eCollection 2024 May. Lancet Reg Health Am. 2024. PMID: 38800647 Free PMC article. Review.
-
The Minderoo-Monaco Commission on Plastics and Human Health.Ann Glob Health. 2023 Mar 21;89(1):23. doi: 10.5334/aogh.4056. eCollection 2023. Ann Glob Health. 2023. PMID: 36969097 Free PMC article. Review.
Cited by
-
Impact of Reductions in Emissions from Major Source Sectors on Fine Particulate Matter-Related Cardiovascular Mortality.Environ Health Perspect. 2020 Jan;128(1):17005. doi: 10.1289/EHP5692. Epub 2020 Jan 7. Environ Health Perspect. 2020. PMID: 31909652 Free PMC article.
-
Association between AXL promoter methylation and lung function growth during adolescence.Epigenetics. 2018;13(10-11):1027-1038. doi: 10.1080/15592294.2018.1529517. Epub 2018 Oct 19. Epigenetics. 2018. PMID: 30277126 Free PMC article.
-
Improvements in Air Quality and Health Outcomes Among California Medicaid Enrollees Due to Goods Movement Actions.Res Rep Health Eff Inst. 2021 May;2021(205):1-61. Res Rep Health Eff Inst. 2021. PMID: 35869754 Free PMC article.
-
Use of Tracer Elements for Estimating Community Exposure to Marcellus Shale Development Operations.Int J Environ Res Public Health. 2020 Mar 12;17(6):1837. doi: 10.3390/ijerph17061837. Int J Environ Res Public Health. 2020. PMID: 32178331 Free PMC article.
-
Impacts of Vehicle Emission Regulations and Local Congestion Policies on Birth Outcomes Associated with Traffic Air Pollution.Res Rep Health Eff Inst. 2025 Feb;2025(223):1-88. Res Rep Health Eff Inst. 2025. PMID: 40191931 Free PMC article.
References
-
- Atmospheric and Environmental Research, Inc. (San Ramon, CA). HEI Air Quality Database. Available: https://hei.aer.Com [accessed 11 May 2016].
-
- Chay KY, Greenstone M. 2003. The impact of air pollution on infant mortality: evidence from geographic variation in pollution shocks induced by a recession. Q J Econ 11 8:11 21–1167.
-
- Clancy L, Goodman P, Sinclair H, Dockery DW. 2002. Effect of air-pollution control on death rates in Dublin, Ireland: an intervention study. Lancet 360:1210–1214. - PubMed
Publication types
LinkOut - more resources
Full Text Sources
Research Materials
Miscellaneous