. 2020 Mar 4;105(5):822-836.e7.
doi: 10.1016/j.neuron.2019.12.004. Epub 2019 Dec 30.

Glucocerebrosidase Activity Modulates Neuronal Susceptibility to Pathological α-Synuclein Insult

Affiliations

Glucocerebrosidase Activity Modulates Neuronal Susceptibility to Pathological α-Synuclein Insult

Michael X Henderson et al. Neuron. .

Abstract

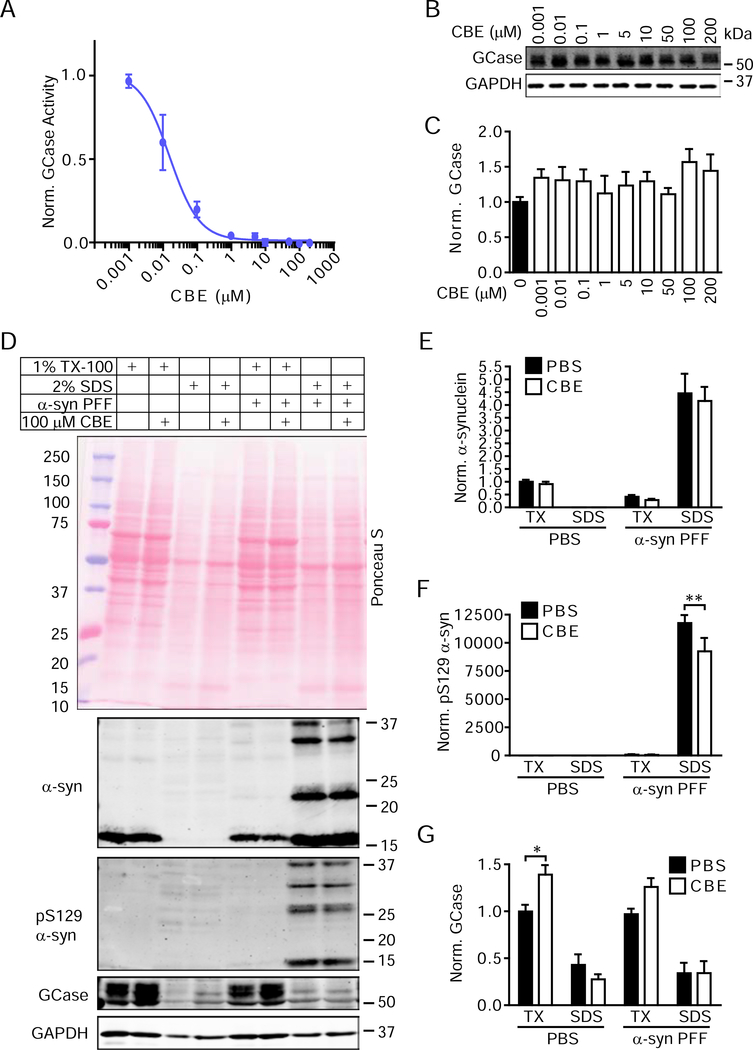
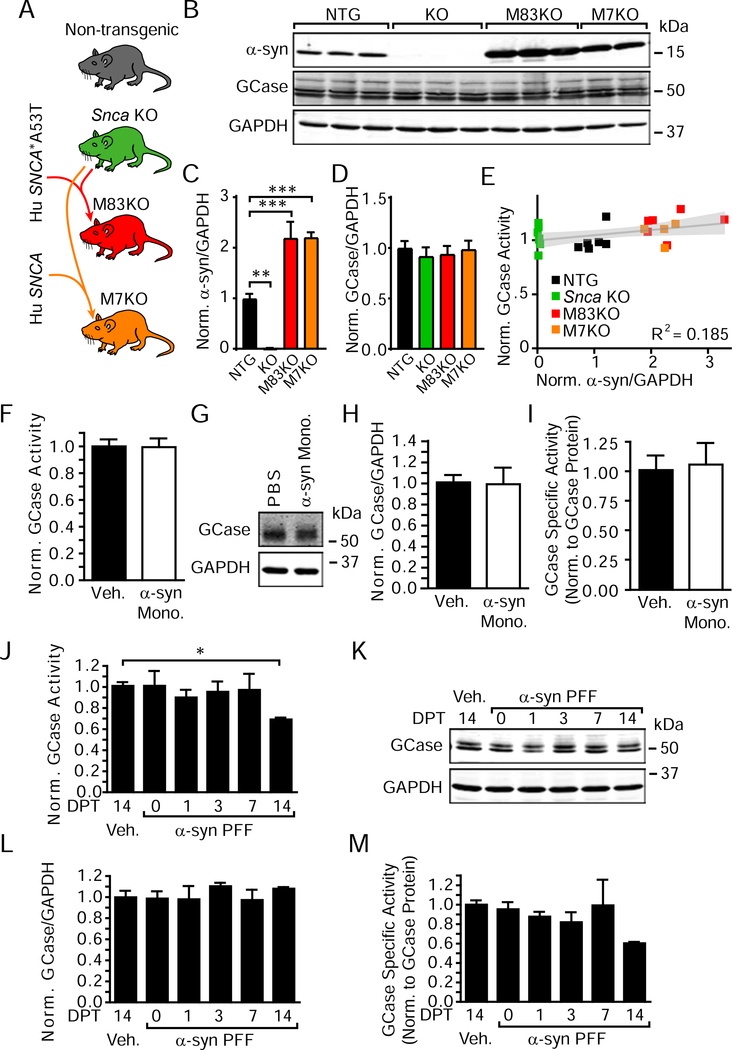
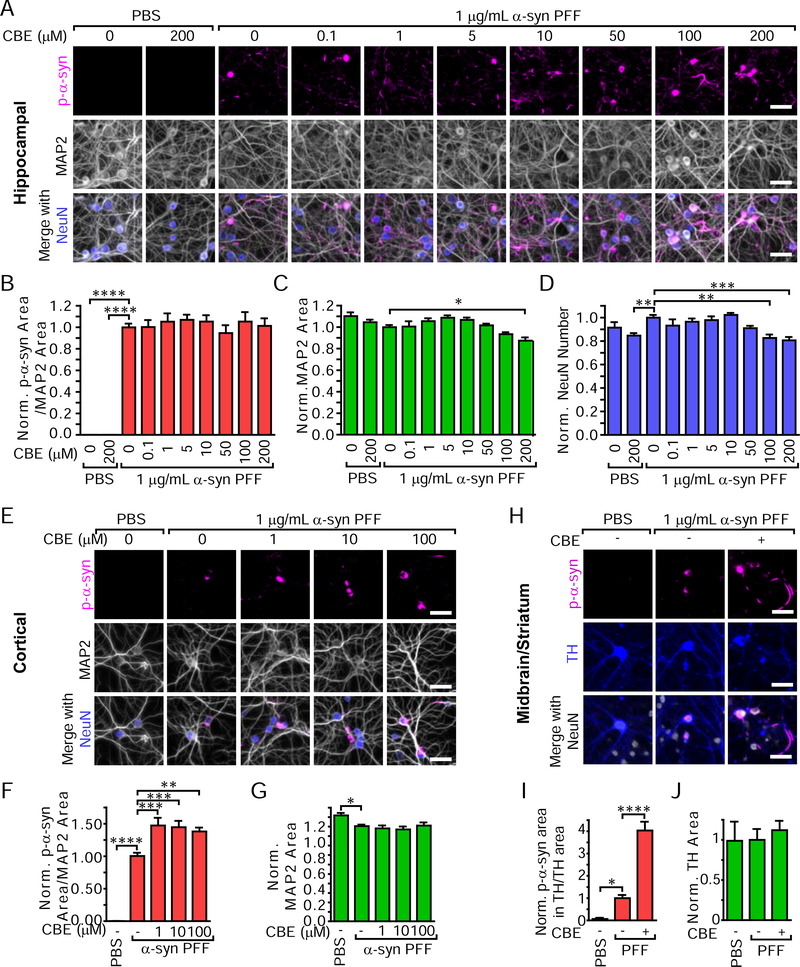
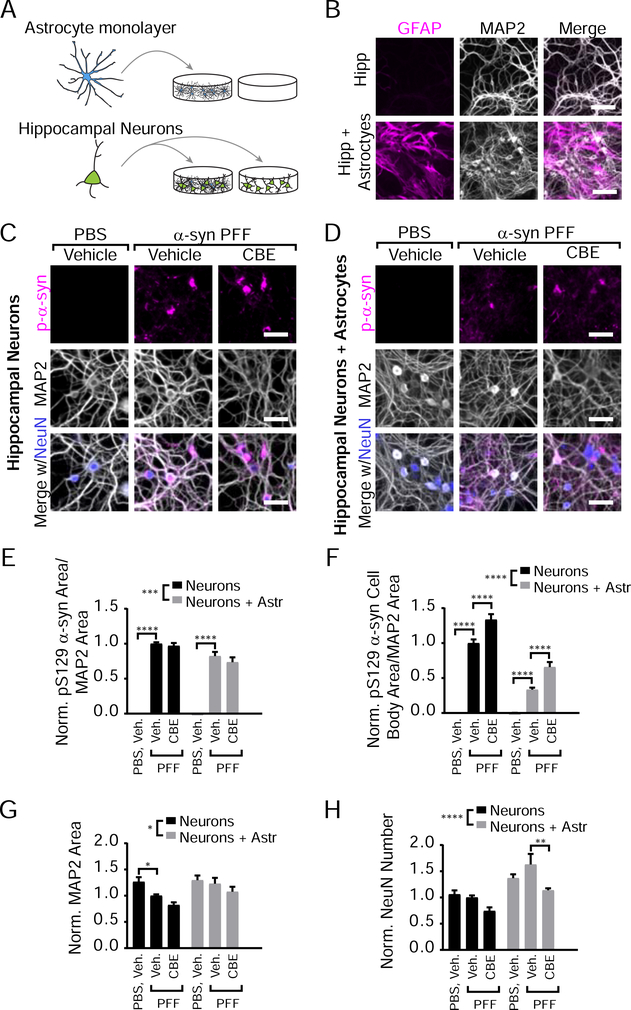
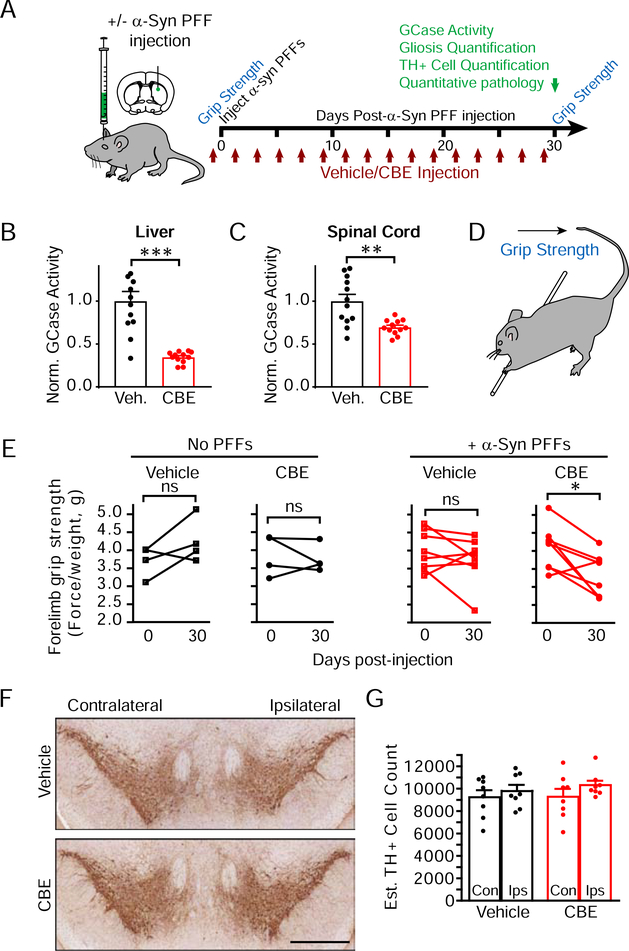
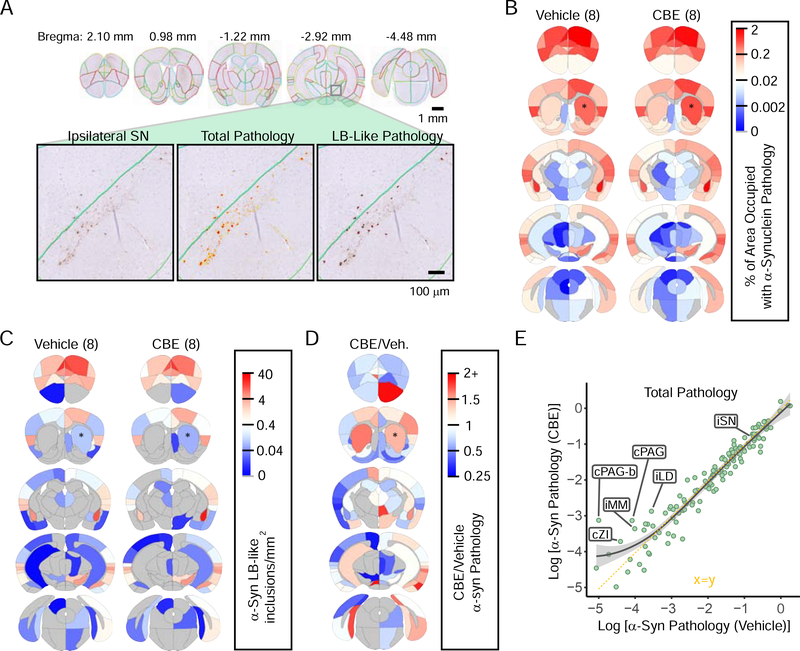
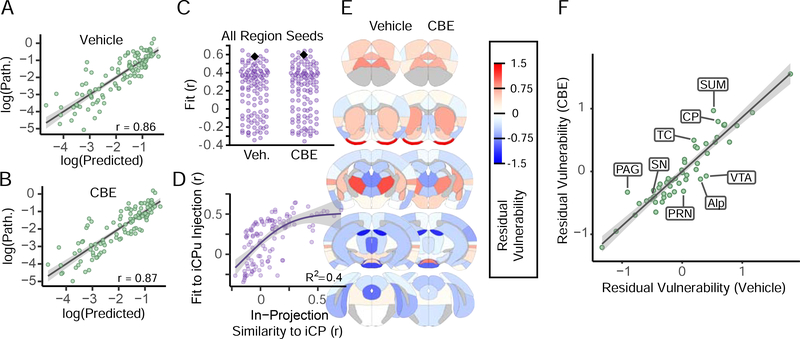
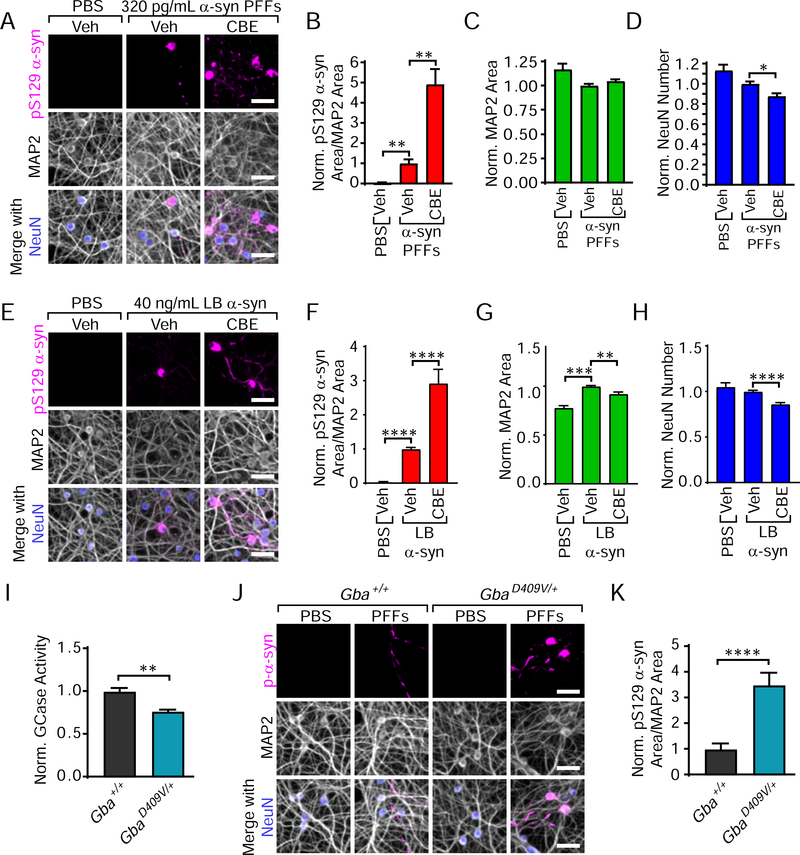
Mutations in the GBA1 gene are the most common genetic risk factor for Parkinson's disease (PD) and dementia with Lewy bodies (DLB). GBA1 encodes the lysosomal lipid hydrolase glucocerebrosidase (GCase), and its activity has been linked to accumulation of α-synuclein. The current study systematically examines the relationship between GCase activity and both pathogenic and non-pathogenic forms of α-synuclein in primary hippocampal, cortical, and midbrain neuron and astrocyte cultures, as well as in transgenic mice and a non-transgenic mouse model of PD. We find that reduced GCase activity does not result in aggregation of α-synuclein. However, in the context of extant misfolded α-synuclein, GCase activity modulates neuronal susceptibility to pathology. Furthermore, this modulation does not depend on neuron type but rather is driven by the level of pathological α-synuclein seeds. This study has implications for understanding how GBA1 mutations influence PD pathogenesis and provides a platform for testing novel therapeutics.

Keywords: D409V; GBA1; GCase; Lewy body; Parkinson’s disease; glucosylceramide; glucosylsphingosine; network model; neurodegenerative disease; transmission.


Conflict of interest statement

Declaration of Interests The authors declare no competing interests.

Figures

Figure 1.
Figure 1.. GCase Inhibition Does Not Induce De Novo α-Synuclein Accumulation in Primary Neurons
(A) Primary hippocampal neurons treated with CBE were lysed to determine GCase activity at 21 DIV. The plotted line is a non-linear fit of values with an estimated IC50 of 15.8 nM (n=3/group). (B) Parallel samples were assayed for total GCase and GAPDH protein levels. (C) Quantification of GCase levels with CBE treatment compared to vehicle treatment (one-way ANOVA with Dunnett’s multiple comparison test, n=3/group). (D) Primary hippocampal neurons treated with vehicle or CBE and either DPBS or 2.5 μg/mL α-synuclein PFFs were extracted with sequentially stronger detergents to allow the separation of soluble proteins from insoluble pathological proteins. Quantification of α-synuclein (E), pS129 α-synuclein (F) and GCase (G) normalized to GAPDH levels as a loading control and then to TX-100-soluble PBS-treated values confirms this observation. All sequential extraction values were compared by two-way ANOVA followed by Sidak’s multiple comparison tests. (G)**p=0.0022, (H)*p=0.0167, n=4–5/group. Data are represented as mean ± SEM.
Figure 2.
Figure 2.. GCase Activity Does Not Correlate with Total α-Synuclein Load but Can Be Reduced by Pathogenic α-Synuclein
(A) Schematic of mouse lines used for this study. (B) Immunoblotting of brain lysates from the four described mouse lines. (C) Quantification of α-synuclein protein level shows that Snca KO mice lack α-synuclein (**p=0.0012), and M83KO (***p=0.0003) and M7KO (***p=0.0008) mice have approximately two-fold the expression of wildtype mice (one-way ANOVA, Dunnett’s multiple comparison tests, n=4–7/group). (D) Quantification of GCase protein levels (all non-significant by one-way ANOVA, Dunnett’s multiple comparison tests, n=4–7/group). (E) Normalized α-synuclein protein levels (x-axis) were compared to normalized GCase activity (y-axis) for individual mice (gray line represents a linear regression best-fit line with the 95% confidence interval in light gray, slope=0.0414, p=0.0405, R2 = 0.185, n=23). (F) Primary hippocampal neurons treated with 2.5 μg/mL α-synuclein monomer at 7 DIV and lysate was harvested 14 days post-treatment (DPT). GCase activity was unchanged, as were GCase protein levels (G), (H), and GCase specific activity (I) (all non-significant by unpaired t-tests, n=3/group). In contrast, 2.5 μg/mL α-synuclein PFF treatment of neuron cultures for the same time period resulted in a time-dependent reduction in GCase activity (J), no change in protein levels (K), (L) and therefore a reduction in GCase specific activity (M). One-way ANOVA with Dunnett’s multiple comparison tests, (I)*p=0.0317, all other p>0.05, n=3/group. Data are represented as mean ± SEM, except where individual values are plotted in panel (E).
Figure 3.
Figure 3.. GCase Inhibition Differentially Modulates α-Synuclein Pathology in Primary Hippocampal, Cortical and Midbrain Neurons
(A) Primary hippocampal neurons treated with CBE with or without the addition of 1 μg/mL α-synuclein PFFs for 14 days and stained for pathological pS129 α-synuclein (magenta), MAP2 (gray) and NeuN (gray). (B) Quantification of pS129 α-synuclein area/MAP2 area (one-way ANOVA with Dunnett’s multiple comparison tests comparing all conditions to α-synuclein PFF without CBE condition, PBS-0 μM CBE ****p<0.0001, PBS-200 μM CBE ****p<0.0001, all others p>0.05, n=15–18/group). (C) MAP2 area quantification (one-way ANOVA with Dunnett’s multiple comparison tests comparing all conditions to α-synuclein PFFs without CBE condition, PFF-200 μM CBE *p=0.0134, all others p>0.05, n=15–18/group). (D) NeuN number quantification (one-way ANOVA with Dunnett’s multiple comparison tests comparing all conditions to α-synuclein PFF without CBE condition, PBS-200 μM CBE **p=0.0055, PFF-100 μM CBE **p=0.0011, PFF-200 μM CBE ***p=0.0002, all others p>0.05, n=15–18/group). (E) Primary cortical neurons treated with CBE and 1 μg/mL α-synuclein PFFs and stained in the same manner as hippocampal neurons in panel (A). (F) Quantification of pS129 α-synuclein area/MAP2 area (one-way ANOVA with Dunnett’s multiple comparison tests comparing all conditions to α-synuclein PFF without CBE condition, PBS-0 μM CBE ****p<0.0001, PFF-1 μM CBE ***p=0.0002, PFF-10 μM CBE ***p=0.0005, PFF-100 μM CBE **p=0.0031, n=17–18/group). (G) MAP2 area quantification (one-way ANOVA with Dunnett’s multiple comparison tests comparing all conditions to α-synuclein PFF without CBE condition, PBS-0 μM CBE *p=0.0180, all others p>0.05, n=17–18/group). (H) Primary midbrain and striatal neurons were treated with 100 μM CBE and 1 μg/mL α-synuclein PFFs in the same manner as the hippocampal and cortical neurons, but were stained for TH (gray) to reveal dopaminergic neurons. (I) Quantification of pS129 α-synuclein area co-localized with TH/TH area (one-way ANOVA with Dunnett’s multiple comparison tests comparing all conditions to α-synuclein PFFs without CBE condition, PBS-0 μM CBE *p=0.0295, PFF-CBE ****p<0.0001, n=6/group). (J) Total TH area quantification (one-way ANOVA with Dunnett’s multiple comparison tests comparing all conditions to α-synuclein PFFs without CBE condition, all p>0.05, n=6/group). Scale bars = 50 μm. Data are represented as mean ± SEM.
Figure 4.
Figure 4.. Astrocyte Co-Culture Reduces α-Synuclein Pathology in Hippocampal Neurons but Does Not Alter the Effect of GCase Inhibition
(A) Schematic of astrocyte co-culture experiments. (B) Primary hippocampal neurons cultured in the presence or absence of an astrocyte monolayer were stained for GFAP (astrocytic marker, magenta) and MAP2 (gray). (C) Primary hippocampal neuron cultures treated with vehicle or 100 μM CBE in addition to PBS or 1 μg/mL α-synuclein PFFs stained for pS129 α-synuclein (magenta), MAP2 (gray) and NeuN (gray) to allow quantification of pathology and neuronal toxicity. (D) The same batches of hippocampal neurons as in panel (C) were cultured on top of an astrocyte monolayer and stained as in panel (C). (E) Quantification of pathological pS129 α-synuclein area/MAP2 area (two-way ANOVA (Neuron versus neurons with astrocytes ***p=0.0001) with Dunnett’s multiple comparisons test comparing within culture to Vehicle-PFF: Hippocampal: Vehicle-PBS ****p<0.0001, CBE-PFF p=0.8245; Hipp+Astrocytes: Vehicle-PBS ****p<0.0001, CBE-PFF p=0.2399, n=11–12). (F) Quantification of pathological cell body pS129 α-synuclein area/MAP2 area reveals an overall effect of astrocyte co-culture and of CBE (two-way ANOVA (Neuron versus neurons with astrocytes ****p<0.0001) with Dunnett’s multiple comparisons test comparing within culture to Vehicle-PFF: Hippocampal: Vehicle-PBS ****p<0.0001, CBE-PFF ****p<0.0001; Hipp + Astrocytes: Vehicle-PBS ****p<0.0001, CBE-PFF ****p<0.0001, n=11–12). (G) Quantification of MAP2 area (two-way ANOVA (Neuron versus neurons with astrocytes *p=0.0119) with Dunnett’s multiple comparisons test comparing within culture to Vehicle-PFF: Hippocampal: Vehicle-PBS *p=0.0368, all others p>0.05, n=11–12). (H) Quantification NeuN number (two-way ANOVA (Neuron versus neurons with astrocytes ***p=0.0001) with Dunnett’s multiple comparisons test comparing within culture to Vehicle-PFF: Hippocampal: All p>0.05; Hipp + Astrocytes: Vehicle-PBS p=0.1195, CBE-PFF p=0.0016, n=11–12). Scale bars = 100 μm (B), 50 μm (C,D). Data are represented as mean ± SEM.
Figure 5.
Figure 5.. GCase Inhibition and α-Synuclein Injection Cause Combinatorial Motor Weakness in the Absence of Dopaminergic Neuron Loss
(A) Schematic of in vivo experiments testing the effect of GCase inhibition and/or α-synuclein PFF injection on motor dysfunction, neuropathology and neuron death. Mice in vehicle or CBE cohorts were further divided into cohorts injected in the dorsal striatum with α-synuclein PFFs or not injected and assayed for grip strength. (B) GCase activity in the liver was reduced with CBE treatment (unpaired t test, p=0.0001, n=12/group). (C) GCase activity was also reduced in the spinal cord following CBE treatment (unpaired t-test, p=0.0030, n=12/group). (D) Schematic for how the grip strength assay was performed. (E) Quantification of grip strength (normalized to mouse weight). Initial grip strength is compared to grip strength after 30 days by a paired t-test for each group of mice. Mice with both α-synuclein PFF and CBE injections have a significant reduction in grip strength (*p=0.0131, n=4=8/group). (F) Ventral midbrain image of mice treated with vehicle or CBE and stained with TH to reveal monoaminergic neurons (scale bar = 0.5 mm). (G) Quantification of TH-positive neurons within the substantia nigra in mice injected with α-synuclein PFFs (two-way ANOVA followed by Sidak’s multiple comparison test, All p>0.05, n=8/group).
Figure 6.
Figure 6.. GCase Inhibition Minimally Alters In Vivo Spread of α-Synuclein Pathology
(A) α-Synuclein pathology was quantified in 132 regions throughout the brains of mice injected with DPBS (n=8) or CBE (n=8) in addition to α-synuclein PFFs. The 132 annotated regions are displayed here overlaid on mouse brain sections. Below, a zoomed image of the substantia nigra (left) with a total pathology mask (middle) or LB-like pathology mask (right). (B) A quantitative mean heat map of the percentage of area occupied with α-synuclein pathology in each region of DPBS and CBE groups of mice. Warm colors represent high pathology and cool colors represent low pathology as designated in the scale bar on the right. (C) A quantitative mean heat map of the number of LB-like α-synuclein inclusions/mm2 in each region of DPBS and CBE groups of mice. (D) The relative difference between CBE-injected and DPBS-injected mice is displayed here as CBE/DPBS α-synuclein pathology with warm colors indicating regions that have higher pathology in the CBE group and with cool colors indicating regions with that have lower pathology in the CBE group, relative to DPBS group. (E) The Log [% area occupied with α-synuclein pathology] for the DPBS group (x-axis) vs. the CBE group (y-axis) is plotted here with the smoothed mean and 95% confidence interval indicated by the gray line and gray shading (x=y axis; dotted yellow line for reference). Several regions with higher pathology in CBE-injected mice are labeled, as well as the substantia nigra (SN).
Figure 7.
Figure 7.. Network Model Recapitulates α-Synuclein Pathology Spread and Allows Assessment of Regional Vulnerability
(A) A network diffusion model based on retrograde propagation across synaptic connections predicts the spread of pathology from a seed in the iCP in vehicle-injected mice (p < 2.2×10^−16). Regional log10-scaled synuclein pathology values are on the y-axis and log10-scaled predicted pathology values are shown on the x-axis. (B) Pathology in CBE-injected mice is similarly fit base on the network diffusion model (p < 2.2×10^−16). (C) Assessment of model specificity to a seed in the iCP. The iCP (black diamond) was above the 96th percentile of regions (purple dots) in terms of model fit for both groups. (D) Model fit with alternate seeds increases non-linearly with increasing similarity of incoming connection weights to that of the iCP. R2 value on the plot indicate the amount of variance that the general affects model (GAM) was able to explain in the alternate seed fit using in-projection similarity to the iCP as a predictor variable. The purple line represents the fitted mean and the shaded area is the 95% confidence interval. (E) The residual vulnerability values is defined as the average model residual for ipsilateral and contralateral regions, and is plotted here using a heat map overlaid in neuroanatomical space. (F) The scatterplot displays the residual vulnerability values for vehicle-injected mice versus CBE-injected mice and fit by a linear regression. The line of best fit and the 95% confidence interval are indicated by the gray line and the gray shading, respectively.
Figure 8.
Figure 8.. When α-Synuclein Pathology is Low, GCase Activity Modulates Neuronal Vulnerability
(A) Primary hippocampal neurons treated with 320 pg/mL α-synuclein PFFs are stained for pathological pS129 α-synuclein (magenta), MAP2 (gray) and NeuN (blue). (B) Quantification of pS129 α-synuclein area/MAP2 area reveals an over 4-fold elevation in pathology with CBE treatment (Kruskal-Wallis test with Dunn’s multiple comparisons test to PFF-Vehicle: PBS-Vehicle **p=0.0012, PFF-CBE **p=0.0021, n=18/group). (C) Quantification of MAP2 area (Kruskal-Wallis test with Dunn’s multiple comparisons test to PFF-Vehicle: All p-values are greater than 0.05, n=18/group). (D) Quantification of NeuN number (Kruskal-Wallis test with Dunn’s multiple comparisons test to PFF-Vehicle: PBS-Vehicle p=0.2101, PFF-CBE *p=0.0343, n=18/group). (E) Primary hippocampal neurons treated with 40 ng/mL LB α-synuclein and stained as in panel (A). (F) Quantification of pS129 α-synuclein area/MAP2 area (Kruskal-Wallis test with Dunn’s multiple comparisons test to LB-Vehicle: PBS-Vehicle ****p<0.0001, LB-CBE ****p<0.0001, n=7 LB cases). (G) Quantification of MAP2 area (Kruskal-Wallis test with Dunn’s multiple comparisons test to LB-Vehicle: PBS-Vehicle ***p=0.0005, **LB-CBE p=0.0030, n=7 LB cases). (H) Quantification of NeuN number (Kruskal-Wallis test with Dunn’s multiple comparisons test to LB-Vehicle: PBS-Vehicle p=0.2121, LB-CBE ****p<0.0001, n=7 LB cases). (I) Gba+/+ and GbaD409V/+ littermate brains were used to conduct a GCase activity assay. GbaD409V/+ mice showed an approximately 23% reduction in GCase activity compared to wildtype littermates (unpaired t-test: **p=0.0014). (J) Gba+/+ and GbaD409V/+ primary hippocampal neurons treated with 320 pg/mL α-synuclein PFFs were stained as in panel (A). (K) Quantification of pS129 α-synuclein area/MAP2 area (Welch’s t-test ****p<0.0001). Scale bars = 50 μm. Data are represented as mean ± SEM.

References

    1. Aarsland D, Andersen K, Larsen JP, Lolk A, and Kragh-Sorensen P (2003). Prevalence and characteristics of dementia in Parkinson disease: an 8-year prospective study. Archives of neurology 60, 387–392. - PubMed
    1. Aflaki E, Borger DK, Moaven N, Stubblefield BK, Rogers SA, Patnaik S, Schoenen FJ, Westbroek W, Zheng W, Sullivan P, et al. (2016). A New Glucocerebrosidase Chaperone Reduces alpha-Synuclein and Glycolipid Levels in iPSC-Derived Dopaminergic Neurons from Patients with Gaucher Disease and Parkinsonism. J Neurosci 36, 7441–7452. - PMC - PubMed
    1. Aflaki E, Westbroek W, and Sidransky E (2017). The Complicated Relationship between Gaucher Disease and Parkinsonism: Insights from a Rare Disease. Neuron 93, 737–746. - PMC - PubMed
    1. Appel-Cresswell S, Vilarino-Guell C, Encarnacion M, Sherman H, Yu I, Shah B, Weir D, Thompson C, Szu-Tu C, Trinh J, et al. (2013). Alpha-synuclein p.H50Q, a novel pathogenic mutation for Parkinson’s disease. Movement disorders : official journal of the Movement Disorder Society 28, 811–813. - PubMed
    1. Baba M, Nakajo S, Tu PH, Tomita T, Nakaya K, Lee VM, Trojanowski JQ, and Iwatsubo T (1998). Aggregation of alpha-synuclein in Lewy bodies of sporadic Parkinson’s disease and dementia with Lewy bodies. The American journal of pathology 152, 879–884. - PMC - PubMed

Publication types

MeSH terms

LinkOut - more resources