. 2020 Jan 15:389:114876.
doi: 10.1016/j.taap.2019.114876. Epub 2019 Dec 30.

Bioactivity screening of environmental chemicals using imaging-based high-throughput phenotypic profiling

Affiliations

Bioactivity screening of environmental chemicals using imaging-based high-throughput phenotypic profiling

Johanna Nyffeler et al. Toxicol Appl Pharmacol. .

Abstract

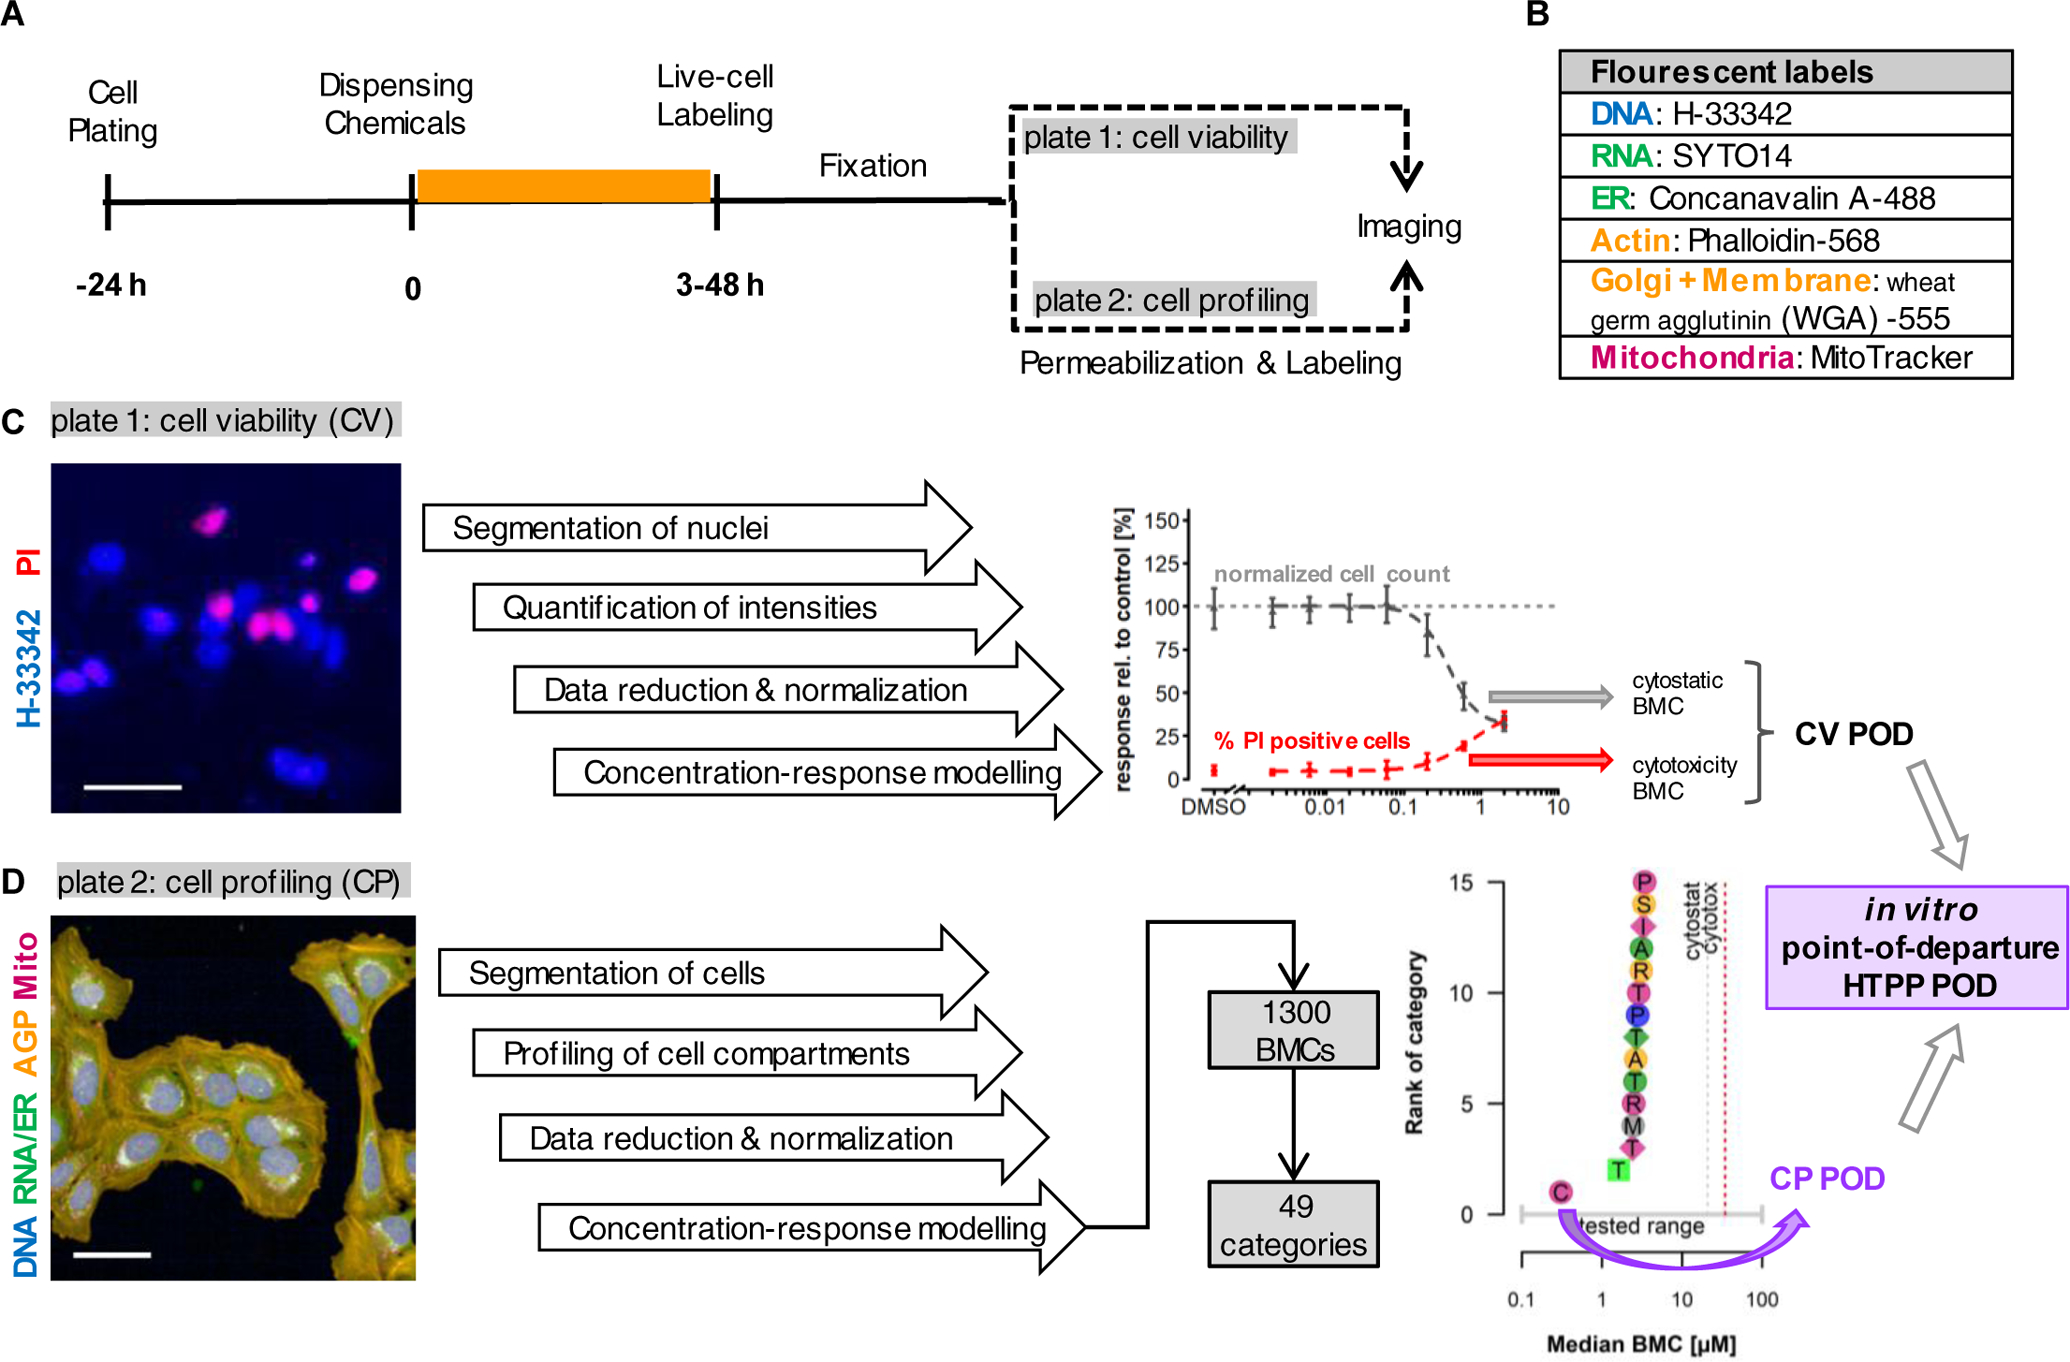
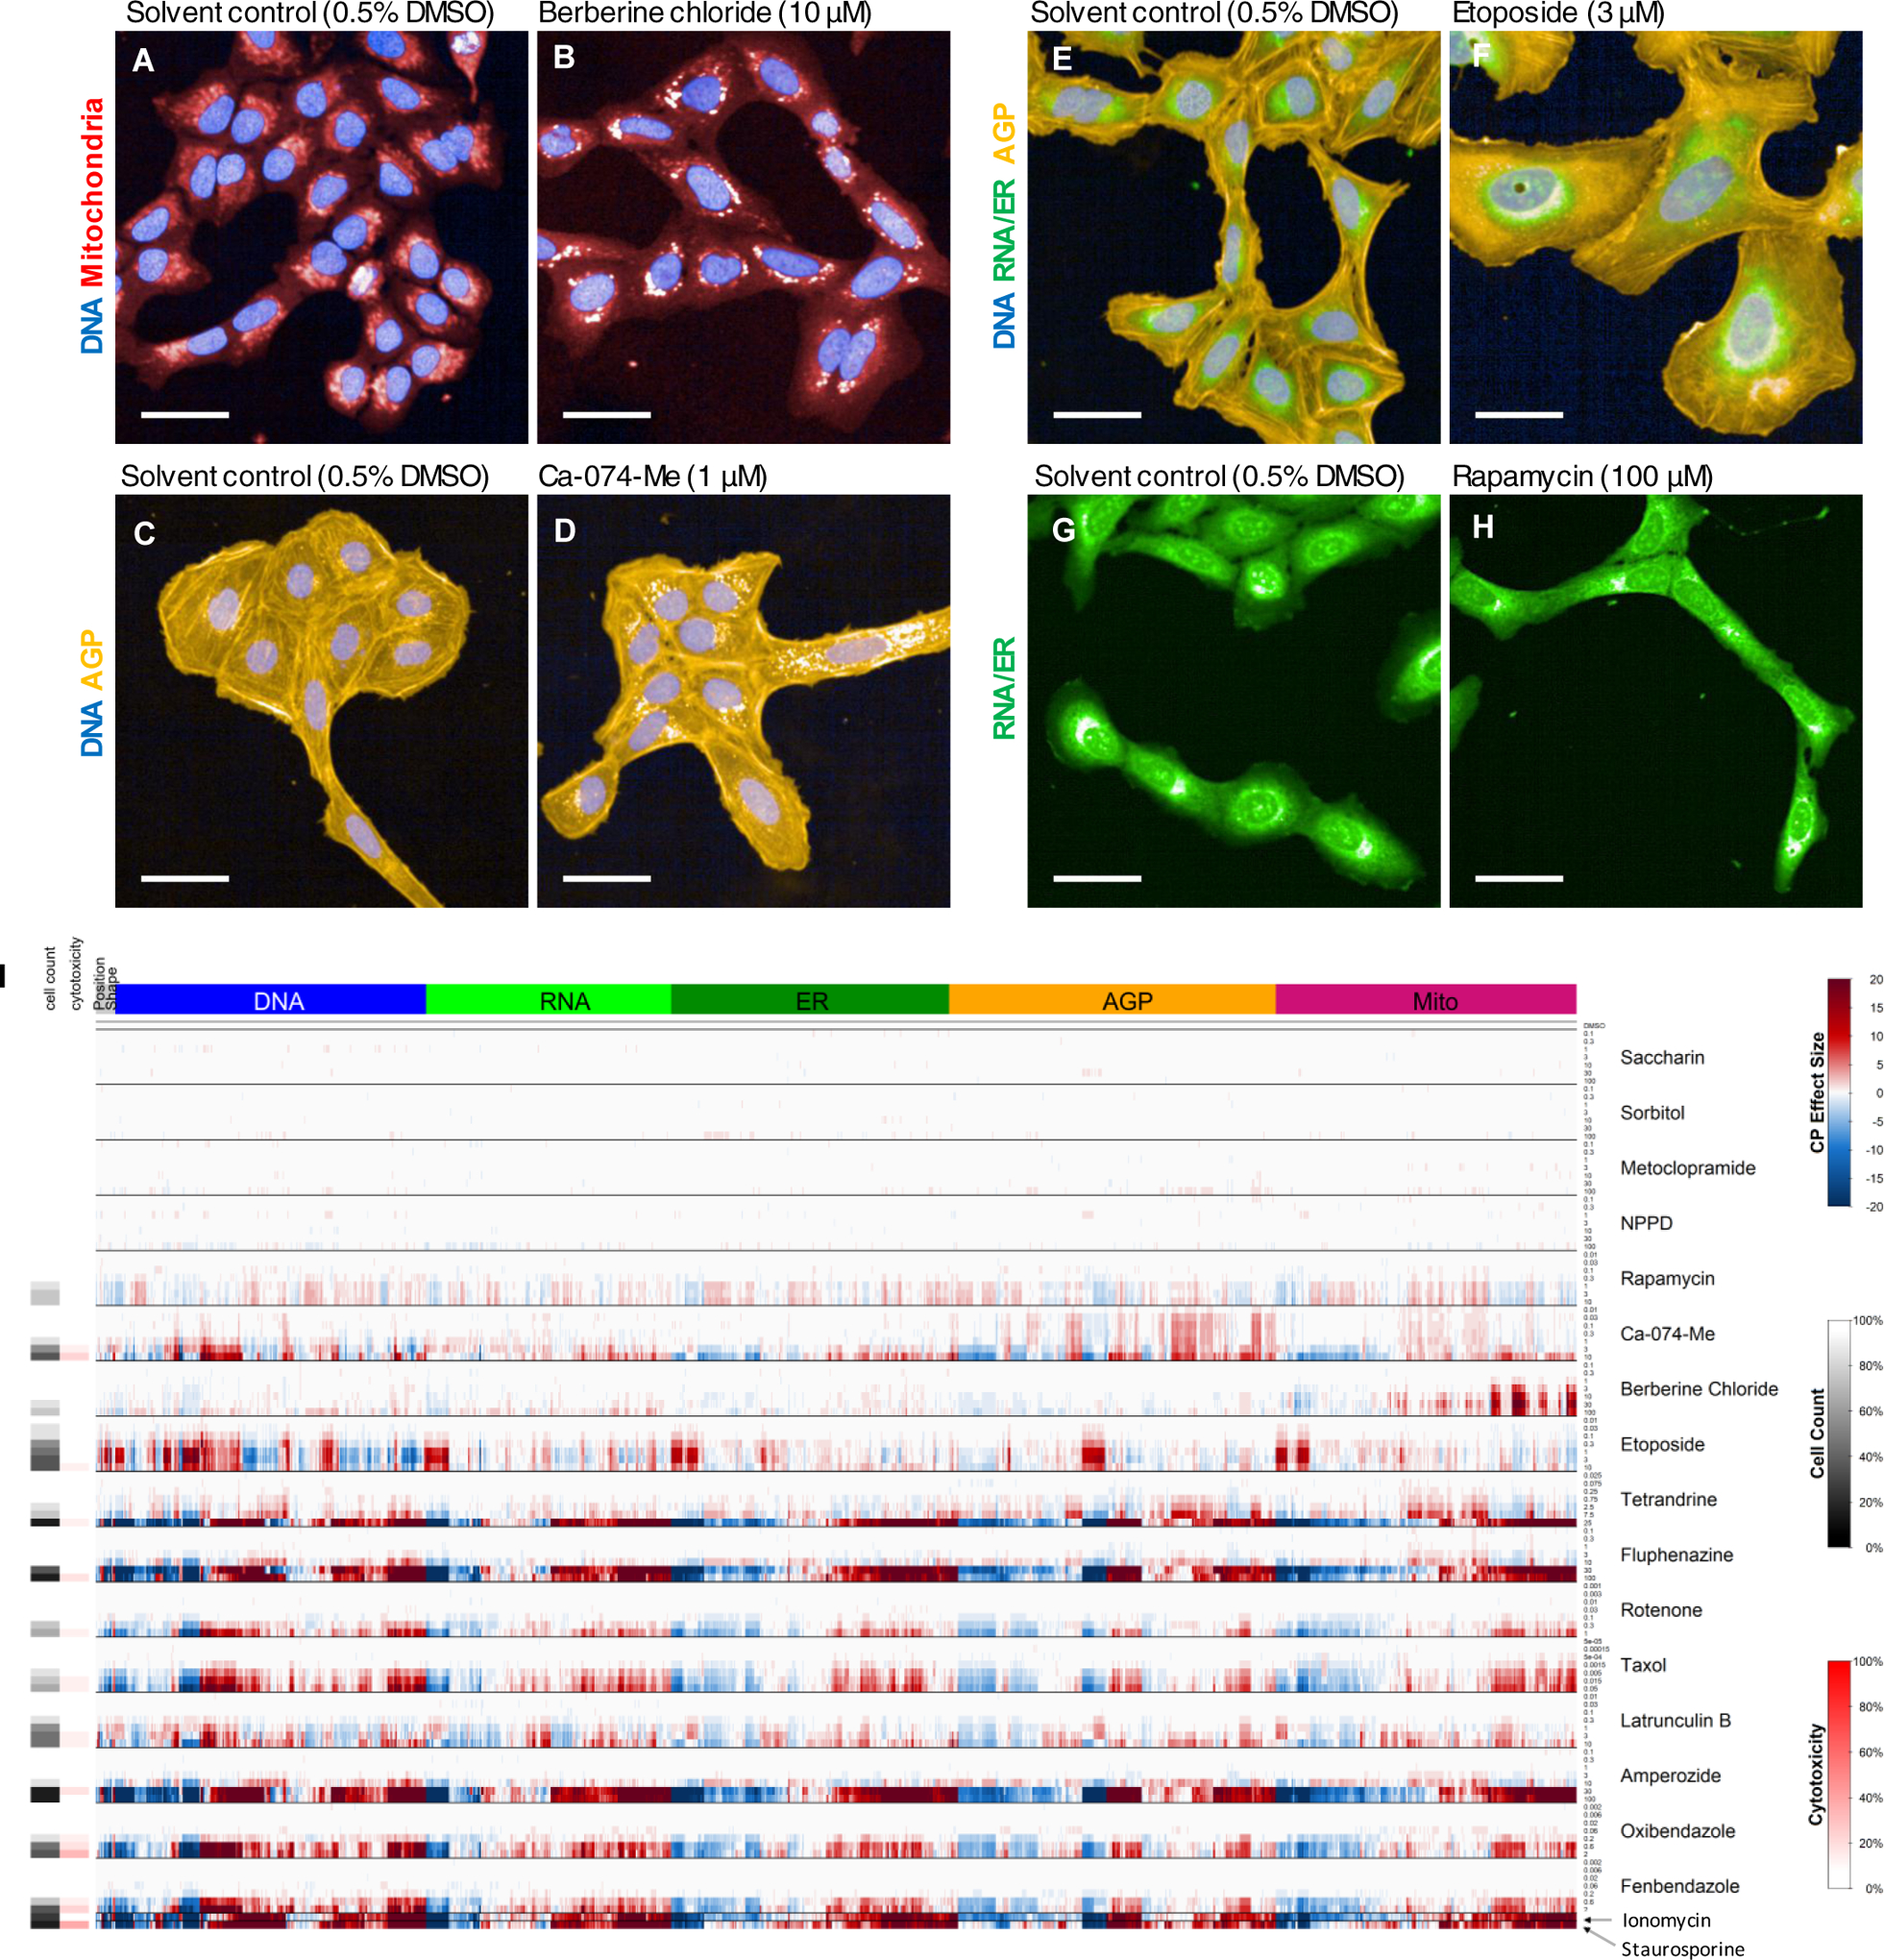
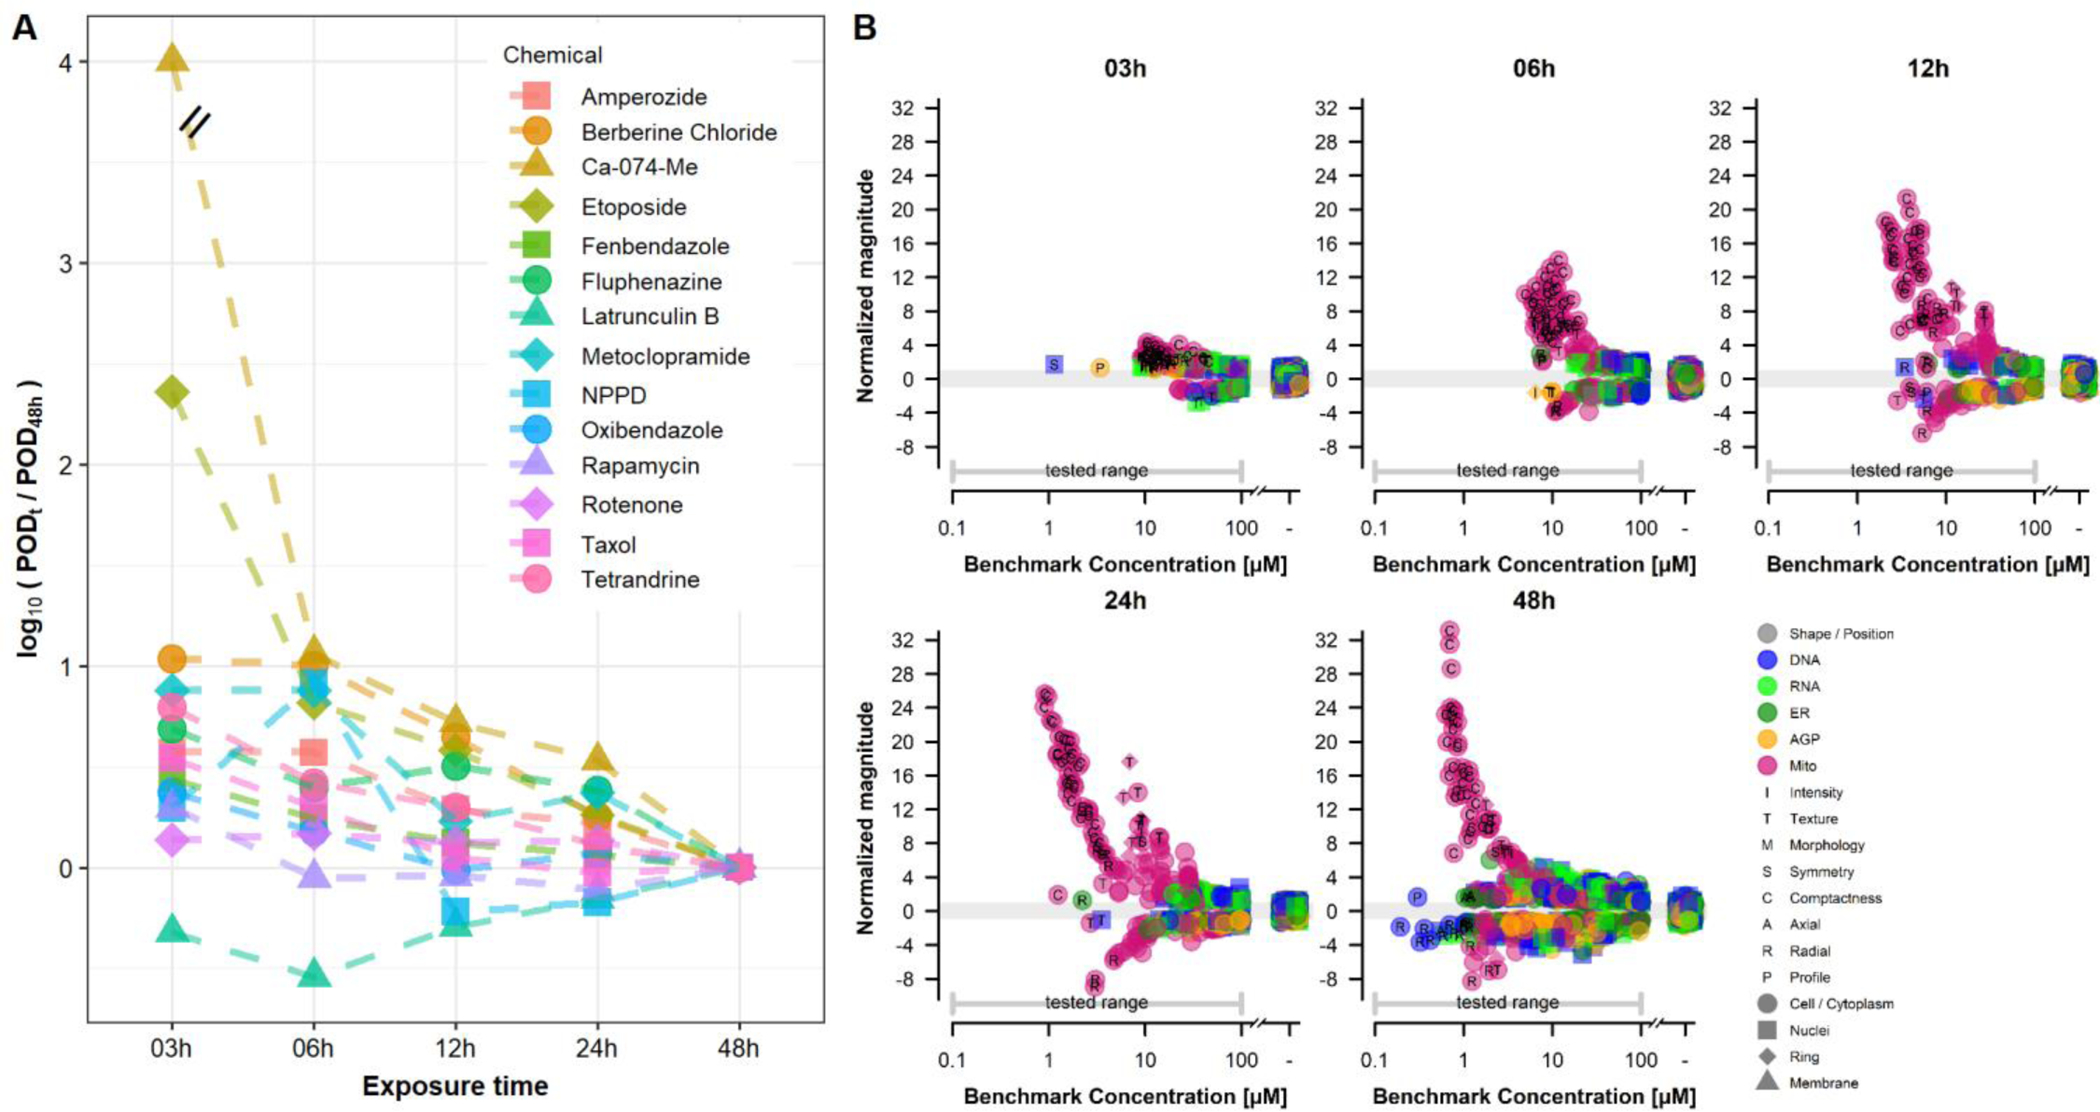
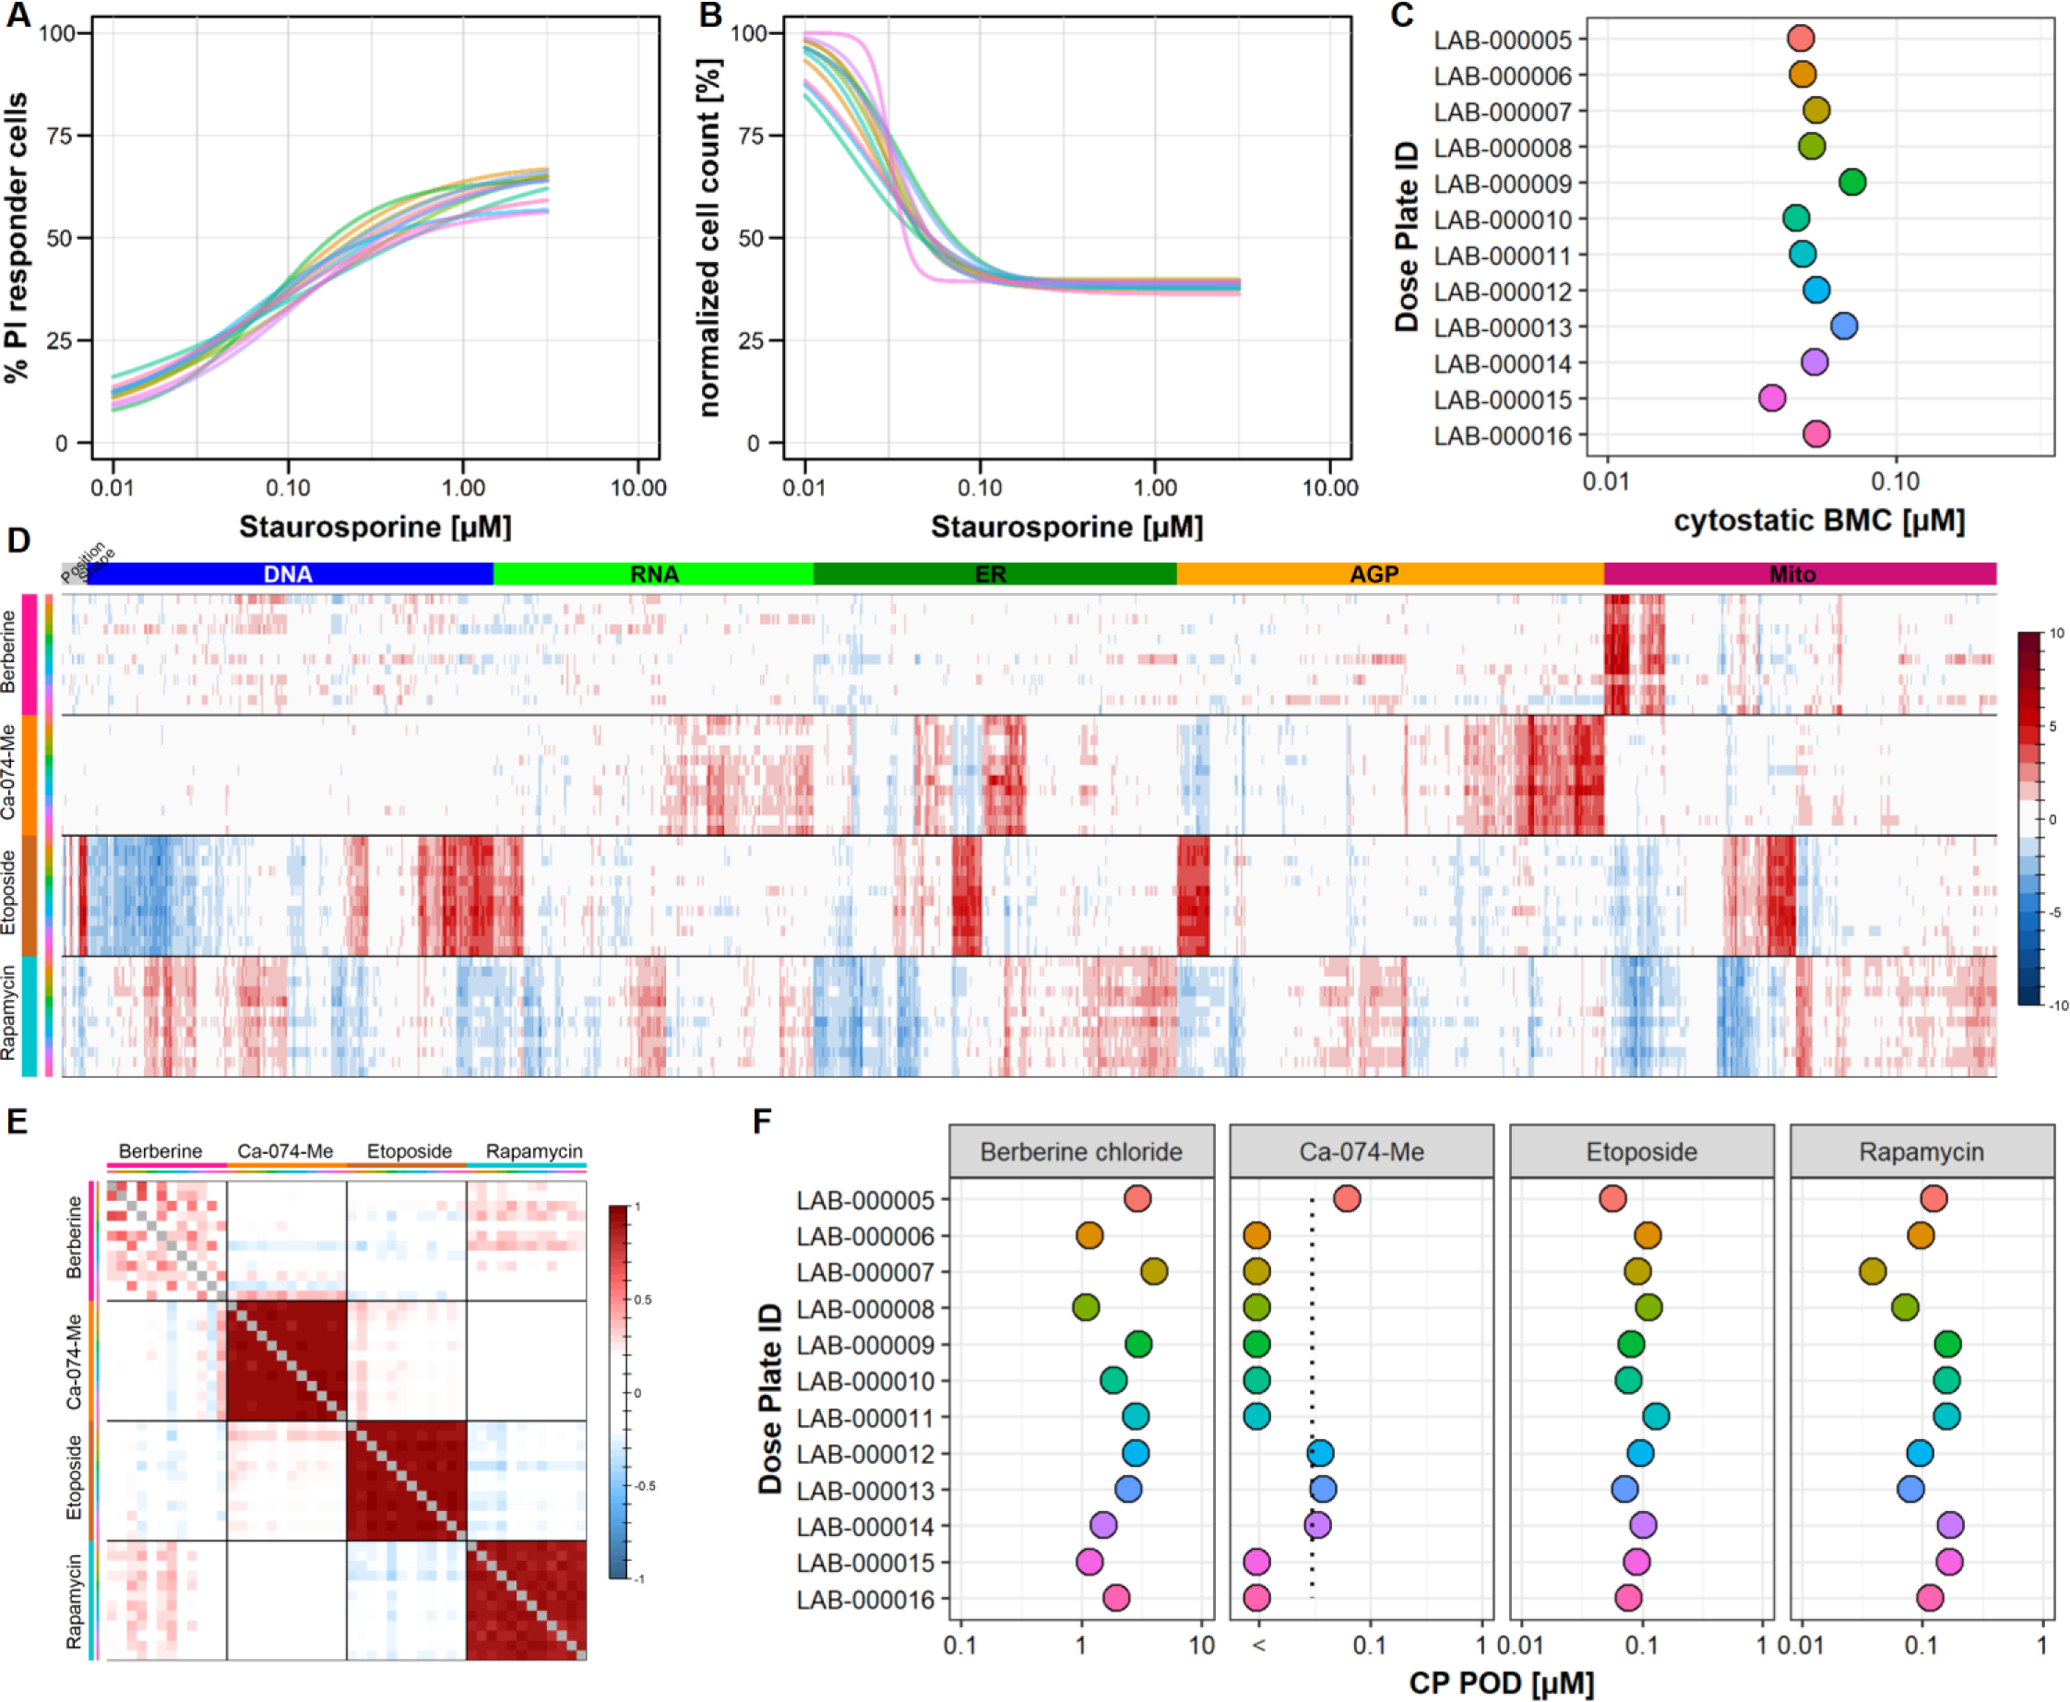
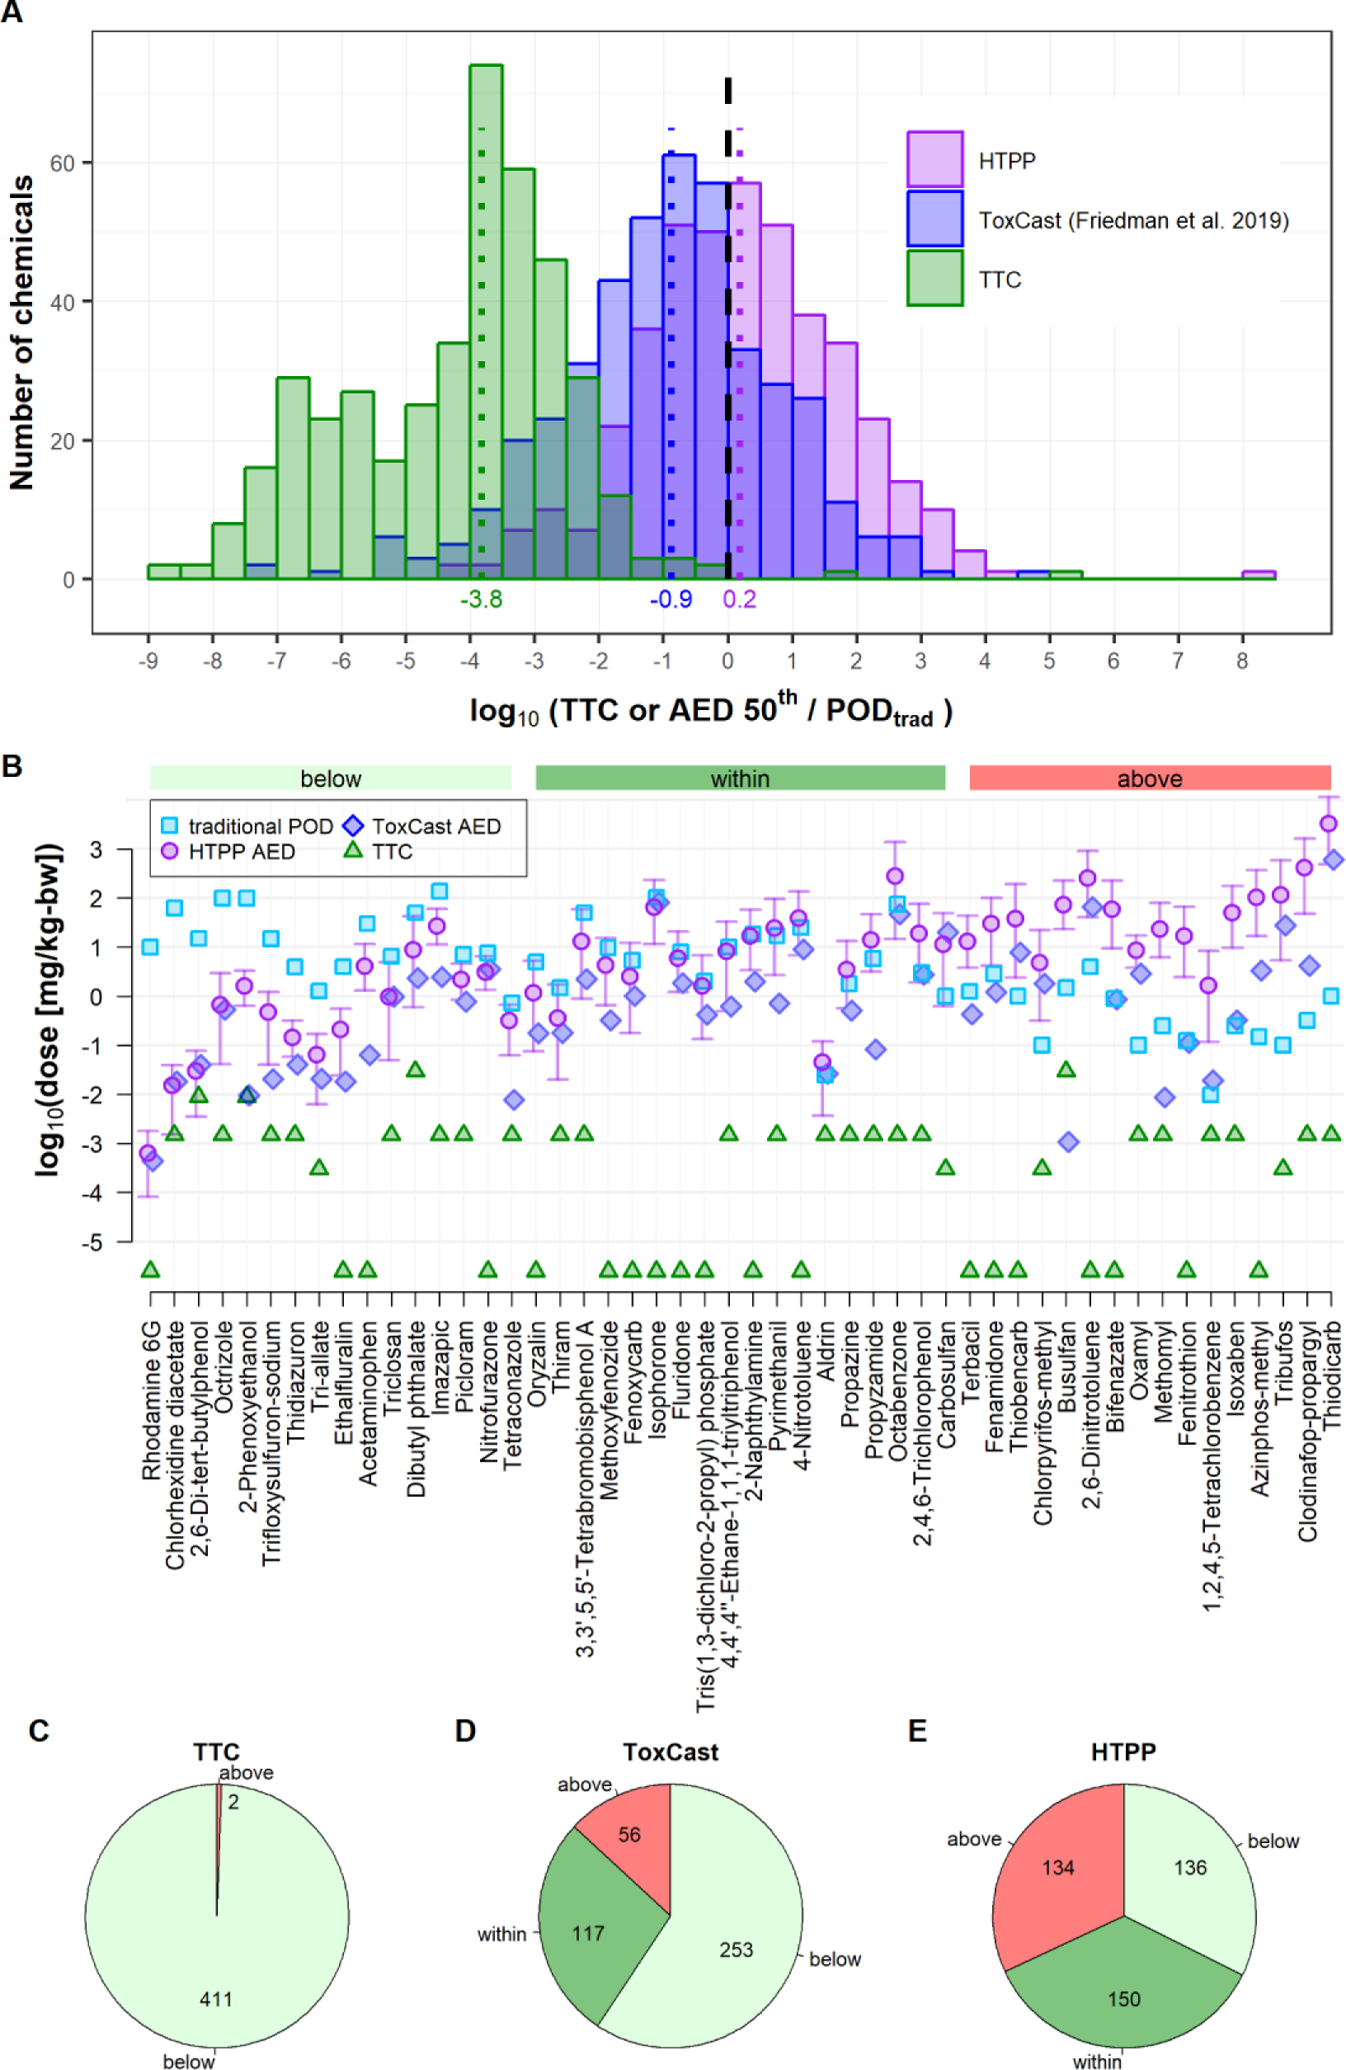
The present study adapted an existing high content imaging-based high-throughput phenotypic profiling (HTPP) assay known as "Cell Painting" for bioactivity screening of environmental chemicals. This assay uses a combination of fluorescent probes to label a variety of organelles and measures a large number of phenotypic features at the single cell level in order to detect chemical-induced changes in cell morphology. First, a small set of candidate phenotypic reference chemicals (n = 14) known to produce changes in the cellular morphology of U-2 OS cells were identified and screened at multiple time points in concentration-response format. Many of these chemicals produced distinct cellular phenotypes that were qualitatively similar to those previously described in the literature. A novel workflow for phenotypic feature extraction, concentration-response modeling and determination of in vitro thresholds for chemical bioactivity was developed. Subsequently, a set of 462 chemicals from the ToxCast library were screened in concentration-response mode. Bioactivity thresholds were calculated and converted to administered equivalent doses (AEDs) using reverse dosimetry. AEDs were then compared to effect values from mammalian toxicity studies. In many instances (68%), the HTPP-derived AEDs were either more conservative than or comparable to the in vivo effect values. Overall, we conclude that the HTPP assay can be used as an efficient, cost-effective and reproducible screening method for characterizing the biological activity and potency of environmental chemicals for potential use in in vitro-based safety assessments.

Keywords: Cell painting; High content imaging; High-throughput profiling; ToxCast.


Conflict of interest statement

Declaration of Competing Interest None

Figures

Fig. 1:
Fig. 1:. Experimental Strategy Overview.
(A) Diagram illustrating the timing of laboratory workflows for parallel assays, i.e. cell viability (CV) and cell profiling (CP). U-2 OS cells were plated in 384-well format and allowed to recover for 24 h prior to dispensing of test chemicals. Cells were then incubated with test chemicals for various exposure durations (3 – 48 h) for the different phases of experimentation. Thirty minutes prior to sampling, live-cell labeling reagents were applied to each assay plate. Cells were then sampled via fixation with PFA and thoroughly rinsed. For CV plates, cells were imaged with no further sample processing. For CP, cells were further permeabilized and labeled with additional fluorescent probes. (B) List of the fluorescent probes used in the CP assay and associated organelles. Note that in some instances multiple organelles were labeled and imaged in the same fluorescent channel. (C) Overview of data analysis steps for the CV assay. Endpoints were derived from analysis of cells labeled with H-33342 and PI as shown in the representative image. Two endpoints were modeled: 1) normalized cell count (nCC) and 2) percent of PI-positive cells. BMCs were calculated for each as described in Methods. The minimum of the cytostatic and cytotoxic BMCs was defined as the CV POD. (D) Overview of data analysis steps for the CP assay. Phenotypic features were derived from analysis of cells labeled with the combination of fluorescent probes in panel B as shown in the representative image. A total of 1300 features were calculated at the cell level and used to calculate well-level data for concentration-response modeling. Results were aggregated into categories as described in Methods. The CP POD was defined as the median BMC of the most sensitive category. The HTPP POD was defined as the minimum of CV POD and CP POD.
Fig. 2:
Fig. 2:. Qualitative and Quantitative Comparison of Reference Chemical Phenotypes.
U-2 OS cells were treated with test chemicals for 48 h before sampling and imaging. (A-H) Representative images of reference chemicals and corresponding solvent controls. Only selected channels are shown for each chemical. Scale bar = 50 μm. Distinct effects on cellular morphology were observed for each chemical. (I) Quantitative summary of phenotypic effects for the Reference Set. Well-level feature data were normalized and scaled per plate and then averaged. The columns of the heatmap correspond to the 1300 phenotypic features, organized by fluorescent channel. Colors represent the magnitude of increase or decrease in a measured feature with respect to DMSO control. Gray and red tiles to the far left of the heatmap correspond to cell count (nCC) and percent PI-positive cells, respectively. Rows correspond to individual concentrations of the test chemicals. Data for each chemical is separated by horizontal black lines and test concentrations are in ascending order from top to bottom. Chemicals with weak phenotypic effects are at the top of the heatmap. Chemicals with marked phenotypic effects below the threshold for cytotoxicity are in the middle of the heatmap. Chemicals where phenotypic effects are observed at or near the threshold for cytotoxicity are at the bottom of the heatmap. The distinct phenotypic effects observed qualitatively in panels A-H are recapitulated in quantitative visualization of the CP data. Data were derived from ~300 cells/well across 3 technical replicate wells and 3 biological replicates (n = 9 wells total).
Figure 3.
Figure 3.. Concentration-Response Modeling Results and Identification of CP POD for Four Reference Chemicals.
(A) Potency-magnitude plots for four reference chemicals. Concentration-response modeling of feature data from Fig. 2B was performed and feature-level BMCs calculated as described in Methods. The normalized magnitude (y-axis) was defined as the largest effect size observed at a non-cytotoxic concentration (see Fig. S9B for details). Points on each plot represent the BMC and normalized magnitude for a feature, coded by fluorescent channel (color), compartment (shape) and feature type (letter). The gray shaded area is at −1 < magnitude < 1 and represents the threshold for a marked response from control for scaled feature data. The onset of cytotoxicity and cytostatic effects are marked by red and gray vertical dotted lines, respectively. Absence of vertical lines indicates that cytotoxicity or cytostatic effects were not observed within the concentration range tested. Distinct profiles of phenotypic changes are observed for each reference chemical and effects are observed well below the threshold for cytotoxicity. (B) Accumulation plots for exemplary reference chemicals. The feature-level BMCs were grouped into 49 categories. Categories where > 30% of the constituent features were concentration-responsive were ranked in ascending order according to the median BMC of the category. The 25 most sensitive categories for each chemical are displayed in the accumulation plot and coded as described in panel A. For each chemical, the most sensitive categories are the leftward most points on the plot. The most sensitive category is defined as the CP POD (see Figure 1).
Figure 4.
Figure 4.. Temporal Characterization of Phenotypic Profiles and CP POD.
U-2 OS cells were treated with chemicals in the Reference Set for 3, 6, 12, 24 or 48 h prior to sampling and imaging. (A) CP PODs were calculated for each of 14 phenotypic reference chemicals for each exposure duration as described in the Methods. The ratio of the CP POD at 48 hours versus the CP POD at shorter exposure durations was calculated. For four chemical x exposure time combinations, there was no CP POD at the maximal tested concentration. The maximal tested concentration + ½ log10 was used as a surrogate. For most chemicals, the CP POD was stable (i.e. did not vary more than one order of magnitude) between 12 and 48 h exposure durations. (B) Potency-magnitude plots for an exemplary reference chemical, berberine chloride, at different exposure durations. Concentration-response modeling of feature data was performed, and feature-level BMCs calculated as described in Methods. The normalized magnitude (y-axis) was defined as the largest effect size observed at a non-cytotoxic concentration (see Fig. S9B for details). Points on each plot represent the BMC and normalized magnitude for a feature, coded by channel (color), compartment (shape) and feature type (letter). The gray shaded area is at −1 < magnitude < 1 and represents the threshold for a marked response from control for scaled feature data. Note that the magnitude of effects on mitochondrial morphology increases with longer exposure durations. Data was derived from ~300 cells/well across 3 technical replicate wells and 3 biological replicates (n = 9 wells total).
Figure 5.
Figure 5.. Evaluation of CV and CP Assay Performance.
(A-C) Reproducibility of CV assay. A six-point concentration-response of staurosporine was included on every CV assay plate (“t” design, Fig. S1A) in order to evaluate assay performance. Each curve in the left (% PI-positive cells) and middle (nCC) panels represents data pooled within a plate group (i.e. across four biological replicates). Concentration-response curves were fit using the tcpl package as described in Methods. The concentration-response curves for these two endpoints were similar across plate groups (nearly superimposable) indicating a high degree of assay reproducibility. Cytostatic BMCs for staurosporine were also highly reproducible across plate groups, varying by less than one half order of magnitude. (D-F) Reproducibility of CP profiles. A six-point concentration-response of four reference chemicals was included on every CP assay plate (“t” design, Fig. S1A). In the heatmap (panel D) one concentration per chemical that produced marked phenotypic effects is shown: Berberine chloride (10 μM), Ca-074-Me (0.3 μM), Etoposide (0.3 μM), Rapamycin (3 μM). Well-level feature data was normalized and scaled per plate and then averaged within plate group. The columns of the heatmap correspond to the 1300 features, organized by fluorescent channel. Tile colors represent the magnitude of increase or decrease in a measured feature with respect to DMSO control. Each row represents data from a plate group. Data for each chemical is separated by horizontal black lines and labeled according to the multicolored tiles to the left of the heatmap. Reproducible phenotypic profiles were observed for each reference chemical across plate groups. (E) Correlation of CP profiles. Data was normalized and scaled per plate and then averaged within plate group. Normalized area under the curve (nAUC) was computed for each endpoint. The nAUC is defined as the summed mean magnitude across all non-cytotoxic concentrations (see Fig. S9B for details). Each row/column represents data from a plate group and the profiles were compared to each other using Spearman correlation coefficient (red = correlation, blue = anti-correlation). Reference chemical profiles display a high degree of positive correlation across plate groups and low correlation with each other. (F) Reproducibility of CP PODs. Data was normalized and scaled per plate, aggregated within plate group and used for concentration-response modeling with BMDExpress. The CP POD is defined as the median concentration of the most sensitive category that had ≥ 30% affected endpoints. The vertical dotted line indicates the lowest tested concentration. If the POD was below the tested range, the POD was set as half an order of magnitude below the lowest tested concentration. For 3 of 4 reference chemicals, CP PODs were highly reproducible across plate groups, varying by less than one half order of magnitude. For the remaining chemical (Ca-074-Me) CP PODs were mostly below the tested concentration range.
Figure 6.
Figure 6.. HTPP Screening Summary.
(A) Comparison of hits for the CV and CP assays. A total of 462 unique chemicals were screened. The Venn diagram indicates the number of chemicals that were CV hits (left), CP hits (right), both (union) or negative in the HTPP assay. (B) Histogram of the number of affected categories across all positive chemicals (n = 441). (C) Scatterplot of the CP POD (log10, μM) versus the ratio of the median category potency to the CP POD (defined as the most sensitive category potency). Each point represents a chemical that was positive in the HTPP assay. Color coding represents the number of categories that were affected by a chemical. (D) Accumulation plots for exemplary chemicals labeled in panel C. The feature-level BMCs were grouped into 49 categories. Categories where ≥ 30% of the constituent features were concentration-responsive were ranked in ascending order according to the median BMC of the category. Only the 20 most potent categories are shown. The onset of cytotoxicity and cytostatic effects are marked by red and gray vertical dotted lines, respectively. Absence of vertical lines indicates that cytotoxicity or cytostatic effects were not observed within the concentration range tested.
Figure 7.
Figure 7.. Comparison of HTPP Assay Results to In Vivo Effect Values and published NAM Results.
(A) Comparison of different alternative approaches to the PODtrad. HTPP PODs were used to extrapolate an administered equivalent dose (HTPP AED) that would correspond to a plasma concentration equivalent to the HTPP POD in a human population. The median HTPP AED (HTPP AED 50th) was then compared to the 5th percentile (PODtrad) derived from a collection of in vivo mammalian effect values from a variety of study types and test species that used an oral route of administration. Similarly, PODs from the ToxCast assay suite were calculated from published literature (Paul-Friedman et al., 2019), extrapolated to AEDs and compared to PODtrad. For comparison, TTCs from the same study were added as well. Vertical dotted lines and numbers below indicate the median of the distribution for each NAM. The vertical dashed line indicates the unity line. The histogram comprises only chemicals that had available HTTK and in vivo data (ToxCast n=426, TTC n=413, HTPP n=420 (only HTPP hits)). (B) IVIVE results for exemplary chemicals. The PODtrad values (lightblue squares) are compared to HTPP AED results. Monte Carlo simulation was used during reverse dosimetry analysis to account for physiological diversity in an average human population. The median and 5th to 95th confidence interval are shown for HTPP AED (purple circle and error bars). For ToxCast, only the median AED is displayed (darkblue diamonds). Chemicals were sorted according to the difference between the HTPP AED distribution and the PODtrad and grouped into “below”, “within” and “above” categories as described in Methods. (C) Tally of the number of chemicals grouped in the “above”, “within” and “below” categories. Chemicals in the former group had AEDs that overpredicted the dose associated with in vivo effects. Chemicals in the two latter groups provided either a comparable or conservative surrogate for the PODtrad, respectively. Since no dose range exists for the TTC approach, the chemicals were grouped into “above” and “below” only.

References

    1. Balgi AD, Fonseca BD, Donohue E, Tsang TC, Lajoie P, Proud CG, … Roberge M (2009). Screen for chemical modulators of autophagy reveals novel therapeutic inhibitors of mTORC1 signaling. PLoS One, 4(9), e7124. doi:10.1371/journal.pone.0007124 - DOI - PMC - PubMed
    1. Blackwell BR, Ankley GT, Corsi SR, DeCicco LA, Houck KA, Judson RS, … Villeneuve DL (2017). An “EAR” on Environmental Surveillance and Monitoring: A Case Study on the Use of Exposure-Activity Ratios (EARs) to Prioritize Sites, Chemicals, and Bioactivities of Concern in Great Lakes Waters. Environ Sci Technol, 51(15), 8713–8724. doi:10.1021/acs.est.7b01613 - DOI - PMC - PubMed
    1. Bray MA, Singh S, Han H, Davis CT, Borgeson B, Hartland C, … Carpenter AE (2016). Cell Painting, a high-content image-based assay for morphological profiling using multiplexed fluorescent dyes. Nat Protoc, 11(9), 1757–1774. doi:10.1038/nprot.2016.105 - DOI - PMC - PubMed
    1. Buchser W, Collins M, Garyantes T, Guha R, Haney S, Lemmon V, … Trask OJ (2012). Assay Development Guidelines for Image-Based High Content Screening, High content Analysis and High Content Imaging. In Sittampalam GS, Grossman A, & Brimacombe K (Eds.), Assay Guidance Manual. Bethesda, MD: Eli Lilly & Company and the National Center for Advancing Translational Sciences. - PubMed
    1. Caicedo JC, Cooper S, Heigwer F, Warchal S, Qiu P, Molnar C, … Carpenter AE (2017). Data-analysis strategies for image-based cell profiling. Nat Methods, 14(9), 849–863. doi:10.1038/nmeth.4397 - DOI - PMC - PubMed

Publication types

Substances