. 2020 Feb 20;135(8):547-557.
doi: 10.1182/blood.2019003140.

Antibodies against the erythroferrone N-terminal domain prevent hepcidin suppression and ameliorate murine thalassemia

Affiliations

Antibodies against the erythroferrone N-terminal domain prevent hepcidin suppression and ameliorate murine thalassemia

João Arezes et al. Blood. .

Abstract

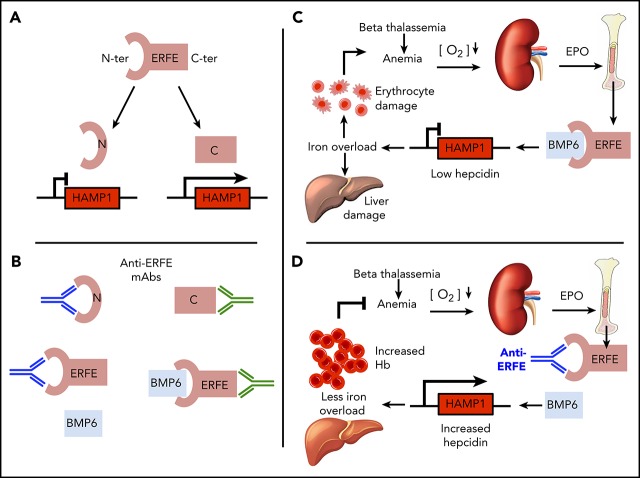
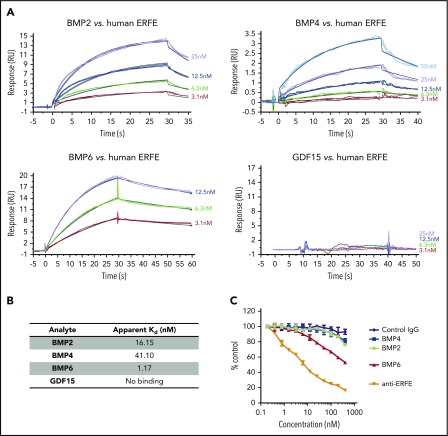
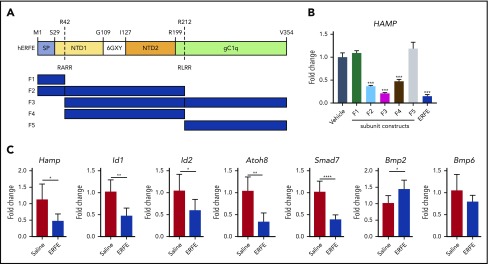
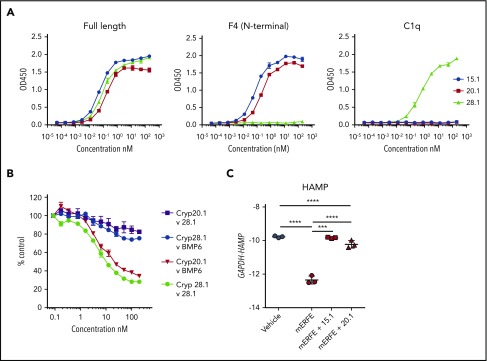
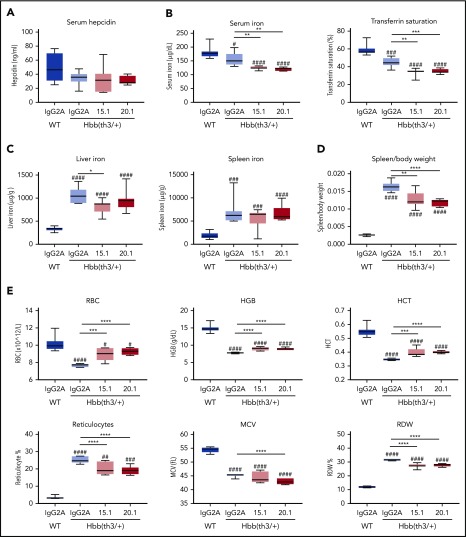
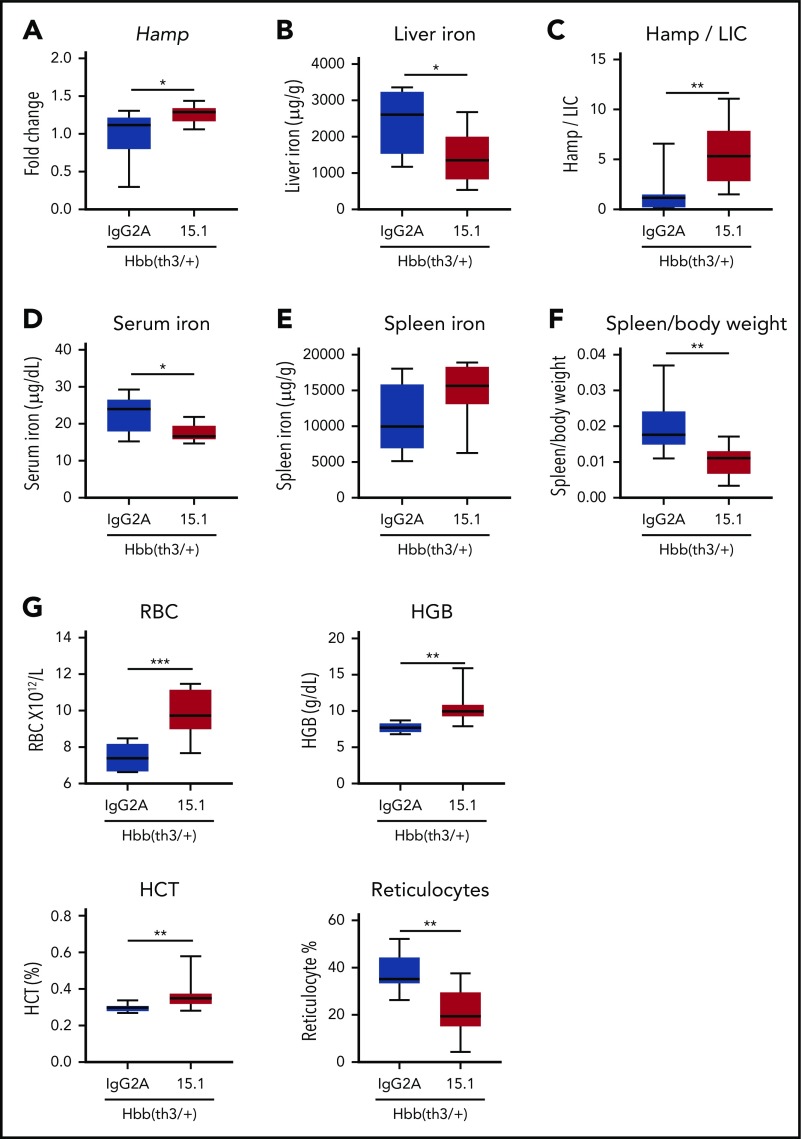
Erythroferrone (ERFE) is produced by erythroblasts in response to erythropoietin (EPO) and acts in the liver to prevent hepcidin stimulation by BMP6. Hepcidin suppression allows for the mobilization of iron to the bone marrow for the production of red blood cells. Aberrantly high circulating ERFE in conditions of stress erythropoiesis, such as in patients with β-thalassemia, promotes the tissue iron accumulation that substantially contributes to morbidity in these patients. Here we developed antibodies against ERFE to prevent hepcidin suppression and to correct the iron loading phenotype in a mouse model of β-thalassemia [Hbb(th3/+) mice] and used these antibodies as tools to further characterize ERFE's mechanism of action. We show that ERFE binds to BMP6 with nanomolar affinity and binds BMP2 and BMP4 with somewhat weaker affinities. We found that BMP6 binds the N-terminal domain of ERFE, and a polypeptide derived from the N terminus of ERFE was sufficient to cause hepcidin suppression in Huh7 hepatoma cells and in wild-type mice. Anti-ERFE antibodies targeting the N-terminal domain prevented hepcidin suppression in ERFE-treated Huh7 cells and in EPO-treated mice. Finally, we observed a decrease in splenomegaly and serum and liver iron in anti-ERFE-treated Hbb(th3/+) mice, accompanied by an increase in red blood cells and hemoglobin and a decrease in reticulocyte counts. In summary, we show that ERFE binds BMP6 directly and with high affinity, and that antibodies targeting the N-terminal domain of ERFE that prevent ERFE-BMP6 interactions constitute a potential therapeutic tool for iron loading anemias.


Conflict of interest statement

Conflict-of-interest disclosure: This work was supported in part by funding from Pfizer to J.A., K.M., D.Q., S.J.D., and H.D. N.F., A.S., S.B., E.L., M.S.T., D.D.P., O.C., M.L., J.E.M., and R.J. are employed by Pfizer. N.F., O.C., R.J., J.A., K.M., S.J.D., and H.D. are named inventors on a patent application currently under evaluation. The remaining authors declare no competing financial interests.

Figures

None
Graphical abstract
Figure 1.
Figure 1.
ERFE binds to BMP2, BMP4, and BMP6 with different affinities. (A) Binding kinetics of ERFE to BMP2, BMP4, BMP6, and GDF15 assessed by surface plasmon resonance (Biacore). No binding was observed for GDF15. Full-length human ERFE was immobilized in a CM4 chip. BMPs/GDF15 were tested at different concentrations (3.1-50 nM) for binding to immobilized ERFE and assayed for up to 60 seconds (2 replicates per condition). RU, resonance units. Apparent Kd (dissociation constant) was calculated for binding of BMP2, BMP4, and BMP6 to ERFE (assuming 1:1 binding interaction). (B) Apparent Kd of ERFE to BMP2, BMP4, and BMP6. (C) HTRF assay for detection of binding competition between BMPs (0.1-400 nM) and an anti-ERFE antibody. Unlabeled anti-ERFE antibody (anti-ERFE) and a control IgG antibody were used as positive and negative controls, respectively. Values calculated as %ΔF = [(F665 Sample/F615 Sample) − (F665 Control/F615 Control)/(F665 Control/F615 Control)] × 100. Data plotted as “% Control” represent the background fluorescence energy transfer in wells containing each labeled antibody, in assay buffer, alone.
Figure 2.
Figure 2.
The N-terminal domain of ERFE is sufficient to suppress hepcidin. (A) Structure of human ERFE, containing a signal peptide (SP), N-terminal region (NTD) with a collagen-like domain (6 GXY), and a globular C1q domain (gC1Q). The location of the 2 predicted furin cleavage sites are indicated (RARR and RLRR). ERFE subunits designed and expressed based on predicted furin cleavage sites (F1-F5). (B) Huh7 cells were treated for 24 hours with 1 µg/mL of ERFE subunits F1 to F5, full-length or vehicle, and analyzed for HAMP gene expression. (C) Wild-type mice were treated intraperitoneally with 100 µg of F2 ERFE or saline and analyzed 3 hours after treatment for liver gene expression of 5 BMP target genes (Hamp1, Id1, Id2, Atoh8, Smad7) and Bmp2 and Bmp6. Columns represent mean ± standard deviation. n = 3 replicates per group, panel B; n = 6 mice per group, panel C. *P < .05; **P < .01; ***P < .001; ****P < .0001 using the Student t test.
Figure 3.
Figure 3.
Neutralizing anti-ERFE antibodies bind to the N-terminal region of ERFE. (A) Anti-ERFE antibodies (15.1, 20.1, and 28.1) were assayed at different concentrations (10−5-102 nM) in ELISA plates coated with full-length ERFE, F4 (N-terminal domain region), and the globular C1q domain. (B) HTRF assay for detection of binding competition using cryptate-labeled anti-ERFE antibodies (20.1 and 28.1) and BMP6 (0.1-200 nM) and unlabeled antibody as positive control. Values calculated as %ΔF = [(F665 Sample/F615 Sample) − (F665 Control/F615 Control)/(F665 Control/F615 Control)] × 100. Data plotted as “% Control” represent the background fluorescence energy transfer in wells containing each labeled antibody, in assay buffer, alone. (C) Huh7 cells were treated for 24 hours with 200 ng/mL of murine ERFE alone or in combination with 10 µg/mL of anti-ERFE antibodies 15.1 and 20.1, and analyzed for HAMP gene expression. Bars represent mean ± standard deviation. n = 3 replicates per group. ***P < .001; ****P < .0001 using the Student t test.
Figure 4.
Figure 4.
Antibodies binding ERFE N-terminal domain block hepcidin suppression in EPO-treated mice. Eight-week-old wild-type male mice were treated intraperitoneally with 200 IU of EPO in combination with intravenous injection of an IgG2A antibody control, anti-ERFE 15.1, or anti-ERFE 20.1 (or vehicle alone instead of EPO for analysis of baseline values). Mice were killed and analyzed 18 hours after treatment for assessment of Hamp expression (A) and serum hepcidin (B). n = 3, vehicle; n = 5-6, EPO-treated mice. *P < .05; **P < .01; ***P < .001; ****P < .0001 using the Student t test.
Figure 5.
Figure 5.
Antibodies targeting the N-terminal domain of ERFE decrease iron levels and alter blood parameters in thalassemic mice. Four-week-old male Hbb(th3/+) mice were treated intravenously with 5 mg/kg of IgG2A control antibody, anti-ERFE 15.1, or anti-ERFE 20.1, twice a week for 4 weeks. IgG2A-treated wild-type (WT) mice were used as control for basal levels. After 4 weeks of treatment, mice were killed for analysis of serum hepcidin (A), serum iron and transferrin saturation (B), liver and spleen non-heme iron (C), spleen to body weight ratio (D), and blood parameters (E). *P < .05; **P < .01; ***P < .001; ****P < .0001 using one-way analysis of variance followed by the Tukey test for differences between IgG2A-treated Hbb(th3/+) mice and anti–ERFE-treated mice. #P < .05, ##P < .01, ###P < .001, ####P < .0001 using one-way analysis of variance followed by the Tukey test for differences between WT mice and Hbb(th3/+) mice. HCT, hematocrit; HGB, hemoglobin; MCV, mean corpuscular volume; RBC, red blood cells; RDW, red blood cell distribution width. n = 5-8 mice per group.
Figure 6.
Figure 6.
Antibodies targeting the N-terminal domain of ERFE increase hepcidin expression and ameliorate anemia in thalassemic mice. Four-week-old male Hbb(th3/+) mice were treated intravenously with 5 mg/kg of IgG2A control antibody, or anti-ERFE 15.1, twice a week for 8 weeks. After 8 weeks of treatment, mice were killed for analysis of liver hepcidin messenger RNA expression (A), liver non-heme iron (B), Hamp to liver non-heme iron content (liver iron content [LIC]) ratio (C), serum iron (D), spleen non-heme iron (E), spleen to body weight (F), and blood parameters (G). *P < .05; **P < .01; ***P < .001 using the Mann-Whitney U test. HCT, hematocrit; HGB, hemoglobin; RBC, red blood cells. n = 6, IgG2A group; n = 9, the 15.1 group.

Comment in

References

    1. Rachmilewitz EA, Giardina PJ. How I treat thalassemia. Blood. 2011;118(13):3479-3488. - PubMed
    1. Taher AT, Weatherall DJ, Cappellini MD. Thalassaemia. Lancet. 2018;391(10116):155-167. - PubMed
    1. Flint J, Harding RM, Boyce AJ, Clegg JB. The population genetics of the haemoglobinopathies. Baillieres Clin Haematol. 1998;11(1):1-51. - PubMed
    1. Musallam KM, Taher AT, Rachmilewitz EA. β-thalassemia intermedia: a clinical perspective. Cold Spring Harb Perspect Med. 2012;2(7):a013482. - PMC - PubMed
    1. Tantiworawit A, Charoenkwan P, Hantrakool S, Choeyprasert W, Sivasomboon C, Sanguansermsri T. Iron overload in non-transfusion-dependent thalassemia: association with genotype and clinical risk factors. Int J Hematol. 2016;103(6):643-648. - PubMed

Publication types