. 2020 Jan 3;17(1):4.
doi: 10.1186/s12974-019-1653-7.

Short-term resistance exercise inhibits neuroinflammation and attenuates neuropathological changes in 3xTg Alzheimer's disease mice

Affiliations

Short-term resistance exercise inhibits neuroinflammation and attenuates neuropathological changes in 3xTg Alzheimer's disease mice

Yan Liu et al. J Neuroinflammation. .

Abstract

Background: Both human and animal studies have shown beneficial effects of physical exercise on brain health but most tend to be based on aerobic rather than resistance type regimes. Resistance exercise has the advantage of improving both muscular and cardiovascular function, both of which can benefit the frail and the elderly. However, the neuroprotective effects of resistance training in cognitive impairment are not well characterized.

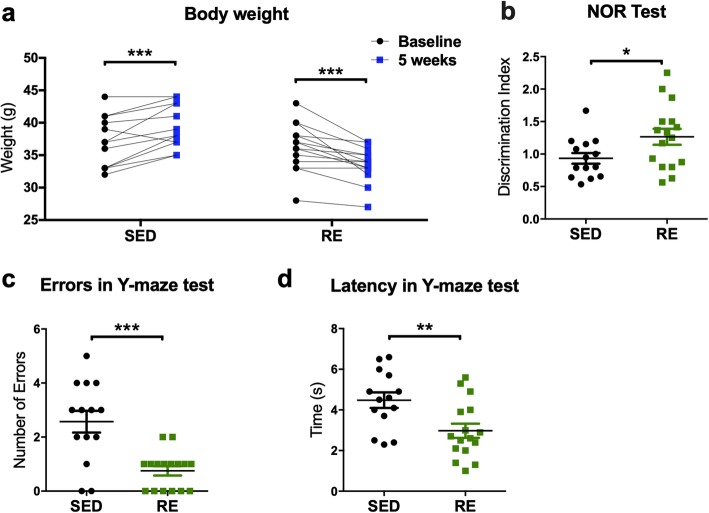
Methods: We evaluated whether short-term resistant training could improve cognitive function and pathological changes in mice with pre-existing cognitive impairment. Nine-month-old 3xTg mouse underwent a resistance training protocol of climbing up a 1-m ladder with a progressively heavier weight loading.

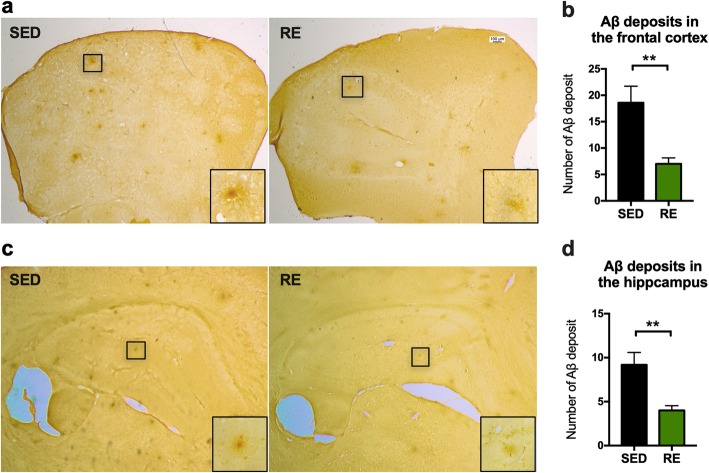
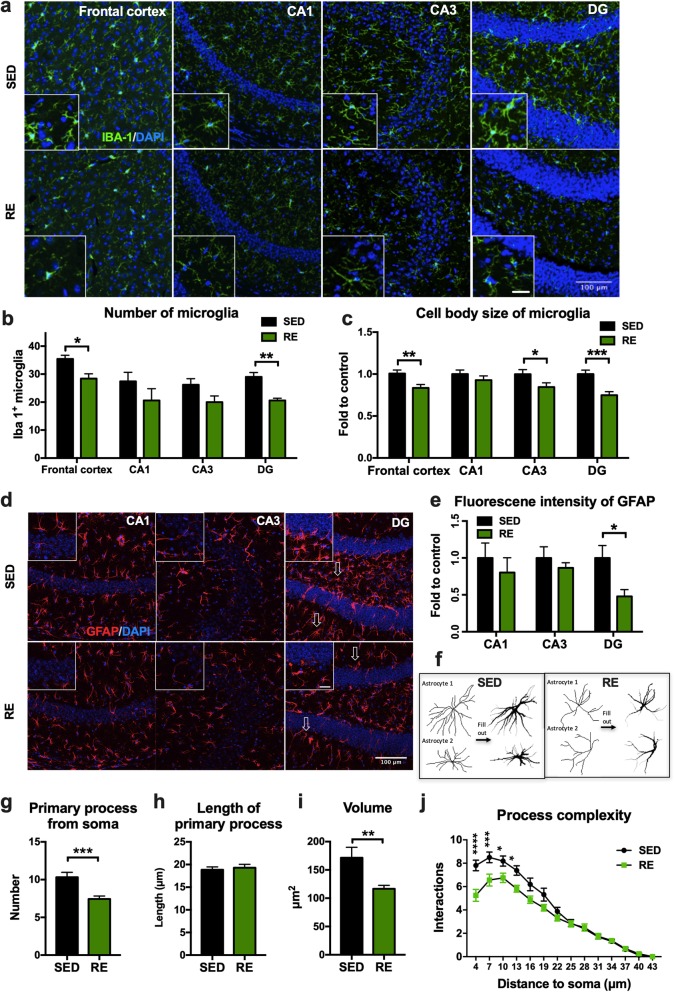
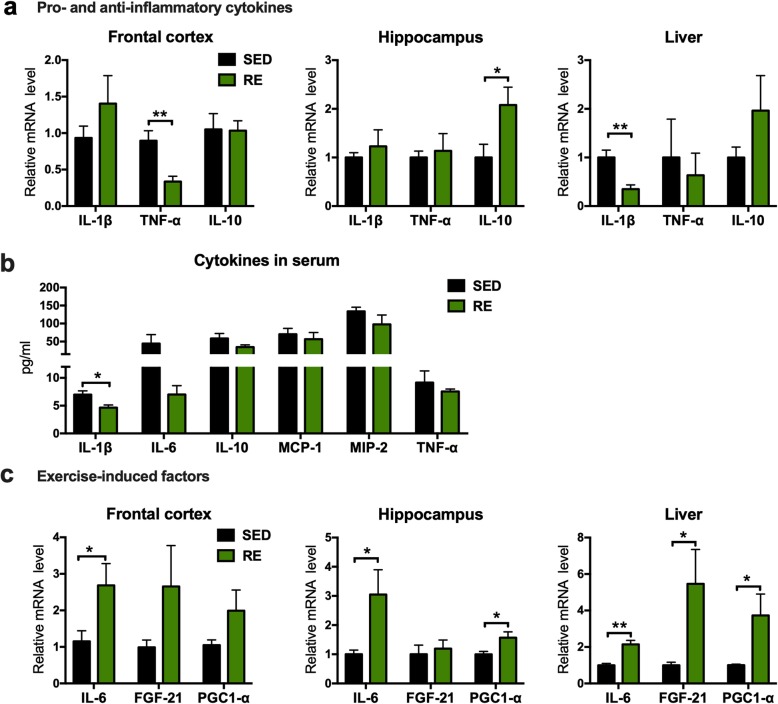
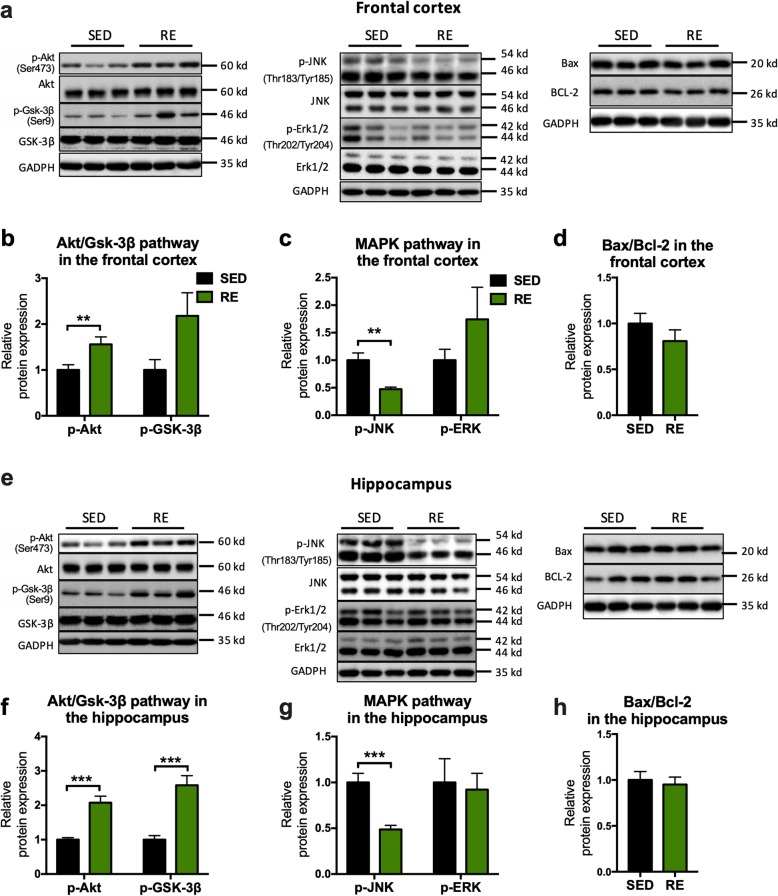
Results: Compared with sedentary counterparts, resistance training improved cognitive performance and reduced neuropathological and neuroinflammatory changes in the frontal cortex and hippocampus of mice. In line with these results, inhibition of pro-inflammatory intracellular pathways was also demonstrated.

Conclusions: Short-term resistance training improved cognitive function in 3xTg mice, and conferred beneficial effects on neuroinflammation, amyloid and tau pathology, as well as synaptic plasticity. Resistance training may represent an alternative exercise strategy for delaying disease progression in Alzheimer's disease.

Keywords: Alzheimer’s disease; Amyloid; Cytokines; Neuroinflammation; Resistance exercise; Synapse; Tau.


Conflict of interest statement

The authors declare that they have no competing interests.

Figures

Fig. 1
Fig. 1
Experimental design, cognitive testing, and food and water intake. a A diagram of the apparatus of resistance exercise training. b The experimental design for resistance training and cognitive testing. c, d Food and water intake of mice. Food and water intake were measured on the first 48 h of each week. The data represented the average food/water intake of mice (normalized to the body weight) from five different cages in the exercise and sedentary groups, respectively. (two-way ANOVA, repeated measure; Bonferroni test was used for post-hoc comparisons. n = 5). ei Performance in the open field test. (unpaired Student’s t test, n = 7 for the SED group and 8 for RE group, respectively). Data present as mean ± SEM, SED sedentary, RE resistance exercise
Fig. 2
Fig. 2
Effects of resistance exercise on body weight and cognitive performance. a Body weight of mice. (paired Student’s t test, n = 7 for SED group and 8 for RE group, respectively; compared to baseline). b Performance in the NOR test as assessed by the discrimination index. (unpaired Student’s t test, n = 14 for SED group and 16 for RE group, respectively). c, d Y-maze training and test were performed before and at the end resistance exercise training respectively. Cognitive performance was assessed by the number of error and escape latency. (unpaired Student’s t test, n = 14 for SED group and 16 for RE group, respectively). *p < 0.05, **p < 0.01, ***p < 0.001, data present as mean ± SEM. SED sedentary, RE resistance exercise
Fig. 3
Fig. 3
Effects of resistance exercise on expression of synaptic proteins. a Representative blots of Synapsin I, PSD95, Synaptotagmin 1, and Synaptobrevin 1 for frontal cortex (left) and hippocampus (right). b, c The analysis of protein expression in the frontal cortex and hippocampus. Band intensity was normalized to that of GAPDH. (unpaired Student’s t tests, compared to sedentary mice. n = 5 for SED group and n = 6 for RE group, respectively. *p < 0.05, **p < 0.01, data present as mean ± SEM). SED sedentary, RE resistance exercise
Fig. 4
Fig. 4
Immunochemical staining of amyloid plaques. a, c Representative images of of amyloid plaques with a plaque-specific antibody (4G8) in the frontal cortex and the hippocampus. Zoomed-in image demonstrating typical morphology of amyloid deposit were presented in the bottom right corner of each image. Scale bar: 100 μm. b, d The number of amyloid plaques was analyzed using ImageJ. (unpaired Student’s t tests, compared to sedentary mice, *p < 0.05, **p < 0.01. n = 5, data present as mean ± SEM). SED sedentary, RE resistance exercise
Fig. 5
Fig. 5
Effects of resistance exercise on tau phosphorylation. a, c Representative blots of tau protein in the brain. b, d The analysis of protein expression with the band intensity normalized to that of GAPDH. AT180 was the antibody used to detect tau phosphorylated at residue Thr231. (unpaired Student’s t tests, compared to sedentary mice, *p < 0.05, **p < 0.01. n = 6, data present as mean ± SEM). SED sedentary, RE resistance exercise
Fig. 6
Fig. 6
Effects of resistance exercise on microglial activation. a Representative confocal photographs taken with a × 20 objective lens showing the Iba-1-positive microglia (green) and DAPI (blue) in the frontal cortex and different sub-regions of hippocampus. Scale bar: 100 μm (for zoomed in images, scale bar = 20 μm). The number of microglia in each brain region was measured using ImageJ. b Cell count of Iba-1-positive microglia in the frontal cortex and different sub-regions of the hippocampus. c Cell body size of microglia in the frontal cortex and different subregions of the hippocampus. For each mouse, data represent the mean value of three brain slices. d Representative confocal photographs taken with a × 20 objective lens showing the GFAP positive astrocyte (red) and DAPI (blue) in the different sub-regions of hippocampus. Scale bar: 100 μm. e Quantification of immunofluorescent intensity of the GFAP signal. f Morphological analysis of astrocytes, the representative picture showing the morphological feactures of astrocytes that were marked with arrows in picture d. gj The result of morphological analysis of astrocyte in DG region. (unpaired Student’s t test, *p < 0.05, **p < 0.01, ***p < 0.001, compared to sedentary mice. n = 5 and 4 for IBA-1 and GFAP staining, respectively. Data presented as mean ± SEM. SED sedentary, RE resistance exercise
Fig. 7
Fig. 7
Inflammatory and exercise induced factors following resistance exercise. a Relative mRNA levels for various inflammatory cytokines in the brain and liver. b Protein levels of various inflammatory cytokines in the serum. c Relative mRNA levels for exercise induced factors in the brain and liver (unpaired Student’s t test, *p < 0.05, **p < 0.01, compared to sedentary mice. n = 5 for RT-PCR and 6 for Milliplex assay, data present as mean ± SEM). SED sedentary, RE resistance exercise
Fig. 8
Fig. 8
Modulation of intracellular signaling pathways after resistance exercise. a, e Representative blots of Akt, JNK, ERK, and Bax/Bcl-2 in the frontal cortex and hippocampus. bd The analysis of protein expression in the frontal cortex. fh The analysis of protein expression in the hippocampus. Band intensity was normalized to that of GAPDH. For Akt, GSK-3β, JNK, and ERK, the phosphorylated forms were normalized to their total forms. (unpaired Student’s t tests, n = 6, *p < 0.05, **p < 0.01, compared to sedentary mice. Data present as mean ± SEM). SED sedentary, RE resistance exercise

References

    1. Mirra SS, Heyman A, McKeel D, Sumi S, Crain BJ, Brownlee L, et al. The Consortium to Establish a Registry for Alzheimer's Disease (CERAD) Part II. Standardization of the neuropathologic assessment of Alzheimer's disease. Neurology. 1991;41:479. doi: 10.1212/WNL.41.4.479. - DOI - PubMed
    1. Heneka MT, Carson MJ, El Khoury J, Landreth GE, Brosseron F, Feinstein DL, et al. Neuroinflammation in Alzheimer's disease. The Lancet Neurol. 2015;14:388–405. doi: 10.1016/S1474-4422(15)70016-5. - DOI - PMC - PubMed
    1. Walker D, Kim S, McGeer P. Complement and cytokine gene expression in cultured microglia derived from postmortem human brains. J Neurosci Res. 1995;40:478–493. doi: 10.1002/jnr.490400407. - DOI - PubMed
    1. Hopperton KE, Mohammad D, Trepanier MO, Giuliano V, Bazinet RP. Markers of microglia in post-mortem brain samples from patients with Alzheimer's disease: a systematic review. Mol Psychiatry. 2018;23:177–198. doi: 10.1038/mp.2017.246. - DOI - PMC - PubMed
    1. Streit WJ, Mrak RE, Griffin WST. Microglia and neuroinflammation: a pathological perspective. J Neuroinflammation. 2004;1:14. doi: 10.1186/1742-2094-1-14. - DOI - PMC - PubMed

MeSH terms

Substances