. 2020 Mar 1;80(5):1024-1035.
doi: 10.1158/0008-5472.CAN-19-2560. Epub 2020 Jan 3.

Epigenetic Targeting of TERT-Associated Gene Expression Signature in Human Neuroblastoma with TERT Overexpression

Affiliations

Epigenetic Targeting of TERT-Associated Gene Expression Signature in Human Neuroblastoma with TERT Overexpression

Min Huang et al. Cancer Res. .

Abstract

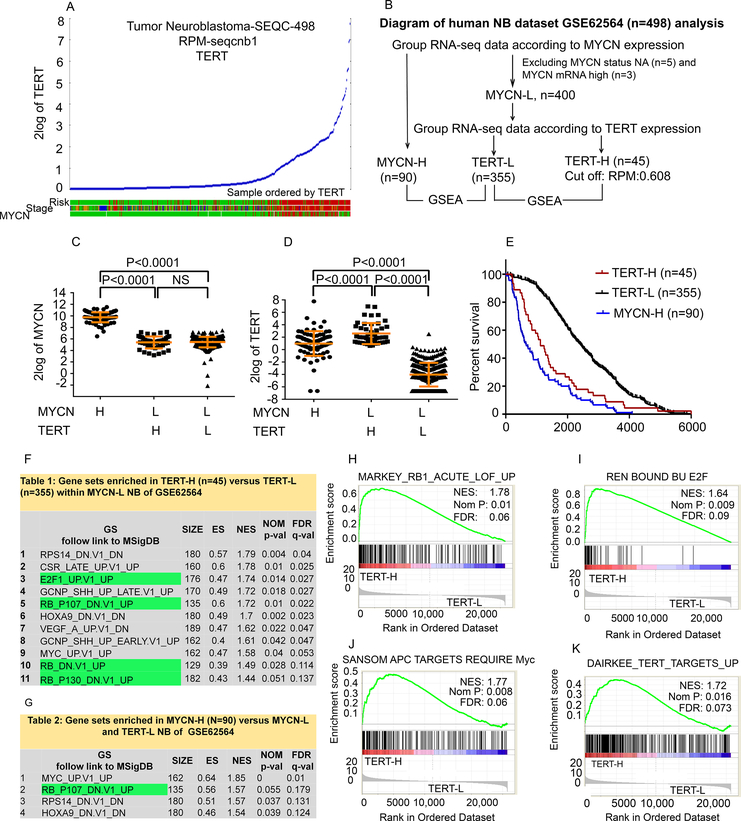
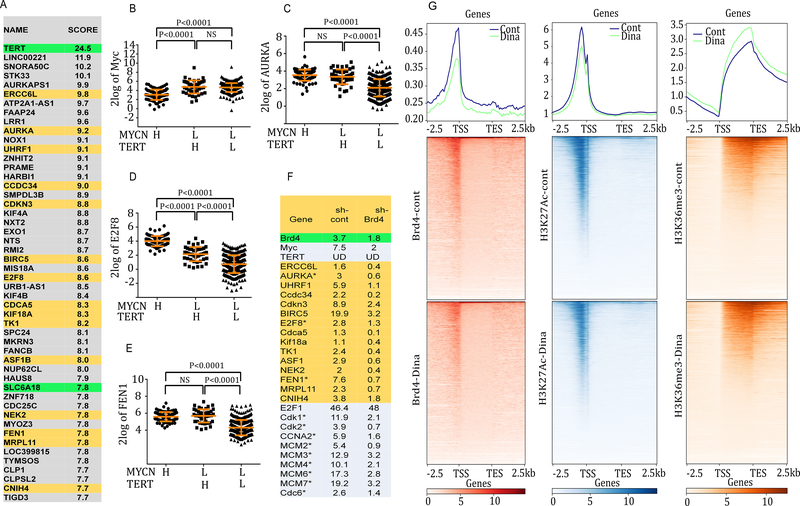
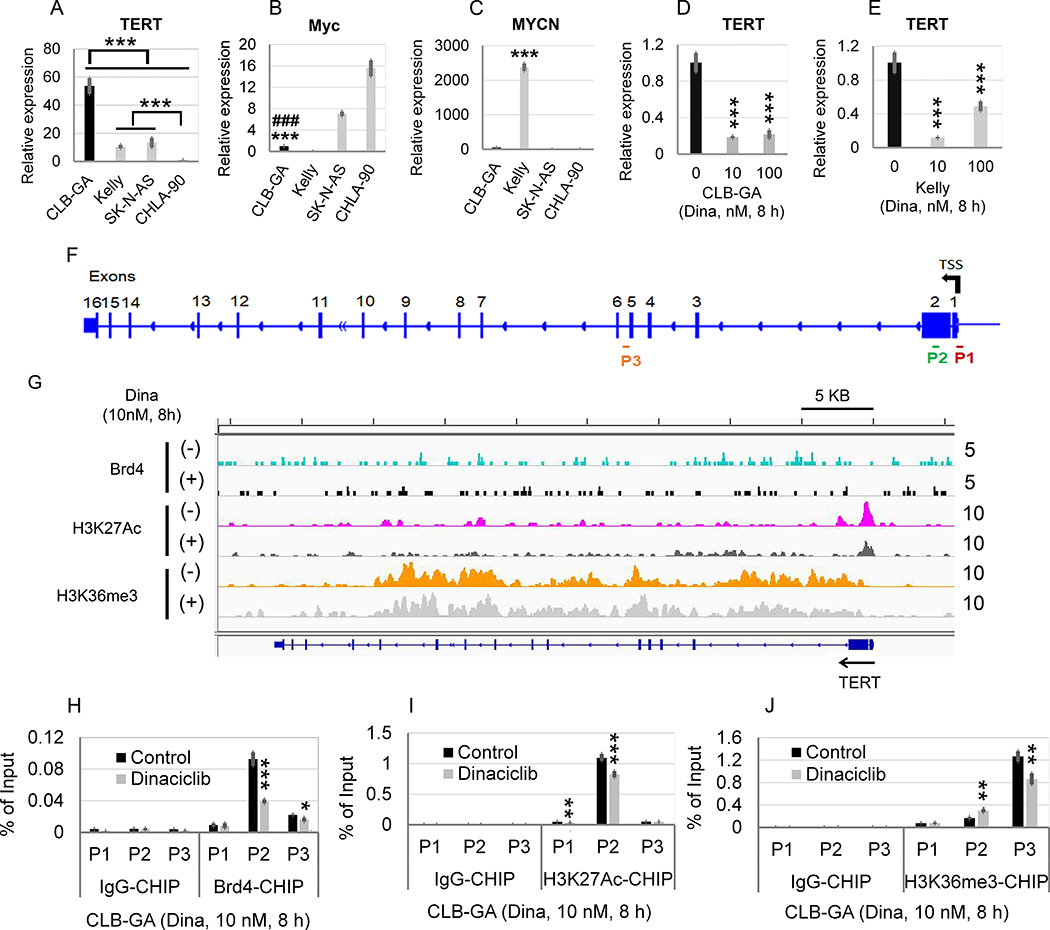
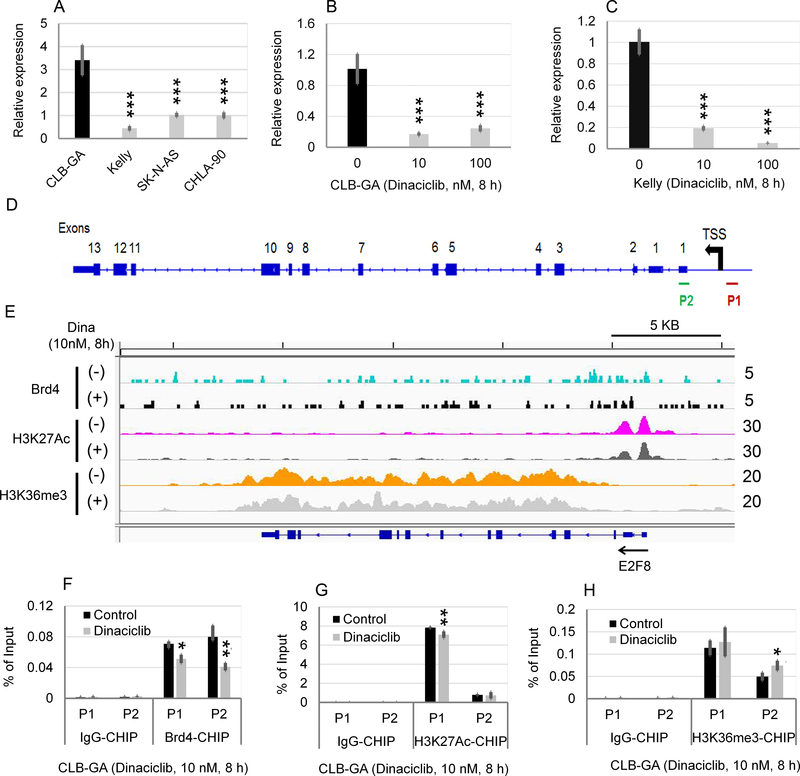
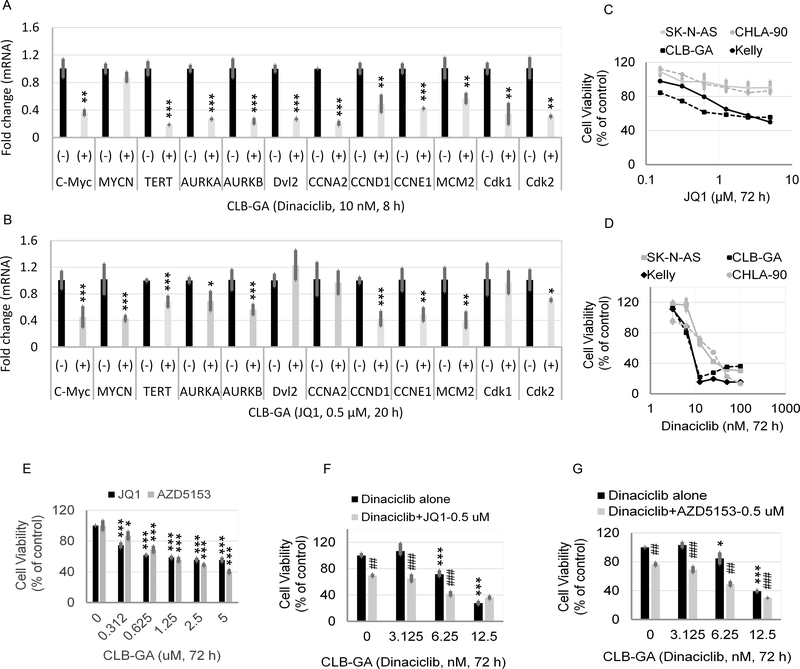
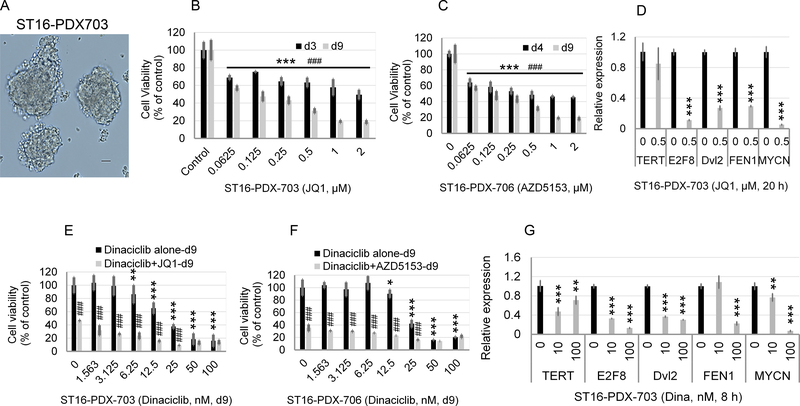
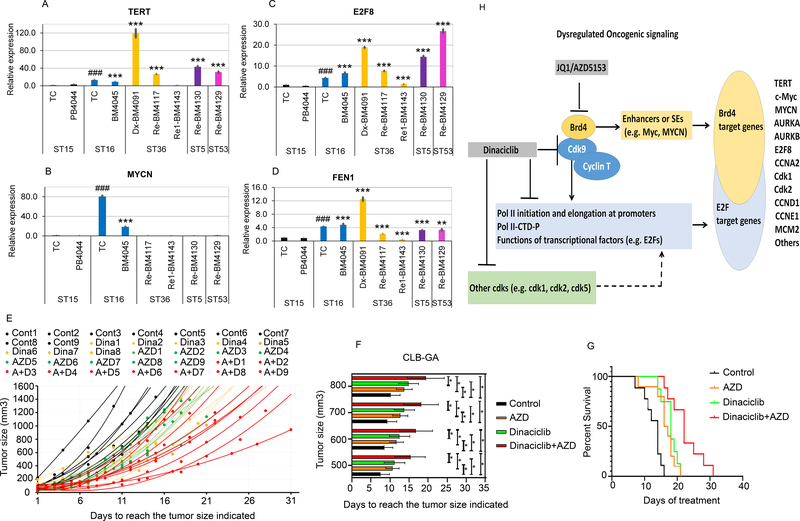
Neuroblastoma is a deadly pediatric solid tumor with infrequent recurrent somatic mutations. Particularly, the pathophysiology of tumors without MYCN amplification remains poorly defined. Utilizing an unbiased approach, we performed gene set enrichment analysis of RNA-sequencing data from 498 patients with neuroblastoma and revealed a differentially overexpressed gene signature in MYCN nonamplified neuroblastomas with telomerase reverse transcriptase (TERT) gene overexpression and coordinated activation of oncogenic signaling pathways, including E2Fs, Wnt, Myc, and the DNA repair pathway. Promoter rearrangement of the TERT gene juxtaposes the coding sequence to strong enhancer elements, leading to TERT overexpression and poor prognosis in neuroblastoma, but TERT-associated oncogenic signaling remains unclear. ChIP-seq analysis of the human CLB-GA neuroblastoma cells harboring TERT rearrangement uncovered genome-wide chromatin co-occupancy of Brd4 and H3K27Ac and robust enrichment of H3K36me3 in TERT and multiple TERT-associated genes. Brd4 and cyclin-dependent kinases (CDK) had critical regulatory roles in the expression and chromatin activation of TERT and multiple TERT-associated genes. Epigenetically targeting Brd4 or CDKs with their respective inhibitors suppressed the expression of TERT and multiple TERT-associated genes in neuroblastoma with TERT overexpression or MYCN amplification. ChIP-seq and ChIP-qPCR provided evidence that the CDK inhibitor directly inhibited Brd4 recruitment to activate chromatin globally. Therefore, inhibiting Brd4 and CDK concurrently with AZD5153 and dinaciclib would be most effective in tumor growth suppression, which we demonstrated in neuroblastoma cell lines, primary human cells, and xenografts. In summary, we describe a unique mechanism in neuroblastoma with TERT overexpression and an epigenetically targeted novel therapeutic strategy. SIGNIFICANCE: Epigenetically cotargeting Brd4 and Cdks suppresses human neuroblastoma with TERT overexpression by inhibiting the TERT-associated gene expression networks.


Conflict of interest statement

The authors declare no potential conflicts of interest.

Figures

Fig. 1.
Fig. 1.. TERT mRNA expression and identification of top enriched pathways in TERT-H NB.
(A) High TERT mRNA expression was associated with high-risk and high-stage NB as analyzed with R2 using GSE62564 dataset consisting of 498 human NB patient samples. High-Risk and stage 4 (red), Stage 4 (red), MYCN amplified (red), MYCN non-amplified (green). (B) RNA-seq results from 490 NB patients within the GSE62564 dataset were assigned into three subgroups: MYCN-H, TERT-H (MYCN-L), and TERT-L (MYCN-L). (C, D) Dot plots showing mRNA expression levels of MYCN and TERT in the three subgroups. Each dot represents a value from an individual patient. (E) Comparison of the overall survival among the three subgroups. (F, G) The top enriched pathways in TERT-H and MYCN-H subgroups; (H-K) Representative enrichment plots for selected genes sets differentially expressed in the TERT-H (MYCN-L) compared to TERT-L (MYCN-L) are presented. On the x-axis are genes ranked according to their expression, starting with the up-regulated genes on the left and all the way down to the downregulated genes on the far right. NES: normalized enrichment score. Nom P: normalized p value; FDR: false discovery rate. (H) Genes up-regulated in adult fibroblasts with inactivated RB1 by Cre-lox: acute loss of function (LOF) of RB1; (I) Genes whose promoters were bound by E2F1 and E2F4 in the primary fibroblasts WI-38, by ChIP on chip assay; (J) Genes up-regulated after Cre-lox knockout of APC in the small intestine that require functional MYC; (K) Genes up-regulated in non-spontaneously immortalizing (NSI) primary breast cancer tumor cultures upon expression of TERT off a retroviral vector.
Fig. 2.
Fig. 2.. Identification of potential Brd4 target genes within the top 50 up-regulated genes in TERT-H subgroup of NB and effects of dinaciclib on genome-wide chromatin occupancy of epigenetic modulators in CLB-GA cells with known TERT gene rearrangement.
(A) Top 50 differentially up-regulated genes in TERT-H (n=45) versus TERT-L subgroup (n=355) within MYCN-L of GSE62564 dataset by GSEA. (B, C, D, E) Comparison of gene expression profiles of Myc, AURKA, E2F8, and FEN1 among MYCN-H, TERT-H (MYCN-L), and TERT-L (MYCN-L) subgroup of GSE62564 dataset. Each dot represents a value from an individual patient. (F) Gene expression changes analyzed by RNA-seq. Effects of Brd4 shRNA on the expression of TERT-associated genes and E2F target genes in Brd4 active MLL-AF9 AML cells. Known E2F target genes are labelled with an asterisk (*). Data were extracted from microarray analysis of murine leukemia cells expressing MLL-AF9 fusion with or without Brd4 shRNA (15). (G) Effects of dinaciclib on genome-wide chromatin occupancy of Brd4, H3K27Ac, and H3K36me3 in CLB-GA cells. Cells were treated in the absence or presence of 10 nM dinaciclib for 8 h, followed by Brd4-, H3K27Ac-, and H3K36me3-ChIP-seq. The binding profiles were plotted using computeMatrix in scale-region mode, and each gene body was shrunken to the same length as 2500 bp. Sequences up to 2.5 kb upstream of the TSS and 2.5 kb downstream of the 3’ gene end were shown. Average occupation for each 100 bin region is indicated. The top panel histograms show the average genome-wide occupancies in the presence or absence of dinaciclib for Brd4, H3K27Ac, and H3K36me3. The lower panels of density heat maps show genome-wide chromatin occupancy by Brd4, H3K27Ac, and H3K36me3 at the TSS, the transcriptional end site (TES), and gene scaled gene body region and effects of dinaciclib.
Fig. 3.
Fig. 3.. Effects of dinaciclib on the TERT mRNA expression and chromatin occupancy of epigenetic modulators in CLB-GA.
(A, B, C) Comparison of mRNA expression of TERT, Myc, and MYCN in human NB cell lines CLB-GA, Kelly, SK-N-AS, and CHLA-90. (D, E) Effects of dinaciclib on the mRNA expression of TERT in CLB-GA and Kelly cells. Cells were untreated or treated with dinaciclib at 10 nM and 100 nM for 8 h, followed by RT-qPCR analysis. The relative levels of TERT mRNA expression were normalized to the GAPDH level in D and E and expressed as fold changes relative to control (set at 1). The mean ± SD of four replicates is shown. (F) Diagram of TERT gene body and promoter. The locations of CHIP-qPCR primer sets for TERT are shown. P1: TERT promoter (−13 to +121 bp relative to TSS); P2: TERT promoter (389 to 531 bp relative to TSS, on exon 2; P3: 53 bp relative to the last amino acid of TERT exon 5 (TERT gene body). (G) Effects of dinaciclib on binding of Brd4, H3K27Ac, and H3K36me3 to the promoters or enhancers of TERT gene. CLB-GA cells were treated in the absence or presence of 10 nM dinaciclib for 8 h, followed by Brd4-, H3K27Ac, and H3K36me3-ChIP-seq, as described in the Materials and Methods. IGV visualization of ChIP-seq peaks at the TERT loci. The selected region spans the whole gene body of TERT as shown at the bottom and the calculated ChIP-seq enrichment values are indicated on the right. (H, I, J) Effect of dinaciclib on TERT promoter binding by Brd4 (H), H3K27Ac (I), and HK36me3 (J), as assessed by ChIP-qPCR.
Fig. 4.
Fig. 4.. Effects of dinaciclib on the E2F8 mRNA expression and chromatin occupancy of epigenetic modulators in CLB-GA with known TERT chromosomal translocation.
(A) Comparison of E2F8 expression in four human NB cell lines. Fold changes in the TERT expression was shown in CLB-GA, Kelly, and SK-N-AS cell line in relation to that in CHLA-90. (B, C) Effects of Dinaciclib on the mRNA expression of E2F8 in CLB-GA and Kelly cells. Cells were untreated or treated with Dinaciclib at 10 nM and 100 nM for 8 h, followed by q-PCR analysis. The relative levels of E2F8 mRNA expression in A, B, and C were normalized to the GAPDH, and expressed as fold changes relative to (A) CHLA-90 and (B, C) control (set at 1). The mean ± SD of four replicates is shown. (D) Diagram of E2F8 gene body and promoter. The locations of ChIP-qPCR primer sets for TERT were shown. P1: E2F8 promoter (−158 to 42 bp relative to TSS of E2F8); P2: E2F8 promoter (573 to 822 bp relative to TSS of E2F8). (E) Effects of Dinaciclib on binding of Brd4, H3K27Ac, and H3K36me3 to the promoters or enhancers of E2F8 gene. CLB-GA cells were treated in the absence or presence of 10 nM Dinaciclib for 8 h, followed by Brd4-, H3K27Ac, and H3K36me3-ChIP-seq. Genome browser (hg38) views of ChIP-seq peaks at the following loci. The location of each gene is shown at the bottom of the panels and the calculated ChIP-seq enrichment values are indicated on the right. (F, G, H) Effect of Dinaciclib on E2F8 promoter binding by Brd4 (F), H3K27Ac (G), and HK36me3 (H), as assessed by ChIP-qPCR.
Fig. 5.
Fig. 5.. JQ1 sensitive Brd4 binding profiles and effects of BET inhibitor or/and dinaciclib on CLB-GA cells.
(A, B) Effects of dinaciclib and JQ1 on the mRNA expression of genes shown in CLB-GA cells. Cells were untreated or treated with 10 nM dinaciclib or 0.5 μM JQ1 for 8 or 20 h, respectively, followed by RT-qPCR analysis. The relative levels of mRNA expression were normalized to the GAPDH level and were expressed as fold changes relative to control (set at 1). (C, D, E) Effects of JQ1, dinaciclib, or AZD5153 on the cytotoxicity of human NB cell lines. Cells were treated with JQ1 (C, E), dinaciclib (D), or AZD5153 (E) at the indicated concentrations for 72 h, followed by MTS assay. (F, G) Additive or synergistic effects of JQ1/AZD5153 in combination with dinaciclib. CLB-GA cells were treated with JQ1, AZD5153, or dinaciclib alone or combination at the indicated concentrations for 72 h, followed by MTS assay. Asterisk or hash is in relation to control or dinaciclib treatment alone, respectively.
Fig. 6.
Fig. 6.. Effects of BET inhibitors or dinaciclib treatment alone or in combination on the growth of human primary NB cells.
(A) Sphere growth of in vitro cultured NB cells isolated from patient-derived xenograft (PDX) generated using un-cultured human NB tumor cells. (B, C) Primary NB cells were treated with JQ1 or AZD5153 at the indicated concentrations and times, followed by MTS assay. Bar graphs represent mean values ± SD of 4 biological replicates. (D, G) Effects of JQ1 on the mRNA expression of genes shown. Primary NB cells were untreated or treated with JQ1 at 0.5 μM for 20 h, followed by RT-qPCR analysis. The relative levels of mRNA expression were normalized to the GAPDH level and were expressed as fold changes relative to control (set at 1). (E, F) Effects of JQ1, AZD5153, or dinaciclib alone or in combination on the cytotoxicity of human primary NB cells. Cells were treated with either dinaciclib alone at indicated concentrations or JQ1 or AZD5153 alone at 0.5 μM or in combination for 9 days, followed by MTS colorimetric assay of cell viability.
Fig. 7.
Fig. 7.. Comparison of TERT, E2F8, FEN1, and MYCN expression in human primary NB cells and effects of either dinaciclib or AZD5153 alone or in combination on the CLB-GA orthotopic xenograft growth in vivo.
(A, B, C, D) The mRNA expression of TERT, E2F8, Dvl2, FEN1, and MYCN in human primary NB cells was compared after isolation from primary tumor tissue (TC) or bone marrow (BM), followed by q-PCR analysis. The relative levels of mRNA expression were calculated using the 2−ΔΔCt method after normalization to the GAPDH level and were expressed as fold changes relative to a NB tumor without MYCN amplification (ST15) (set at 1). Asterisk or Hash is in relation to isolated ST15-TC or ST15-BM, respectively. MYCN (+): ST16; MYCN (−): ST15, ST36, and ST5. ST15, ST16, and ST36 Dx-BM4091 were collected at diagnosis. ST36 Re-BM4117 and ST5 BM4130 were collected at refractory disease. ST36 Re1-BM4143 was collected after the refractory tumor was treated. (E) Tumor volume scatter plots of orthotopic CLB-GA xenograft in athymic nude mice. X-axis shows the days after injection of CLB-GA cells. Y-axis shows the tumor size. The dots or curves of best fit with the associated equation were plotted to show individual tumor size of each animal in each group. (F) The bar graph presents the average tumor size. X-axis shows the days after injection of CLB-GA cells. Y-axis shows the average tumor size ± SD of each of the four groups. (G) Survival curve analysis shows the probability of mouse overall survival. Two-sided log-rank test was used to generate the p-value. P <0.001: AZD or dinaciclib versus the vehicle control; AZD+dinaciclib versus with either alone. (H) Proposed working model of regulatory pathways and mechanism of action for BET inhibitors and dinaciclib in human NB with TERT overexpression.

References

    1. Matthay KK, Maris JM, Schleiermacher G, Nakagawara A, Mackall CL, Diller L, et al. Neuroblastoma. Nat Rev Dis Primers 2016, 2:16078. - PubMed
    1. Trigg RM, Turner SD. ALK in Neuroblastoma: Biological and Therapeutic Implications. Cancers (Basel) 2018;10(4): E113. - PMC - PubMed
    1. Peifer M, Hertwig F, Roels F, Dreidax D, Gartlgruber M, Menon R, et al. Telomerase activation by genomic rearrangements in high-risk neuroblastoma. Nature 2015, 526(7575):700–704. - PMC - PubMed
    1. Valentijn LJ, Koster J, Zwijnenburg DA, Hasselt NE, van Sluis P, Volckmann R, et al. TERT rearrangements are frequent in neuroblastoma and identify aggressive tumors. Nat Genet 2015, 47(12):1411–1414. - PubMed
    1. Sengupta S, George RE. Super-Enhancer-Driven Transcriptional Dependencies in Cancer. Trends Cancer 2017;3(4):269–281. - PMC - PubMed

Publication types

MeSH terms