. 2020 Jan 3;11(1):100.
doi: 10.1038/s41467-019-13658-5.

Mapping axon initial segment structure and function by multiplexed proximity biotinylation

Affiliations

Mapping axon initial segment structure and function by multiplexed proximity biotinylation

Hamdan Hamdan et al. Nat Commun. .

Abstract

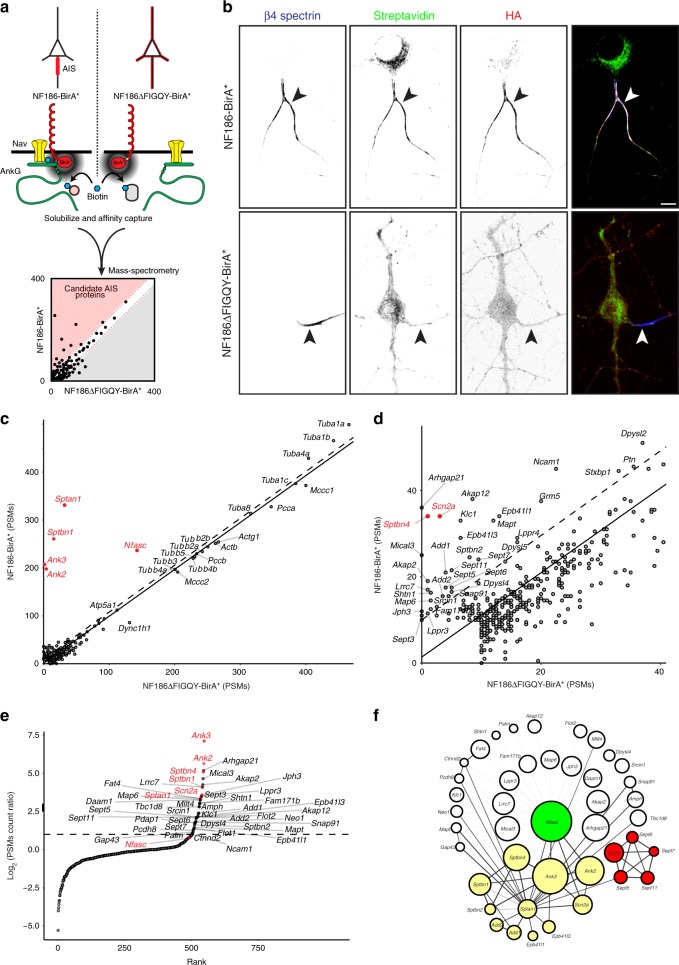
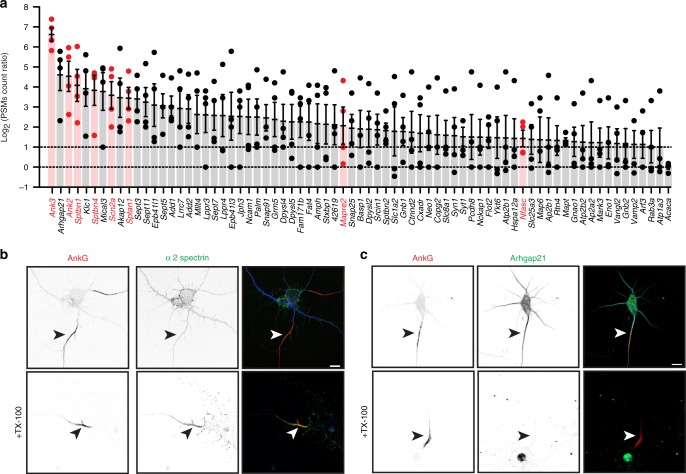
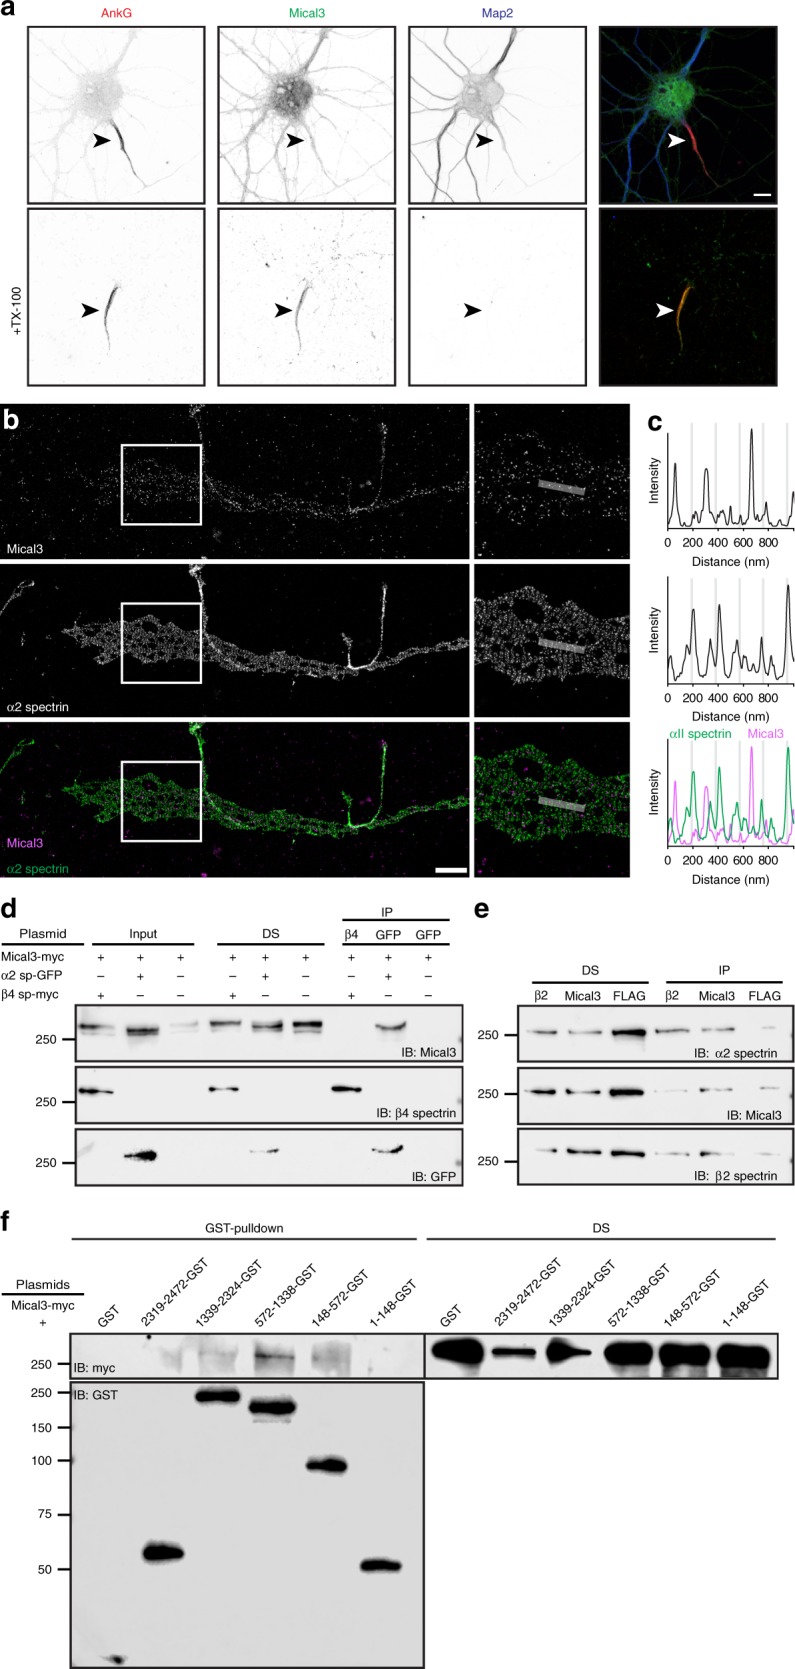
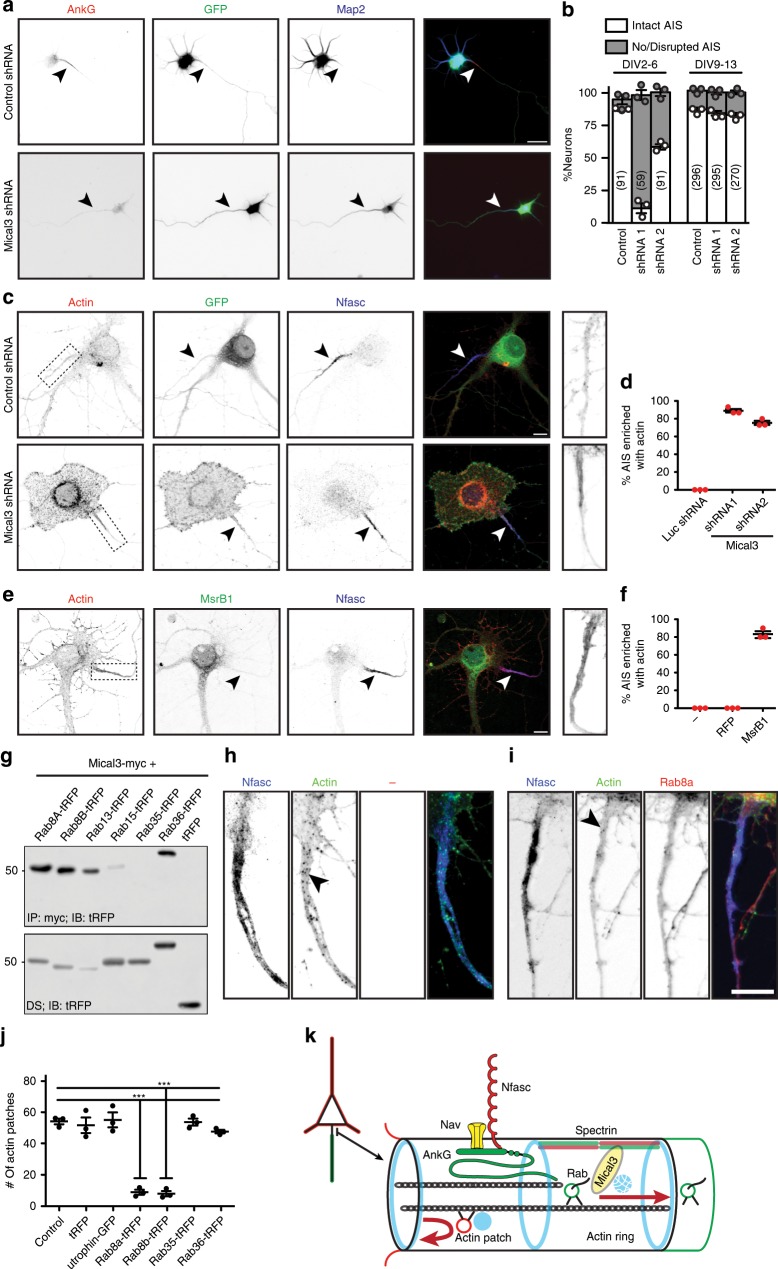
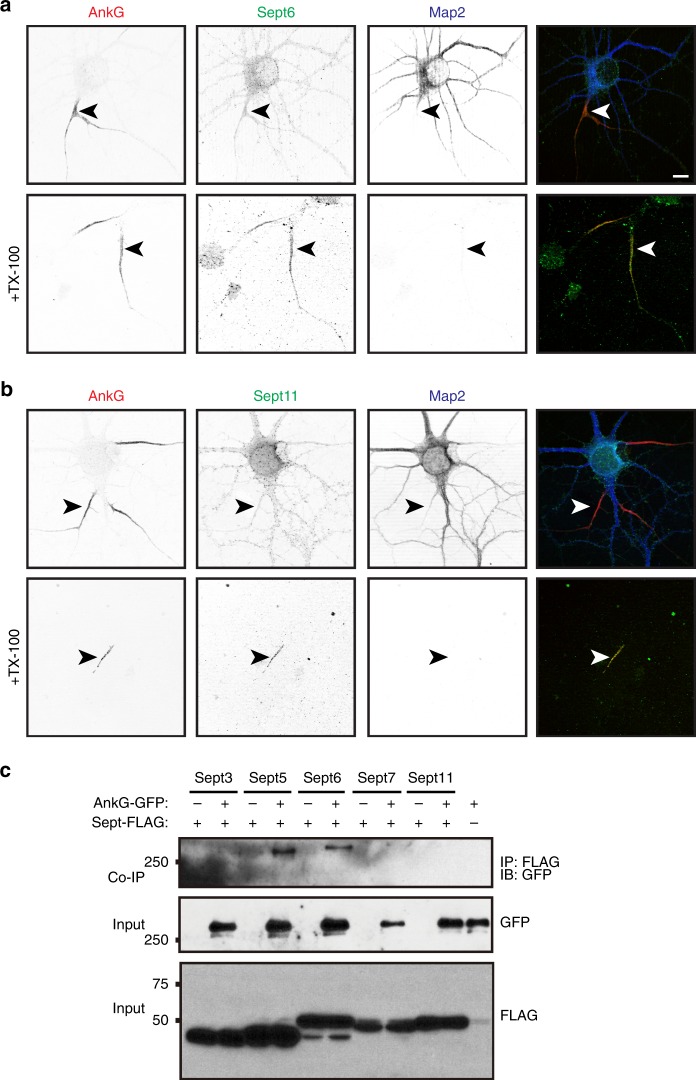
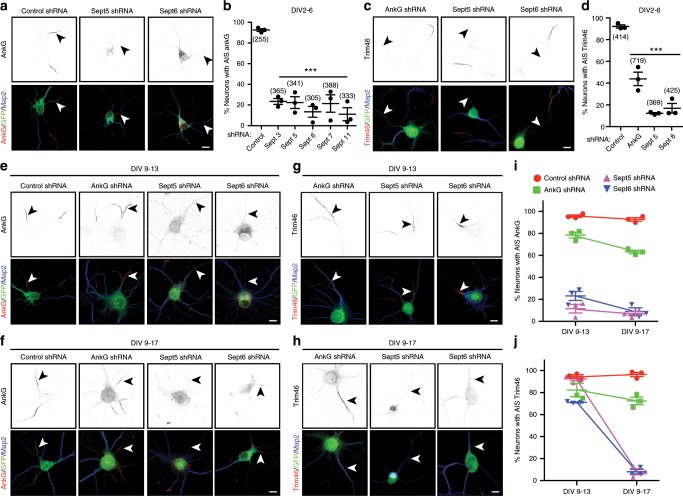
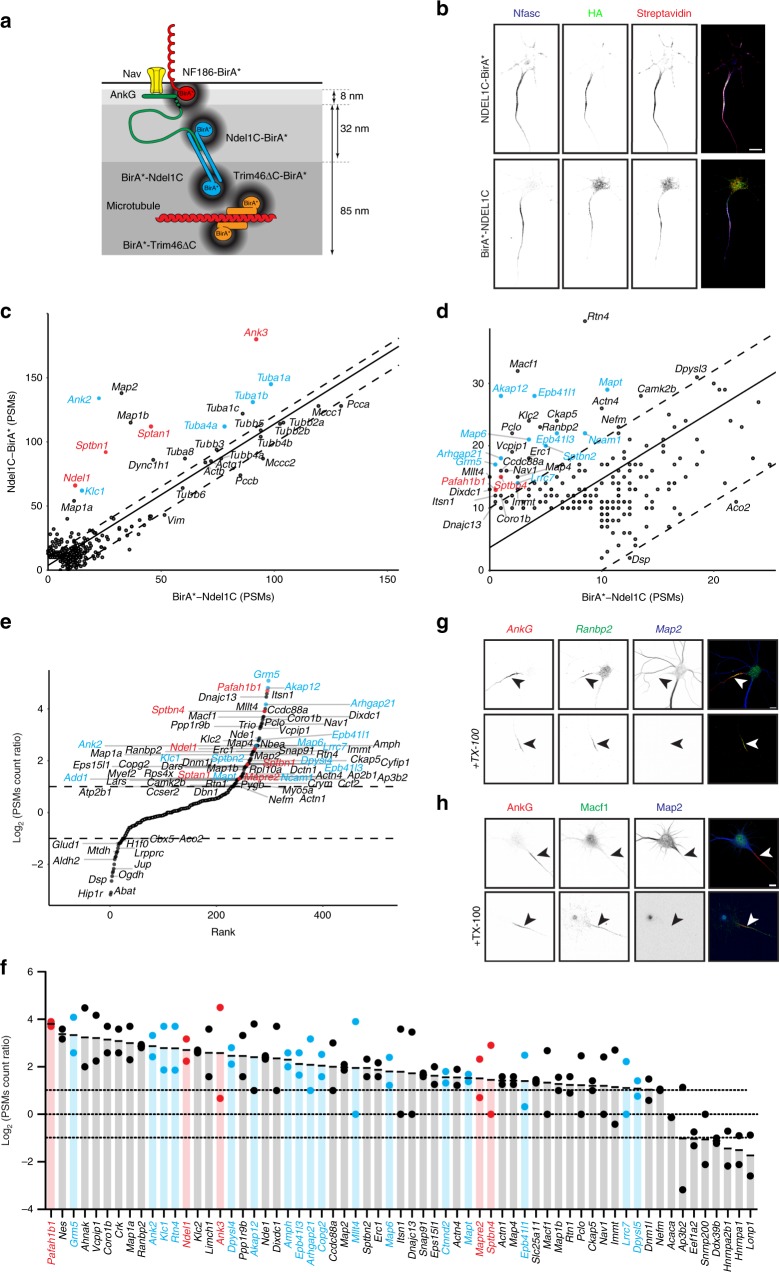
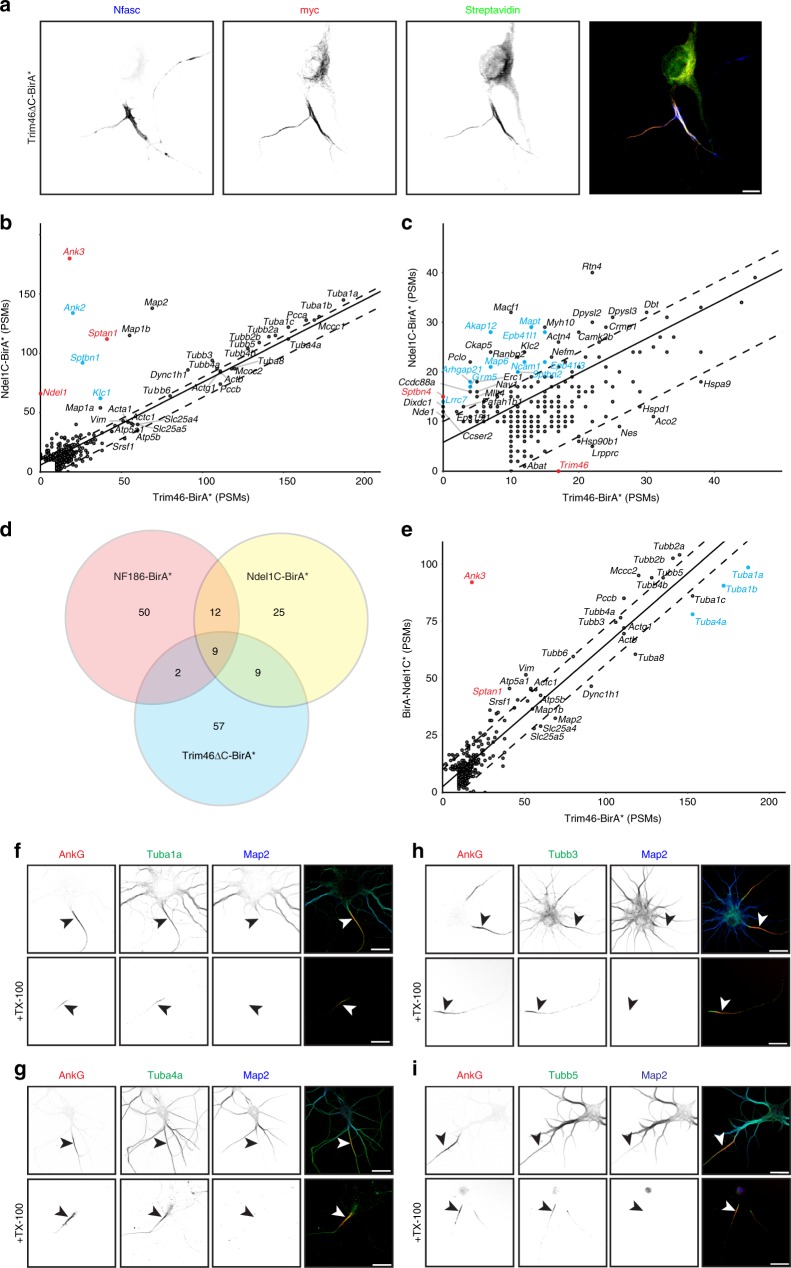
Axon initial segments (AISs) generate action potentials and regulate the polarized distribution of proteins, lipids, and organelles in neurons. While the mechanisms of AIS Na+ and K+ channel clustering are understood, the molecular mechanisms that stabilize the AIS and control neuronal polarity remain obscure. Here, we use proximity biotinylation and mass spectrometry to identify the AIS proteome. We target the biotin-ligase BirA* to the AIS by generating fusion proteins of BirA* with NF186, Ndel1, and Trim46; these chimeras map the molecular organization of AIS intracellular membrane, cytosolic, and microtubule compartments. Our experiments reveal a diverse set of biotinylated proteins not previously reported at the AIS. We show many are located at the AIS, interact with known AIS proteins, and their loss disrupts AIS structure and function. Our results provide conceptual insights and a resource for AIS molecular organization, the mechanisms of AIS stability, and polarized trafficking in neurons.


Conflict of interest statement

The authors declare no competing interests.

Figures

Fig. 1
Fig. 1. Proximity biotinylation using NF186-BirA* reveals AIS-associated proteins.
a The experimental strategy using BirA*-dependent proximity biotinylation to identify AIS proteins. b Immunolabeling of DIV14 hippocampal neurons transduced at DIV11 using adenovirus to express HA-tagged NF186-BirA* and NF186∆FIGQY-BirA*. From DIV13, neuronal culture media included 50 μM biotin. AIS (arrowheads) are labeled using antibodies against β4 spectrin (blue). The NF186-BirA* and NF186∆FIGQY-BirA* chimeras are labeled using anti-HA antibodies (red). Biotinylated proteins were detected using Alexa488-conjugated Streptavidin. Scale bar = 5 μm. c, d The number of peptide spectral matches (PSMs) for each biotinylated protein identified by mass spectrometry and shown at different scales. Known AIS and NF186-interacting proteins are indicated in red. The solid line is the least-squares fit of the biotinylated proteins while the dotted lines parallel to the least-squares fit line represent an arbitrary minimum of ten PSMs confidence interval. PSMs are the average PSM counts for two independent replicates for each chimera. e Rank plot showing the enrichment of NF186-BirA* PSMs over NF186∆FIGQY-BirA* PSMs. f Protein interaction network generated using Cytoscape and the STRING database of protein interactions. With the exception of Nfasc, the size of each circle is proportional to the ratio of the PSMs count for each protein indicated. White circles include proteins with no previously reported function at the AIS. Yellow circles correspond to the ankyrin/spectrin network, and red circles correspond to the septin network.
Fig. 2
Fig. 2. Candidate AIS proteins and their sensitivity to detergent extraction.
a The ratio (Log2) of PSMs in NF186-BirA*-expressing neurons to PSMs in NF186∆FIGQY-BirA*-expressing neurons. Known AIS proteins are shown in red. An endogenously biotinylated carboxylase (Acaca), that is equally biotinylated in both NF186-BirA* expressing neurons and NF186∆FIGQY-BirA* expressing neurons, is shown for reference. Dashed lines at 1 indicate twofold enrichment, or equal levels of biotinylation at 0. n = 4 independent experiments. Error bars, ±SEM. b Immunostaining of DIV14 hippocampal neurons using antibodies against AnkG (red), α2 spectrin (green), and Map2 (blue). The lower panels show the Triton X-100 detergent-resistant pool of α2 spectrin at the AIS. AIS are indicated by arrowheads. Scale bar = 5 μm. c Immunostaining of DIV14 hippocampal neurons using antibodies against AnkG (red), Arhgap21 (green) and Map2 (blue). The lower panels show Arhgap21 is solubilized by Triton X-100. AIS are indicated by arrowheads. Scale bar = 10 μm.
Fig. 3
Fig. 3. A detergent insoluble pool of spectrin-interacting Mical3 is located at the AIS.
a Immunostaining of DIV14 hippocampal neurons using antibodies against AnkG (red), Mical3 (green) and Map2 (blue). The lower panels show the Triton X-100 detergent-resistant pool of Mical3 at the AIS. AIS are indicated by arrowheads. Scale bar = 5 μm. b DNA-PAINT super-resolution imaging of Mical3 (magenta) and α2 spectrin (green). The boxed regions in the left panels are shown magnified in the right panels. Scale bar = 2 μm. c Line scans (gray bars) in the magnified panels in b show the normalized fluorescence intensity. Line scans are specific to these images and are not averages across many cells. d In vitro co-immunoprecipitation shows Mical3 co-immunoprecipitates with α2 spectrin. DS depleted supernatant, IP immunoprecipitation. e α2 spectrin co-immunoprecipitates with Mical3 from mouse brain homogenate. f GST-pull-down experiment between Mical3-myc and GST fusion proteins including the amino acids of α2 spectrin indicated. All molecular weight markers are in kilodaltons. Source data are provided as a Source Data file.
Fig. 4
Fig. 4. Mical3 regulates AIS assembly and actin patches.
a Immunostaining of DIV6 hippocampal neurons transfected at DIV2 with pSuper or Mical3 shRNA. Scale bar = 20 µm. b Quantification of neurons with intact or no/disrupted AIS after transfection with pSuper control shRNA, or two different Mical3 shRNAs at DIV2-6 or DIV9-13. n = 3 independent experiments and total number of neurons counted is shown. Error bars, ±SEM. c Immunostaining of DIV13 hippocampal neurons transfected at DIV9 with pSuper or Mical3 shRNA. Scale bar = 10 µm. d Quantification of the percentage of neurons transfected with the indicated shRNA that show AIS enriched with actin. n = 3 independent experiments/condition with 15 neurons/condition. Error bars, ±SEM. e Immunostaining and labeling of hippocampal neurons transfected with MsrB1 cDNA. Phalloidin (red), MsRB1 (green), and Nfasc (blue). Arrowheads indicate the AIS. Scale bar = 10 µm. f Quantification of the percent of AIS enriched with actin as indicated by phalloidin labeling in the presence or absence of MsrB1. n = 3 independent experiments/condition with 10 neurons/condition. Error bars, ±SEM. g In vitro immunoprecipitation of Mical3-myc using myc antibodies co-immunoprecipitates some tRFP tagged RabGTPases. IP immunoprecipitation, IB immunoblotting. Molecular weight markers are in kilodaltons. h, i Labeling of AIS actin patches (arrowhead) using phalloidin (green) in untransfected DIV 14 neurons (h), or Rab8a-tRFP-transfected DIV 14 hippocampal neurons using phalloidin (green) and antibodies against Nfasc (blue) and tRFP (red) (i). Actin patches are indicated by the arrowhead. Scale bar = 10 µm. j The number of actin patches/AIS in neurons transfected with the indicated plasmid. n = 3 independent experiments with 10 neurons/experiment. (F = 52.63, df total = 20) ***p = 8.29 × 10−9; one-way ANOVA. Error bars, ±SEM. k Model for Mical3 function at the AIS. The cartoon illustrates that Rab GTPases on vesicles carrying axonal cargoes activate Mical3, resulting in depolymerization of actin patches. Vesicles carrying somatodendritic cargoes reverse direction at actin patches and do not enter the axon. Source data are provided as a Source Data file.
Fig. 5
Fig. 5. A detergent insoluble pool of AnkG-associated Septins is located at the AIS.
a, b Immunostaining of DIV14 hippocampal neurons using antibodies against AnkG (red), Sept6 (a, green), Sept11 (b, green) and Map2 (blue). The lower panels show the Triton X-100 detergent-resistant pools of Sept6 (a) and Sept11 (b) at the AIS. AIS are indicated by arrowheads. Scale bar = 5 μm. c In vitro co-immunoprecipitation shows AnkG-GFP co-immunoprecipitates with Sept5-FLAG and Sept6-FLAG. IP immunoprecipitation, IB immunoblotting. Molecular weight markers are in kilodaltons. Source data are provided as a Source Data file.
Fig. 6
Fig. 6. Septins stabilize and maintain AnkG at the AIS.
a, c Immunostaining of DIV6 neurons, transfected at DIV2 with control, Sept5, and Sept6 shRNAs, using antibodies against AnkG (a, red) or Trim46 (c, red), GFP (green), and Map2 (blue). Arrowheads indicate AIS. In c each field also shows AIS of untransfected neurons. b Percentage of neurons with AIS AnkG. DIV2 neurons transfected using shRNAs against Luciferase (Luc), and Septins 3, 5, 6, 7, and 11. Neurons were immunostained for AnkG immunoreactivity at DIV6. (F = 31.54, df total = 17) ***p = 1.66 × 10−6; one-way ANOVA. n = 3 independent experiments, total neurons: Luc shRNA = 255, Sept3 shRNA = 365, Sept5 shRNA = 341, Sept6 shRNA = 305, Sept7 shRNA = 388, Sept11 shRNA = 333. d Percentage of neurons with AIS Trim46. DIV2 neurons transfected using shRNAs against Luc, AnkG, Sept5, and Sept6. Neurons were immunostained for Trim46 immunoreactivity at DIV6. (F = 88.68, df total = 11) ***p = 1.76 × 10−6; one-way ANOVA. n = 3 independent experiments, total neurons: Luc shRNA = 414, AnkG shRNA = 719, Sept5 shRNA = 369, Sept6 shRNA = 425. e, f Immunostaining of DIV13 (e) and DIV 17 (f) neurons, transfected at DIV9 with control, AnkG, Sept5, and Sept6 shRNAs, using antibodies against AnkG (red), GFP (green), and Map2 (blue). Arrowheads indicate AIS. g, h Immunostaining of DIV13 or DIV17 neurons, transfected at DIV9 with AnkG, Sept5, and Sept6 shRNAs, using antibodies against Trim46 (red), GFP (green), and Map2 (blue). Arrowheads indicate AIS of transfected neurons. i Percentage of neurons with AIS AnkG. Neurons transfected at DIV9 using shRNA to Luc, AnkG, Sept5, or Sept6. AIS were labeled for AnkG at DIV13 or DIV17. n = 3 independent experiments, total neurons: (DIV9-13) Luc shRNA = 423, AnkG shRNA = 443, Sept5 shRNA = 252, Sept6 shRNA = 455; (DIV9-17) Luc shRNA = 423, AnkG shRNA = 515, Sept5 shRNA = 312, Sept6 shRNA = 245. j Percentage of neurons with AIS Trim46. Neurons transfected at DIV9 using shRNA to silence Luc, AnkG, Sept5, or Sept6. AIS were labeled for Trim46 at DIV13 or DIV17. n = 3 independent experiments, total neurons: (DIV9-13) Luc shRNA = 454, AnkG shRNA = 544, Sept5 shRNA = 240, Sept6 shRNA = 253; (DIV9-17) Luc shRNA = 256, AnkG shRNA = 390, Sept5 shRNA = 249, Sept6 shRNA = 245. All error bars, ±SEM. All scalebars = 5 µm. Source data are provided as a Source Data file.
Fig. 7
Fig. 7. The Ndel1 proximity proteome.
a Cartoon of BirA*-containing chimeras used to identify AIS proteins and their locations relative to β4 spectrin (not shown). b Immunolabeling of DIV14 hippocampal neurons transduced at DIV12 using adenovirus to express HA-tagged Ndel1C-BirA* and BirA*-Ndel1C. AIS are labeled using antibodies against Neurofascin (Nfasc, blue). The Ndel1C-BirA* and BirA*-Ndel1C chimeras are labeled using anti-HA antibodies (green). Biotinylated proteins were detected using Alexa594-conjugated Streptavidin. Scale bar = 5 μm. c, d The number of PSMs for each protein biotinylated by Ndel1C-BirA* and BirA*-Ndel1C, and identified by mass spectrometry; panels c and d are shown at different scales. Known AIS proteins are indicated in red. Proteins enriched and previously identified as candidate AIS proteins in the NF186-BirA* samples are indicated in blue. The solid line is the least-squares fit of the biotinylated proteins while the dotted lines parallel to the least-squares fit line represent an arbitrary minimum of ten PSMs confidence interval. Peptide counts for BirA*-Ndel1C are the average of two replicates, while results for Ndel1C-BirA* are from one experiment. e Rank plot showing the enrichment of PSMs for a given protein in the Ndel1C-BirA* samples over the PSMs for a given protein found in the BirA*-Ndel1C samples. Known AIS proteins are indicated in red. Proteins enriched and previously identified as candidate AIS proteins in the NF186-BirA* samples are indicated in blue. f The average ratio (Log2) of PSMs in Ndel1C-BirA* to PSMs in BirA*-Ndel1C expressing neurons. Known AIS proteins shown in red. Proteins also identified using NF186-BirA* chimeras shown in blue. Dashed lines indicate twofold enrichment, or equal levels of biotinylation. n = 2 independent experiments. g Immunostaining of DIV14 cultured hippocampal neurons using antibodies against AnkG (red), Ranbp2 (green), and Map2 (blue). The lower panels show detergent-resistant Ranbp2 at the AIS. AIS are indicated by arrowheads. Scale bar = 5 µm. h Immunostaining of DIV14 cultured hippocampal neurons using antibodies against AnkG (red), Macf1 (green), and Map2 (blue). The lower panels show the detergent-resistant Macf1 at the AIS. Arrowheads indicate. Scale bar = 5 µm.
Fig. 8
Fig. 8. The Trim46 proximity proteome reveals AIS tubulins.
a Immunolabeling of DIV14 hippocampal neurons transduced at DIV11 using adenovirus to express myc-tagged Trim46∆C-BirA*. From DIV13, neuronal culture media included 50 µM biotin. AIS are labeled using antibodies against Neurofascin (Nfasc, blue). The Trim46∆C-BirA* chimera is labeled using anti-myc antibodies (red). Biotinylated proteins were detected using Alexa488-conjugated Streptavidin. Scale bar = 5 µm. b, c Comparison of the peptide spectral matches (PSMs) for each protein biotinylated by Ndel1C-BirA* and proteins identified using combined Trim46∆C-BirA* and BirA*-Trim46∆C chimeras (referred to as Trim46-BirA*); panels b and c are shown at different scales. Known AIS proteins are indicated in red. Proteins enriched and previously identified as candidate AIS proteins in the NF186-BirA* samples are indicated in blue. The solid line is the least-squares fit of the biotinylated proteins while the dotted lines parallel to the least-squares fit line represent an arbitrary minimum of ten PSMs confidence interval. d Venn-diagram illustrating the number of candidate AIS proteins identified in each proximity proteome. e Comparison of the PSMs for each protein biotinylated by BirA*-Ndel1C and proteins identified using combined Trim46∆C-BirA* and BirA*-Trim46∆C chimeras. Known AIS proteins are indicated in red. Proteins enriched and previously identified as candidate AIS proteins in the NF186-BirA* samples are indicated in blue. The solid line is the least-squares fit of the biotinylated proteins while the dotted lines parallel to the least-squares fit line represent an arbitrary minimum of ten PSMs confidence interval. fi Immunostaining of DIV14 cultured hippocampal neurons using antibodies against AnkG (red), Tuba1a (f, green), Tuba4a (g, green), Tubb3 (h, green), Tubb5 (i, green), and Map2 (blue). The lower panels show the Triton X-100 detergent-resistant pools of the indicated tubulins. AIS are indicated by arrowheads. Scalebars = 10 µm.

References

    1. Kole MH, et al. Action potential generation requires a high sodium channel density in the axon initial segment. Nat. Neurosci. 2008;11:178–186. doi: 10.1038/nn2040. - DOI - PubMed
    1. Winckler B, Forscher P, Mellman I. A diffusion barrier maintains distribution of membrane proteins in polarized neurons. Nature. 1999;397:698–701. doi: 10.1038/17806. - DOI - PubMed
    1. Song AH, et al. A selective filter for cytoplasmic transport at the axon initial segment. Cell. 2009;136:1148–1160. doi: 10.1016/j.cell.2009.01.016. - DOI - PubMed
    1. Nakada C, et al. Accumulation of anchored proteins forms membrane diffusion barriers during neuronal polarization. Nat. Cell Biol. 2003;5:626–632. doi: 10.1038/ncb1009. - DOI - PubMed
    1. Zhou D, et al. AnkyrinG is required for clustering of voltage-gated Na channels at axon initial segments and for normal action potential firing. J. Cell Biol. 1998;143:1295–1304. doi: 10.1083/jcb.143.5.1295. - DOI - PMC - PubMed

Publication types