Clinical Trial
. 2020 Jun;34(6):1563-1576.
doi: 10.1038/s41375-019-0693-4. Epub 2020 Jan 3.

Immunomodulation with pomalidomide at early lymphocyte recovery after induction chemotherapy in newly diagnosed AML and high-risk MDS

Affiliations
Clinical Trial

Immunomodulation with pomalidomide at early lymphocyte recovery after induction chemotherapy in newly diagnosed AML and high-risk MDS

Joshua F Zeidner et al. Leukemia. 2020 Jun.

Abstract

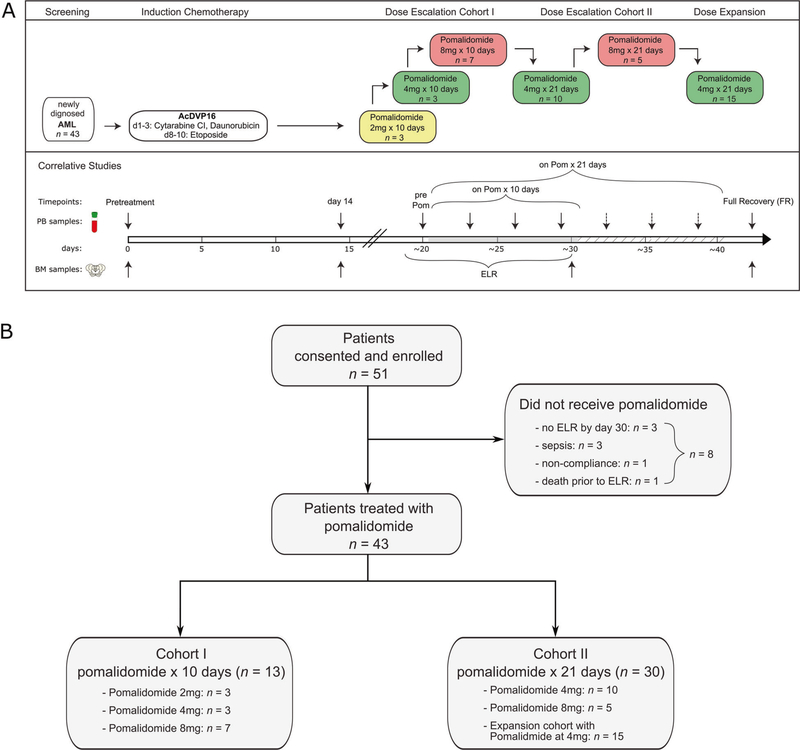
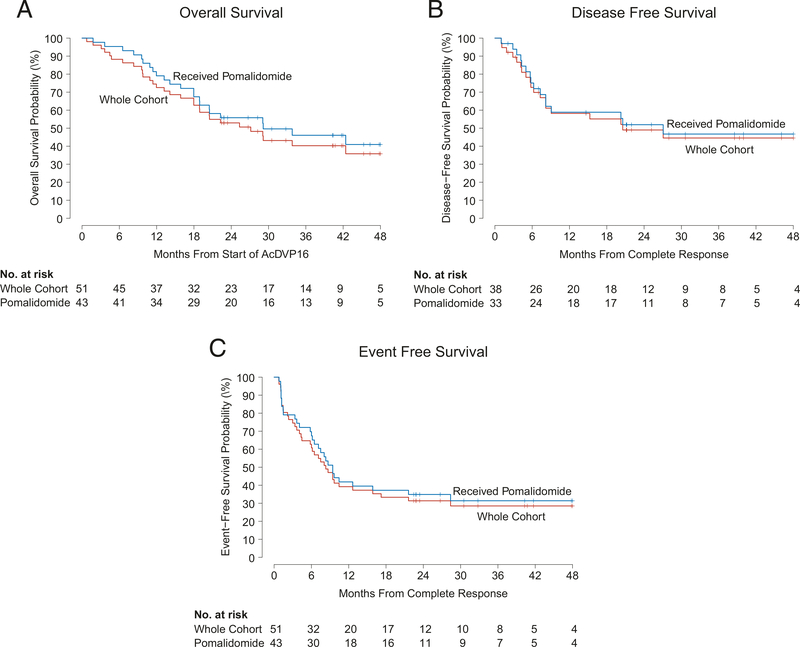
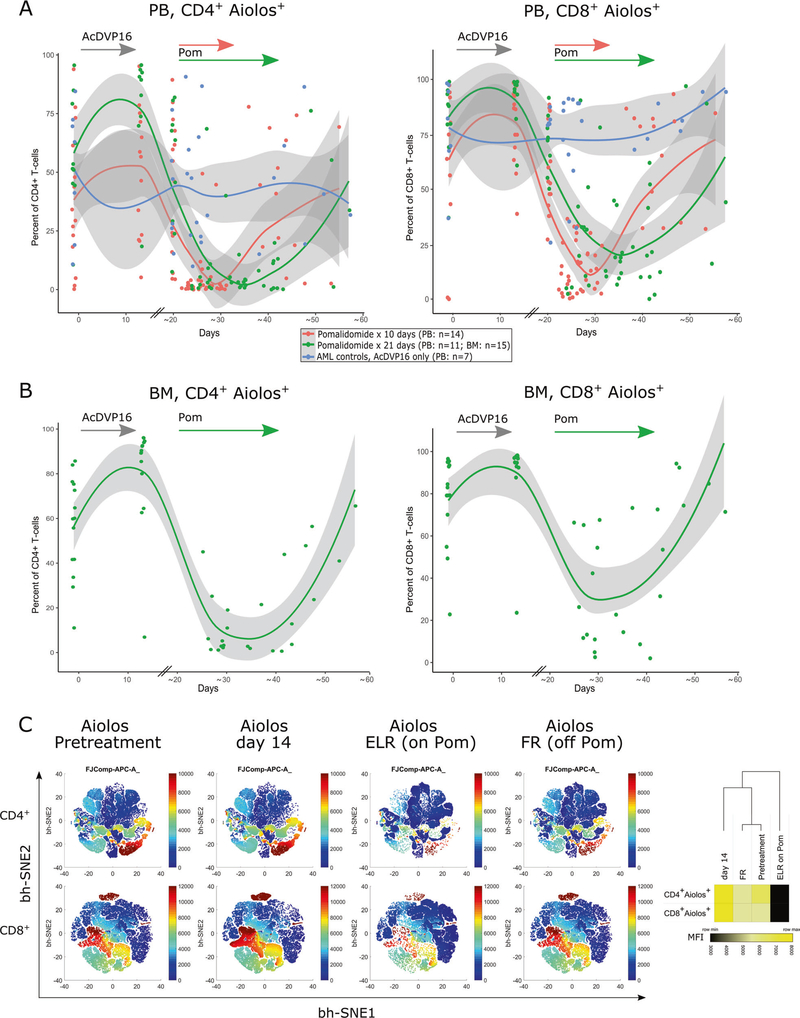
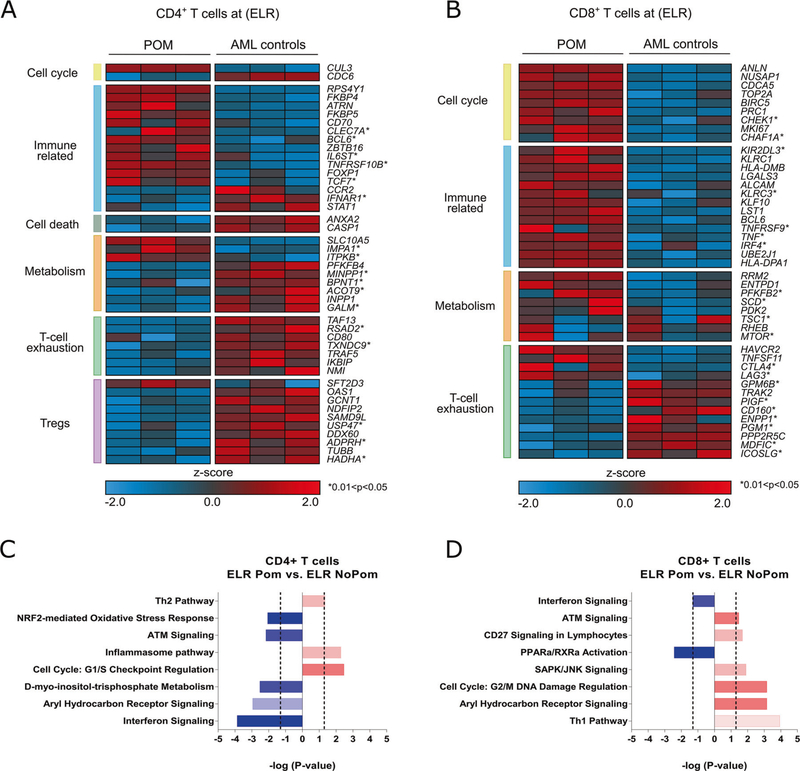
An immunosuppressive microenvironment promoting leukemia cell immune escape plays an important role in the pathogenesis of AML. Through its interaction with cereblon, a substrate receptor for the E3 ubiquitin ligase complex, pomalidomide leads to selective ubiquitination of transcription factors Aiolos and Ikaros thereby promoting immune modulation. In this phase I trial, 51 newly diagnosed non-favorable risk AML and high-risk MDS patients were enrolled and treated with AcDVP16 (cytarabine 667 mg/m2/day IV continuous infusion days 1-3, daunorubicin 45 mg/m2 IV days 1-3, etoposide 400 mg/m2 IV days 8-10) induction therapy followed by dose- and duration-escalation pomalidomide beginning at early lymphocyte recovery. Forty-three patients (AML: n = 39, MDS: n = 4) received pomalidomide. The maximum tolerated dose of pomalidomide was 4 mg for 21 consecutive days. The overall complete remission (CR + CRi) rate, median overall survival, and disease-free survival were 75%, 27.1 and 20.6 months, respectively. Subset analyses revealed 86% CR/CRi rate in AML patients with unfavorable-risk karyotype treated with pomalidomide. Pomalidomide significantly decreased Aiolos expression in both CD4+ and CD8+ peripheral blood and bone marrow T cells, promoted T cell differentiation, proliferation, and heightened their cytokine production. Finally, pomalidomide induced distinct gene expression changes in immune function-related ontologies in CD4+ and CD8+ T cells.


Figures

Fig. 1
Fig. 1. Study schema and survival outcomes.
a All patients received induction therapy AcDVP16, followed by pomalidomide (POM) at the time of early lymphocyte recovery (ELR), after day 14 and within 3 days of WBC > 0.2 × 10⁹/L above nadir, but no later than day 30 of induction therapy. Dose escalation of pomalidomide during ELR occurred in two cohorts. Cohort 1 consisted of pomalidomide duration of 10 consecutive days and Cohort 2 consisted of pomalidomide duration of 21 consecutive days. PB and BM samples for laboratory-correlative studies were collected at pretreatment, on day 14 after receiving induction chemotherapy, at the time of ELR (before start of pomalidomide treatment), every 3–4 days during pomalidomide treatment and at full recovery after treatment (FR). b Consort Diagram. A total of 51 patients were consented and enrolled on this study while 43 patients received planned pomalidomide. Cohort 1 (n = 13) consisted of pomalidomide in dose escalation for 10 consecutive days, while Cohort 2 (n = 30) consisted of pomalidomide in dose escalation for 21 consecutive days with planned dose expansion of 15 patients.
Fig. 2
Fig. 2. Survival outcomes.
a Median overall survival (OS) was 27.1 months (95% CI: 18.9, N/A) versus 33.8 months (95% CI: 20.5, N/A) for the whole cohort and pomalidomide-treated patients, respectively. b Median disease-free survival (DFS) was 20.6 months (95% CI: 8.2, NA) versus 27.1 months (95% CI: 8.2, N/A) for the whole cohort and pomalidomide-treated patients, respectively. c median event-free survival (EFS) was 8.3 months (95% CI: 6.0, 17.2) versus 9.4 months (95% CI: 7.1, NA) for the whole cohort and pomalidomide-treated patients, respectively.
Fig. 3
Fig. 3. Aiolos expression in T cells as a pharmacodynamic biomarker of in vivo pomalidomide effect.
Aiolos staining and analysis by flow cytometry was performed on paired CD4+ or CD8+ T cell samples (PB, n = 25; BM, n = 15). Fixed timepoints included a pretreatment, day 14 and a pre-pomalidomide sample at beginning of ELR (around day 20, PB only). PB samples during pomalidomide were drawn every 3–4 days thereafter (for BM only once) until full recovery. The data were summarized in dot plot and nonlinear regression was calculated in R, using a LOESS curve fitting model. a PB samples, 14 patients received pomalidomide for 10 days (red dots/line) and 11 patients for 21 days (green dots/line). PB samples from 7 AML controls who received induction chemotherapy (AcDVP16) only, but not pomalidomide (blue dots/line). AML controls are lacking day 14 sample and modeled curves have to be interpreted accordingly. b For BM samples, only the AML patient group receiving pomalidomide for 21 days was analyzed (n = 15). c bidimensional maps obtained from flow cytometric data using the bh-SNE algorithm depicting serial Aiolos expression on BM CD4+ and CD8+ T cells of the 15 patients presented in (b). Each point in the map represents an individual cell, and the cells are colored according to the intensity of expression of individual markers, as indicated on the color scale to the right of individual maps. Heatmap (right) represents the median fluorescence intensity (MFI) of Aiolos expression in CD4+ and CD8+ T cells at different timepoints. Heatmap and clustering was done using Morpheus software (Broad Institute) using Euclidean distance and average linkage method.
Fig. 4
Fig. 4. Pomalidomide induces unique changes in T cell gene expression in vivo.
Gene expression analysis of highly purified (>98%) PB CD4+ and CD8+ T cells at ELR comparing pomalidomide-treated AML patients (n = 3) to age-matched AML patients receiving induction chemotherapy alone (n = 3). a, b Heatmap of select DEGs for CD4+ and CD8+ T cells, respectively, grouped into key biological categories (log2FC > 1 and <−1; P < 0.01; *0.01 < P < 0.05). Every row represents a gene, and every column a patient sample. Red indicates an increase over the mean (Z > 0) and blue a decrease (Z < 0). c, d Ingenuity pathway analysis of the differentially expressed genes (log2FC > 1 and <−1; P < 0.05). Pathways were selected according to P < 0.01 and availability of a predictive Z score. Activated pathways (positive Z score) are colored red; inhibited pathways (negative Z score) are colored blue.

References

    1. Burnett AK. Treatment of acute myeloid leukemia: are we making progress? Hematol Am Soc Hematol Educ Program. 2012; 2012:1–6. - PubMed
    1. Appelbaum FR, Gundacker H, Head DR, Slovak ML, Willman CL, Godwin JE, et al. Age and acute myeloid leukemia. Blood. 2006;107:3481–5. - PMC - PubMed
    1. Karp JE, Garrett-Mayer E, Estey EH, Rudek MA, Smith BD, Greer JM, et al. Randomized phase II study of two schedules of flavopiridol given as timed sequential therapy with cytosine arabinoside and mitoxantrone for adults with newly diagnosed, poor-risk acute myelogenous leukemia. Haematologica. 2012;97:1736–42. - PMC - PubMed
    1. Zeidner JF, Foster MC, Blackford AL, Litzow MR, Morris LE, Strickland SA, et al. Randomized multicenter phase II study of flavopiridol (alvocidib), cytarabine, and mitoxantrone (FLAM) versus cytarabine/daunorubicin (7+3) in newly diagnosed acute myeloid leukemia. Haematologica. 2015;100:1172–9. - PMC - PubMed
    1. Castaigne S, Chevret S, Archimbaud E, Fenaux P, Bordessoule D, Tilly H, et al. Randomized comparison of double induction and timed-sequential induction to a “3 + 7” induction in adults with AML: long-term analysis of the Acute Leukemia French Association (ALFA) 9000 study. Blood. 2004;104:2467–74. - PubMed

Publication types

MeSH terms