. 2020 Jan 3;11(1):71.
doi: 10.1038/s41467-019-13817-8.

Integrative discovery of treatments for high-risk neuroblastoma

Affiliations

Integrative discovery of treatments for high-risk neuroblastoma

Elin Almstedt et al. Nat Commun. .

Abstract

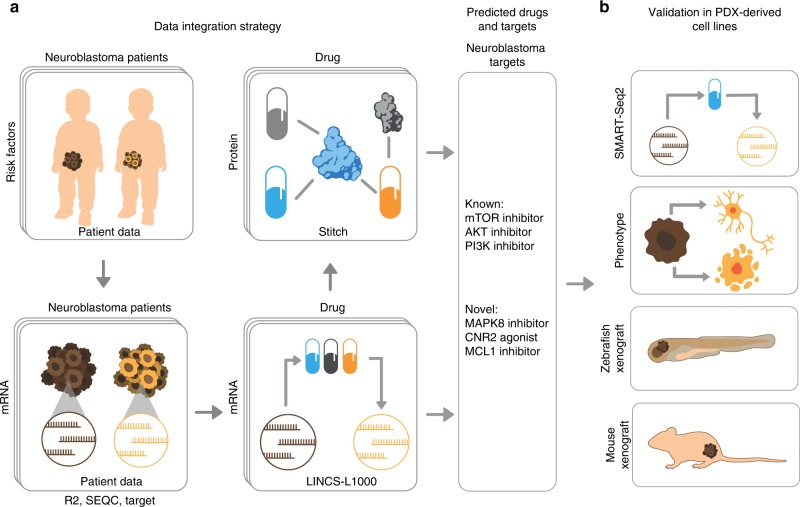
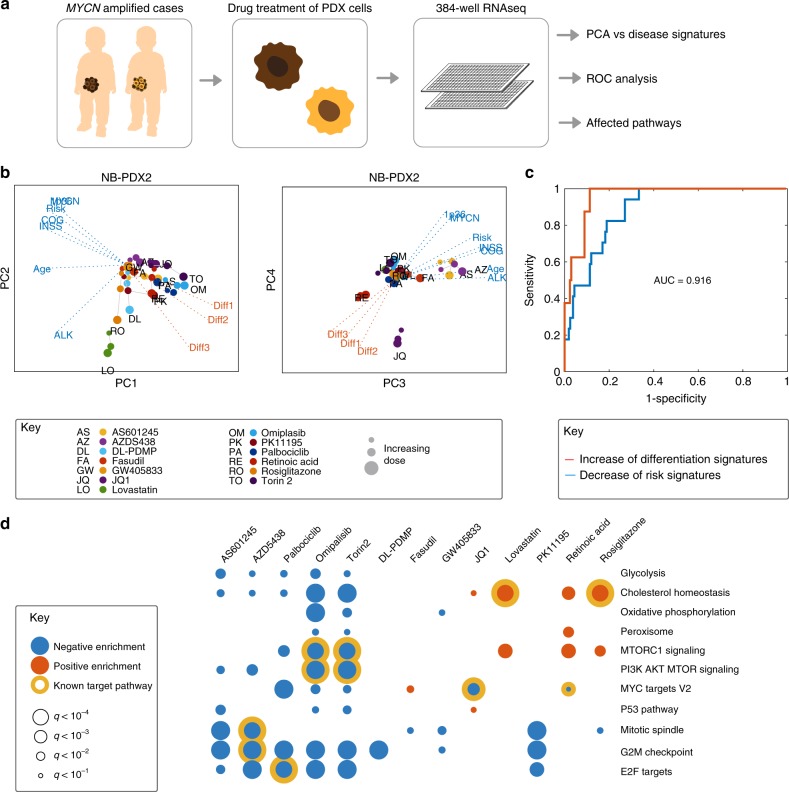
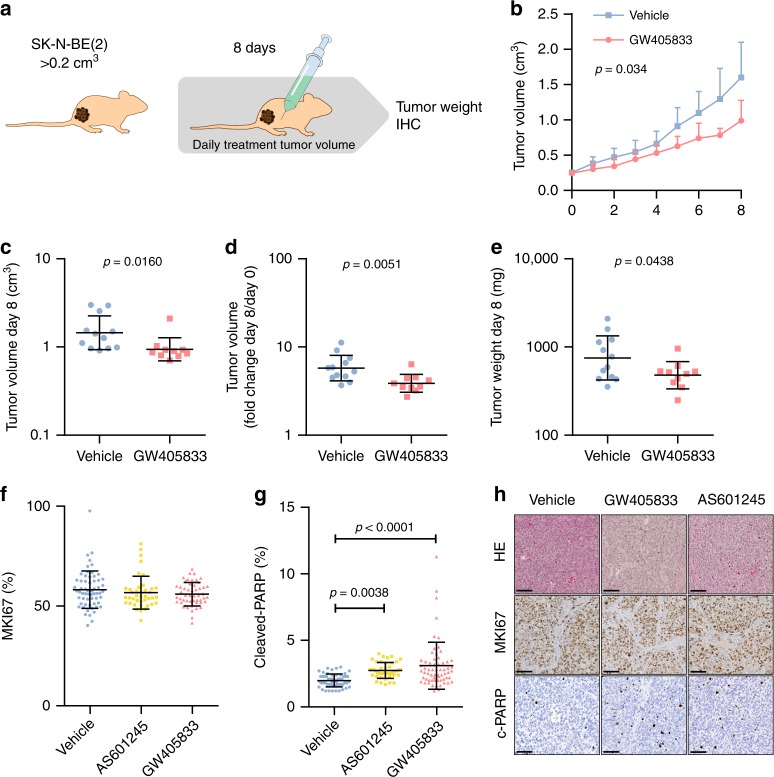
Despite advances in the molecular exploration of paediatric cancers, approximately 50% of children with high-risk neuroblastoma lack effective treatment. To identify therapeutic options for this group of high-risk patients, we combine predictive data mining with experimental evaluation in patient-derived xenograft cells. Our proposed algorithm, TargetTranslator, integrates data from tumour biobanks, pharmacological databases, and cellular networks to predict how targeted interventions affect mRNA signatures associated with high patient risk or disease processes. We find more than 80 targets to be associated with neuroblastoma risk and differentiation signatures. Selected targets are evaluated in cell lines derived from high-risk patients to demonstrate reversal of risk signatures and malignant phenotypes. Using neuroblastoma xenograft models, we establish CNR2 and MAPK8 as promising candidates for the treatment of high-risk neuroblastoma. We expect that our method, available as a public tool (targettranslator.org), will enhance and expedite the discovery of risk-associated targets for paediatric and adult cancers.


Conflict of interest statement

The authors declare no competing interests.

Figures

Fig. 1
Fig. 1. Integrative discovery of treatments for high-risk neuroblastoma.
a Step 1: Data integration. We combined omics data from three cohorts of high-risk neuroblastoma (R2, TARGET and SEQC) to construct risk signatures, which were linked to pharmaco-transcriptomic (L1000) and drug target (STITCH) data, resulting in associations between disease signatures and therapeutic targets. b Step 2: Experimental evaluation. Using tumour cells from high-risk cases, we combine RNA sequencing, cell-based assays, and animal models to confirm targets.
Fig. 2
Fig. 2. Detection of multiple targets linked to neuroblastoma risk factors.
a Validation of neuroblastoma risk signatures by each signature's agreement across three independent cohorts (R2, TARGET and SEQC). Dark grey = signatures constructed by TargetTranslator, using high variance genes; grey = TargetTranslator, L1000 landmark genes; white = L1000 landmark genes, using the Characteristic direction algorithm. b Principal component analysis of the 10 most reproducible signatures, showing risk factors at unit length and marker genes as points; note collinearity between signatures and the distinct/opposing direction of differentiation signatures. Blue: signatures associated with disease pathways or poor outcome. Red: signatures associated with differentiation. c Left: Matching compounds and drugs in L1000 to neuroblastoma signatures; score empirical cumulative distribution function (ecdf) for 19763 drugs, based on L1000 from 14 cell lines (dashed line = permutation control). Right: Detection of enriched targets by shifts in the ecdf curve. L1000 compounds were mapped to drug targets using the STITCH database. Examples of drugs with a common target are highlighted (coloured curve). Note examples of confirmed (AKT1, MTOR, HDAC1), predicted (HMGCR, MAPK8, CNR2) and control targets (MYC, RARB, associated to MYCN and differentiation signatures, respectively). q are FDR-controlled p-values of a Kolmogorov–Smirnoff test that compares target-specific compounds (coloured curve) vs other compounds. d Visualization of pathway dependencies for all targets with q-value < 0.0001, mapped to the minimal spanning tree (MST) of all STRING links between targets. (MST facilitates visualization, by removing redundant links).
Fig. 3
Fig. 3. Drug targets predicted by TargetTranslator for neuroblastoma signatures.
88 drug targets predicted by TargetTranslator. Red: target is associated with induction of signature; Blue: target is associated with suppression of signature. Shades represent strength of q-value.
Fig. 4
Fig. 4. RNA profiling confirmed modulation of neuroblastoma risk signatures.
a Experiment concept. b Principal component analysis of results for patient 1 (NB-PDX2). Note similar directions of PI3K and MTOR inhibitors omipalisib (OM) and torin-2 (TO) along PC1, and differentiation-inducing agents retinoic acid and JQ1 along PC 4. See also Supplementary Fig. 3. c ROC curve analysing the predictive power of TargetTranslator, defined as the ability to predict (from the public data sources) whether a particular gene signature will decrease (blue) or increase (red) after drug treatment; showing average for 10 risk signatures and all tested drugs, overall area under the curve correctness of 0.916. d Gene Set Enrichment Analysis (GSEA) of drug-induced changes, showing suppressed (blue) and induced (red) pathways. Yellow circles mark the known action of each corresponding drug.
Fig. 5
Fig. 5. Predicted targets suppressed malignant phenotypes in patient-derived neuroblastoma cells.
a Viability response of four neuroblastoma (red) and one glioblastoma (blue, U3013MG) cell lines after 72 h of treatment. Asterisks indicate the level of significance for each neuroblastoma cell line compared with U3013MG. (When applicable, IC50 was used for statistical comparisons, otherwise, the dose is indicated by the arrow.) b, c Apoptotic response (cleaved CASP3/7) of each compound (mean, n = 3) and comparison of compounds at 96 h time point (mean, standard deviation). d Reduction of N-Myc levels after 48 h drug exposure at IC50 concentrations, cropped image. The full image is found in the Source Data file. e Quantified N-Myc levels for both NB-PDX2 and NB-PDX3 (mean, 95% confidence interval; JQ1, GW, n = 16; lovastatin, n = 8; omipalisib, RA, AZD5438, rosiglitazone, fasudil, AS601245, n = 6; palbociclib, DL-PDMP, Torin-2, n = 5; one-sample t-test with Benjamini–Hochberg FDR correction). f IC10 drug effects of neurite outgrowth for NB-PDX2 (blue) and NB-PDX3 (yellow), bootstrapping estimates (n = 1000). A higher morphological differentiation score indicates longer cell protrusions. Stars show significance levels compared with negative control for the respective cell lines. g Representative image of cell protrusions (white arrow) after 72 h of treatment. *p < 0.05, **p  < 0.01, ***p  < 0.001, ****p  < 0.0001.
Fig. 6
Fig. 6. Targeting MAPK8 and CNR2 suppressed neuroblastoma xenografts in zebrafish.
a Workflow: patient-derived neuroblastoma cells were tagged with green fluorescent protein (GFP), sorted, and injected into the midbrain of 1-day post fertilization (dpf) zebrafish embryos. b Tumour localization 24 h following injection (n = 266) (mean, standard deviation). c 2 dpf zebrafish embryos were exposed to drug concentrations corresponding to IC20, IC50 or IC80. Toxicity was noted after 24h , and score between 0 (no toxicity, white) and 5 (instant, lethal toxicity, red). d Automated image-based assay of tumour growth in xenotransplanted zebrafish embryos. e Tumour area increase from 2 to 5 dpf (mean, standard deviation). f Representative image of the same zebrafish embryos before and after treatment.
Fig. 7
Fig. 7. GW405833 reduces neuroblastoma growth in vivo.
a Mice were engrafted with 15×106 SK-N-BE(2) cells s.c. and randomized to receive a daily i.p. injection of GW (45 mg/kg; n = 10) or vehicle (n = 12) for 8 days, starting at the appearance of palpable tumours of >0.2cm3. b GW405833 significantly impaired the growth of established human tumours (hierarchical linear model). c Point comparison of day 8 tumour volume. d Tumour volume increase from day 0 to day 8. e Post-mortem tumour weight after 8 days of treatment. f Cell proliferation marker MKI67, counted using ImmunoRatio plugin for ImageJ from 10 to 15 representative fields per specimen (DMSO, GW405833, n = 5; AS601245, n = 4). g Apoptosis marker cleaved PARP, counted in using ImmunoRatio plugin for ImageJ from 10 to 15 representative fields per specimen (DMSO, GW405833, n = 5; AS601245, n = 3). h Representative images of tumour histology (HE), MKI67 and c-PARP localization, bar = 100 μm. Statistics: b Mean, 95% confidence interval, p-value computed from a mixed effects model and corrected for multiple testing using bonferroni correction. cg Mean, standard deviation, Student’s t-test.

References

    1. Maris JM, Hogarty MD, Bagatell R, Cohn SL. Neuroblastoma. Lancet. 2007;369:2106–2120. doi: 10.1016/S0140-6736(07)60983-0. - DOI - PubMed
    1. Brodeur GM. Spontaneous regression of neuroblastoma. Cell Tissue Res. 2018;372:277–286. doi: 10.1007/s00441-017-2761-2. - DOI - PMC - PubMed
    1. Cohn SL, et al. The International Neuroblastoma Risk Group (INRG) classification system: an INRG Task Force report. J. Clin. Oncol. 2009;27:289–297. doi: 10.1200/JCO.2008.16.6785. - DOI - PMC - PubMed
    1. Bresler SC, et al. ALK mutations confer differential oncogenic activation and sensitivity to ALK inhibition therapy in neuroblastoma. Cancer Cell. 2014;26:682–694. doi: 10.1016/j.ccell.2014.09.019. - DOI - PMC - PubMed
    1. Grobner SN, et al. The landscape of genomic alterations across childhood cancers. Nature. 2018;555:321–327. doi: 10.1038/nature25480. - DOI - PubMed

Publication types

MeSH terms

Substances