. 2020 Jan 3;11(1):69.
doi: 10.1038/s41467-019-13803-0.

Interpreting pathways to discover cancer driver genes with Moonlight

Affiliations

Interpreting pathways to discover cancer driver genes with Moonlight

Antonio Colaprico et al. Nat Commun. .

Abstract

Cancer driver gene alterations influence cancer development, occurring in oncogenes, tumor suppressors, and dual role genes. Discovering dual role cancer genes is difficult because of their elusive context-dependent behavior. We define oncogenic mediators as genes controlling biological processes. With them, we classify cancer driver genes, unveiling their roles in cancer mechanisms. To this end, we present Moonlight, a tool that incorporates multiple -omics data to identify critical cancer driver genes. With Moonlight, we analyze 8000+ tumor samples from 18 cancer types, discovering 3310 oncogenic mediators, 151 having dual roles. By incorporating additional data (amplification, mutation, DNA methylation, chromatin accessibility), we reveal 1000+ cancer driver genes, corroborating known molecular mechanisms. Additionally, we confirm critical cancer driver genes by analysing cell-line datasets. We discover inactivation of tumor suppressors in intron regions and that tissue type and subtype indicate dual role status. These findings help explain tumor heterogeneity and could guide therapeutic decisions.


Conflict of interest statement

The authors declare no competing interests.

Figures

Fig. 1
Fig. 1. Moonlight data integration and functionalities.
a Data used for discovery of oncogenic mediators and controlling mechanisms of cancer driver genes. b Moonlight pipeline for discovery of tumor suppressors, oncogenes, and dual-role genes.
Fig. 2
Fig. 2. Moonlight application within breast-cancer case study.
a Barplot from Functional Enrichment Analysis showing the BPs enriched significantly with |Moonlight Process Z-score| > = 1 and FDR < = 0.01; increased levels are reported in yellow, decreased in purple, and green shows the -logFDR/10. A negative Moonlight Process Z-score indicates that the process’ activity is decreased, while a positive Moonlight Process Z-score indicates that the process’ activity is increased. Values in parentheses indicate the number of genes in common between the genes annotated in the biological process and the genes used as input for the functional enrichment. b Heatmap showing the top 50 predicted tumor suppressors and oncogenes in breast cancer and their associated biological processes. Hierarchical clustering was performed on the Euclidean distance matrix. Biological Processes with increased (decreased) Moonlight Gene Z-score are marked in red (blue). The number of samples reporting the mutation of specific genes ranges from white to dark purple. Hypermethylated (hypomethylated) DMR are shown in blue (yellow). Genes with poor Kaplan–Meier survival prognosis are marked in pink. Chromatin accessibility in the promoter region ranges from white (closed) to orange (open). The upper panel shows boxplots of cell-line expression levels. c Barplot reporting the number of tumor-suppressor genes (blue) or oncogene (red) predicted in pan-cancer analysis using expert knowledge paired with PRA using two selected biological processes, such as apoptosis and cell proliferation. d Heatmap showing the top 50 dual-role genes (by Moonlight Gene Z-score) within cancer types, oncogenes (OCGs) are shown in red and Tumor-Suppressor Genes (TSGs) in blue. TCGA study abbreviations available at https://gdc.cancer.gov/resources-tcga-users/tcga-code-tables/tcga-study-abbreviations. e Circos plots for molecular subtypes of Moonlight genes predicted using expert knowledge paired with PRA using two selected BPs, such as apoptosis and cell proliferation. From outer to the inner layer, the color labels are breast-cancer subtype. In the parentheses, the number of OCGs and TSG for a specific molecular subtype; OCGs (green) and TSGs (yellow); purple and orange for mutations: inframe deletion, inframe insertion, missense; gene–gene edges between two cancer molecular subtypes are OCG in both (green), TSG in both (yellow), dual-role genes (red).
Fig. 3
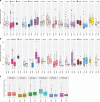
Fig. 3. Chromatin accessibility landscape of oncogenic mediators.
a log2 (chromatin peaks in promoters) for tumor suppressor and oncogenes detected in Pan-Cancer study, b boxplot showing log2 (chromatin peaks in introns), and c breast cancer log2 (chromatin peaks count).
Fig. 4
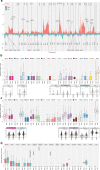
Fig. 4. Copy number and mutational landscape of oncogenic mediators.
a Copy-number changes in breast cancer (amplification of oncogenes in red and deletion of tumor suppressors in blue) identified according to criteria described in the Methods section. The orange line represents the significance threshold (FDR = 0.25). The complete list of chromosome location peaks associated to cancer driver genes in Pan-Cancer study is included in Supplementary Data 8. b Boxplot showing log2 (intron mutation counts), c log2 (missense mutation counts) for tumor suppressor and oncogenes detected in Pan-Cancer study, and d breast cancer log2 (mutation type count).
Fig. 5
Fig. 5. Moonlight dual-role genes that could differentially influence prognosis by cancer type or subtype.
Clinical implication (a, b) Kaplan–Meier survival curves show that ANKRD23 is a tumor suppressor in BLCA (a) and an oncogene in KIRC (b).
Fig. 6
Fig. 6. Moonlight a Pan-Cancer study: dual-role genes and machine-learning approach.
a Circos plot showing an integrative analysis of 14 TCGA cancer types using the ML approach. Labels around the plot specify the cancer type; the number of OCGs and TSGs for that cancer type are in parentheses. An edge is drawn in the center of the figure whenever the same gene is predicted in two different cancer types. Segments and edge colors correspond to cancer type: green (yellow) segments correspond to the number of OCGs (TSGs) predicted in that cancer type, and red edges represent dual-role genes. b Performance evaluation of Moonlight in terms of log loss for tumor suppressors and oncogenes predicted in 14 cancer types. Performance of 20/20 + and OncodriveRole in terms of log loss and AUC. c Heatmap showing Moonlight Gene Z-score for upstream regulators for rectum adenocarcinomas. Row colors indicate TSGs (yellow) and OCGs (green).
Fig. 7
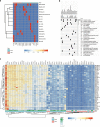
Fig. 7. Moonlight intratumor heterogeneity, cell line, and drug analysis.
a Heatmap showing each compound (perturbagen) in rows from the Connectivity Map that share gene targets predicted as OCG (salmon) or TSG (teal) in columns. A red square indicates the presence of a relationship between compound and target. b Heatmap showing each compound (perturbagen) in columns from the Connectivity Map that shares mechanisms of action (rows), sorted by descending number of compounds with shared mechanisms of action. c Heatmap showing the top 50 TSG and OCG (by Moonlight Gene Z-score) predicted in breast cancer as mediators of apoptosis and proliferation (columns) and expression profiles of 50 breast-cancer cell lines from the Genomics of Drug Sensitivity in Cancer (GDSC) database (rows).

Similar articles

Cited by

  • EPIMUTESTR: a nearest neighbor machine learning approach to predict cancer driver genes from the evolutionary action of coding variants.
    Parvandeh S, Donehower LA, Panagiotis K, Hsu TK, Asmussen JK, Lee K, Lichtarge O. Parvandeh S, et al. Nucleic Acids Res. 2022 Jul 8;50(12):e70. doi: 10.1093/nar/gkac215. Nucleic Acids Res. 2022. PMID: 35412634 Free PMC article.
  • Comprehensive evaluation of computational methods for predicting cancer driver genes.
    Shi X, Teng H, Shi L, Bi W, Wei W, Mao F, Sun Z. Shi X, et al. Brief Bioinform. 2022 Mar 10;23(2):bbab548. doi: 10.1093/bib/bbab548. Brief Bioinform. 2022. PMID: 35037014 Free PMC article.
  • A molecular taxonomy of tumors independent of tissue-of-origin.
    Nguyen PT, Coetzee SG, Lakeland DL, Hazelett DJ. Nguyen PT, et al. iScience. 2021 Sep 3;24(10):103084. doi: 10.1016/j.isci.2021.103084. eCollection 2021 Oct 22. iScience. 2021. PMID: 34611608 Free PMC article.
  • Integrated Proteogenomic Characterization across Major Histological Types of Pediatric Brain Cancer.
    Petralia F, Tignor N, Reva B, Koptyra M, Chowdhury S, Rykunov D, Krek A, Ma W, Zhu Y, Ji J, Calinawan A, Whiteaker JR, Colaprico A, Stathias V, Omelchenko T, Song X, Raman P, Guo Y, Brown MA, Ivey RG, Szpyt J, Guha Thakurta S, Gritsenko MA, Weitz KK, Lopez G, Kalayci S, Gümüş ZH, Yoo S, da Veiga Leprevost F, Chang HY, Krug K, Katsnelson L, Wang Y, Kennedy JJ, Voytovich UJ, Zhao L, Gaonkar KS, Ennis BM, Zhang B, Baubet V, Tauhid L, Lilly JV, Mason JL, Farrow B, Young N, Leary S, Moon J, Petyuk VA, Nazarian J, Adappa ND, Palmer JN, Lober RM, Rivero-Hinojosa S, Wang LB, Wang JM, Broberg M, Chu RK, Moore RJ, Monroe ME, Zhao R, Smith RD, Zhu J, Robles AI, Mesri M, Boja E, Hiltke T, Rodriguez H, Zhang B, Schadt EE, Mani DR, Ding L, Iavarone A, Wiznerowicz M, Schürer S, Chen XS, Heath AP, Rokita JL, Nesvizhskii AI, Fenyö D, Rodland KD, Liu T, Gygi SP, Paulovich AG, Resnick AC, Storm PB, Rood BR, Wang P; Children’s Brain Tumor Network; Clinical Proteomic Tumor Analysis Consortium. Petralia F, et al. Cell. 2020 Dec 23;183(7):1962-1985.e31. doi: 10.1016/j.cell.2020.10.044. Epub 2020 Nov 25. Cell. 2020. PMID: 33242424 Free PMC article.
  • Proteogenomic insights into the biology and treatment of HPV-negative head and neck squamous cell carcinoma.
    Huang C, Chen L, Savage SR, Eguez RV, Dou Y, Li Y, da Veiga Leprevost F, Jaehnig EJ, Lei JT, Wen B, Schnaubelt M, Krug K, Song X, Cieślik M, Chang HY, Wyczalkowski MA, Li K, Colaprico A, Li QK, Clark DJ, Hu Y, Cao L, Pan J, Wang Y, Cho KC, Shi Z, Liao Y, Jiang W, Anurag M, Ji J, Yoo S, Zhou DC, Liang WW, Wendl M, Vats P, Carr SA, Mani DR, Zhang Z, Qian J, Chen XS, Pico AR, Wang P, Chinnaiyan AM, Ketchum KA, Kinsinger CR, Robles AI, An E, Hiltke T, Mesri M, Thiagarajan M, Weaver AM, Sikora AG, Lubiński J, Wierzbicka M, Wiznerowicz M, Satpathy S, Gillette MA, Miles G, Ellis MJ, Omenn GS, Rodriguez H, Boja ES, Dhanasekaran SM, Ding L, Nesvizhskii AI, El-Naggar AK, Chan DW, Zhang H, Zhang B; Clinical Proteomic Tumor Analysis Consortium. Huang C, et al. Cancer Cell. 2021 Mar 8;39(3):361-379.e16. doi: 10.1016/j.ccell.2020.12.007. Epub 2021 Jan 7. Cancer Cell. 2021. PMID: 33417831 Free PMC article.

References

    1. Lytle NK, Barber AG, Reya T. Stem cell fate in cancer growth, progression and therapy resistance. Nat. Rev. Cancer. 2018;18:669–680. doi: 10.1038/s41568-018-0056-x. - DOI - PMC - PubMed
    1. Vogelstein B, et al. Cancer genome landscapes. Science. 2013;339:1546–1558. doi: 10.1126/science.1235122. - DOI - PMC - PubMed
    1. Hahn WC, Weinberg RA. Modelling the molecular circuitry of cancer. Nat. Rev. Cancer. 2002;2:331–341. doi: 10.1038/nrc795. - DOI - PubMed
    1. Zadra G, Batista JL, Loda M. Dissecting the dual role of AMPK in cancer: from experimental to human studies. Mol. Cancer Res. 2015;13:1059–1072. doi: 10.1158/1541-7786.MCR-15-0068. - DOI - PMC - PubMed
    1. Shen L, Shi Q, Wang W. Double agents: genes with both oncogenic and tumor-suppressor functions. Oncogenesis. 2018;7:25. doi: 10.1038/s41389-018-0034-x. - DOI - PMC - PubMed

Publication types