. 2020 Dec;77(24):5189-5205.
doi: 10.1007/s00018-019-03440-7. Epub 2020 Jan 3.

GPR50-Ctail cleavage and nuclear translocation: a new signal transduction mode for G protein-coupled receptors

Affiliations

GPR50-Ctail cleavage and nuclear translocation: a new signal transduction mode for G protein-coupled receptors

Raise Ahmad et al. Cell Mol Life Sci. 2020 Dec.

Abstract

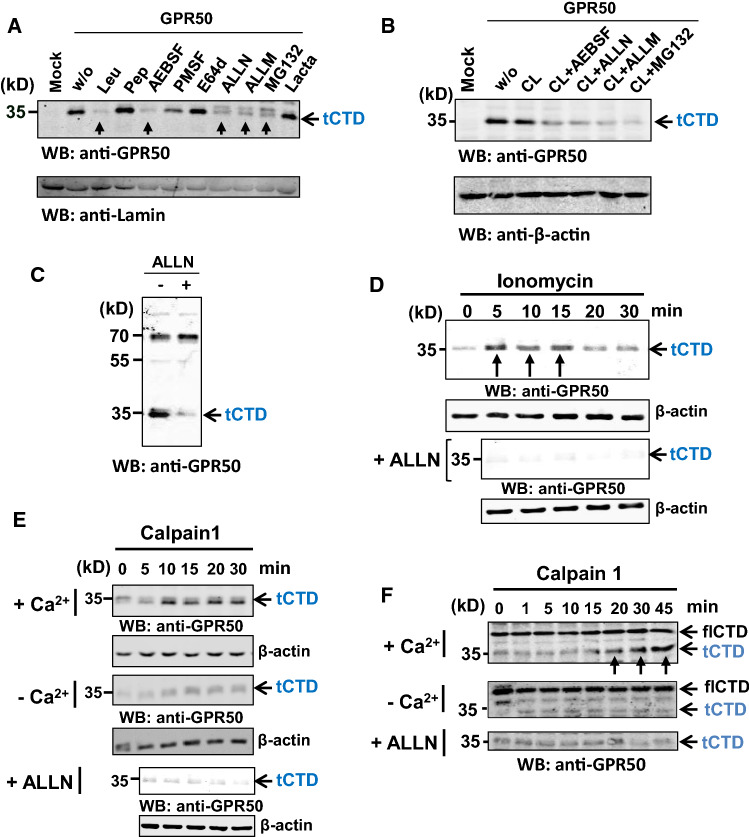
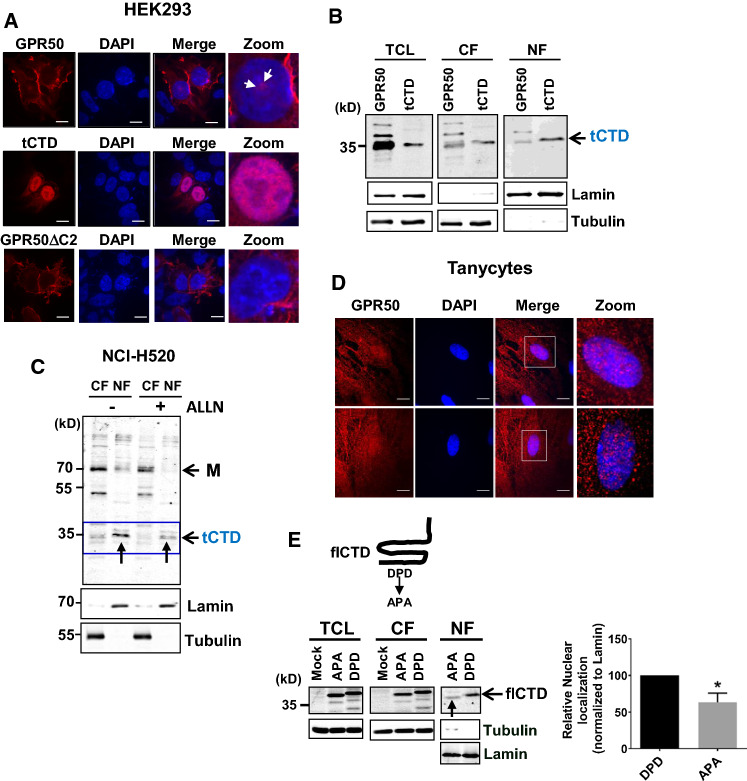
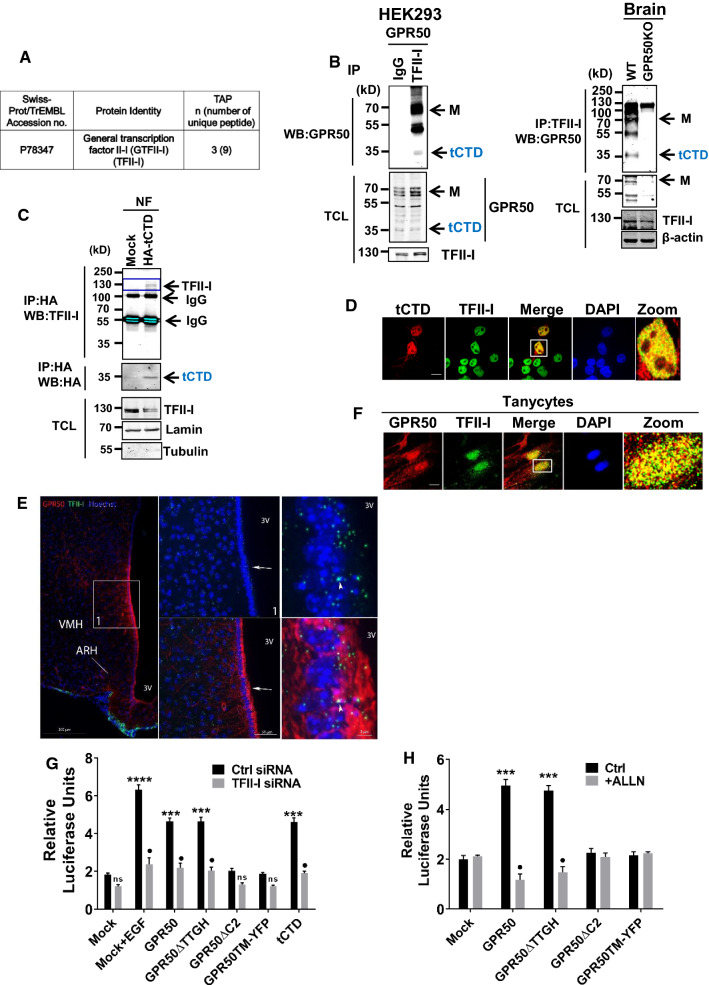
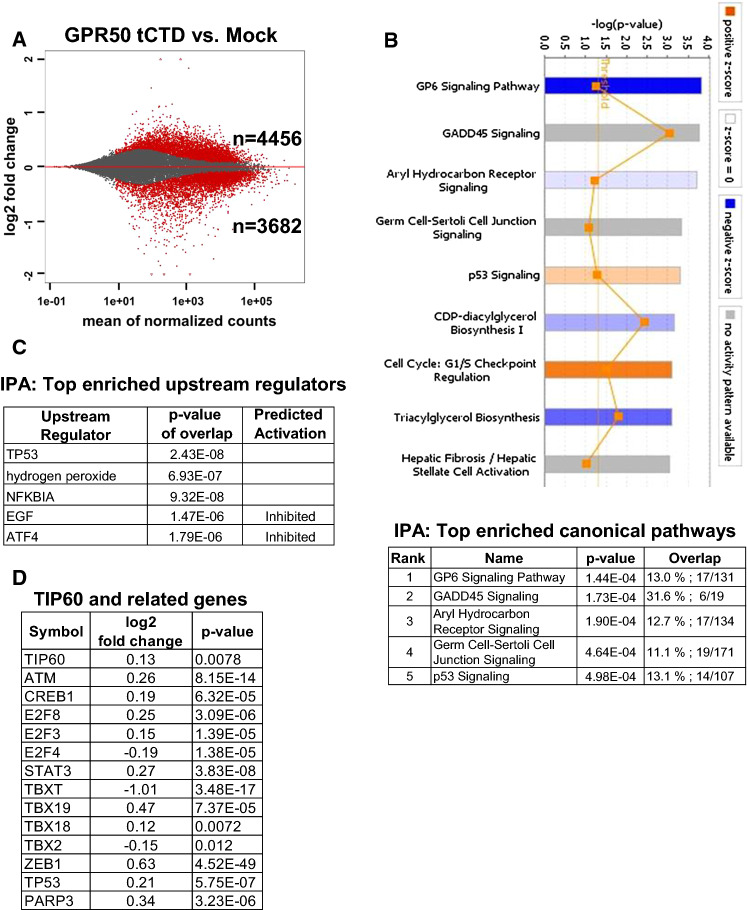
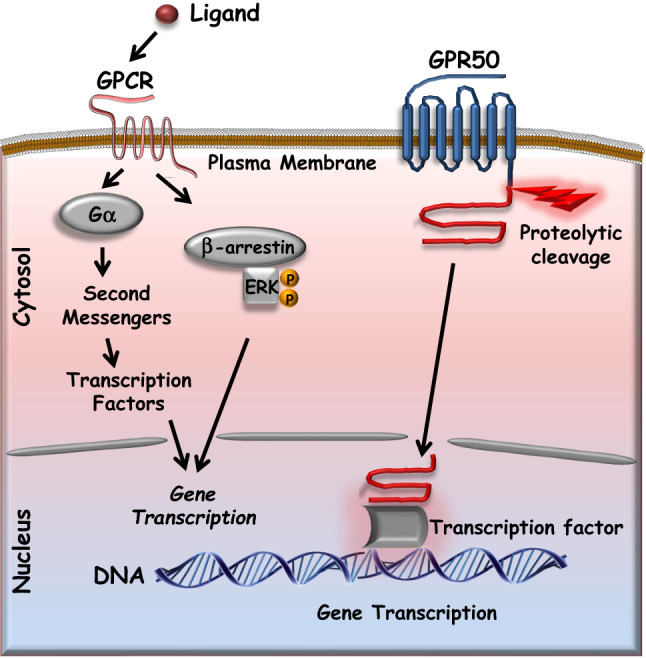
Transmission of extracellular signals by G protein-coupled receptors typically relies on a cascade of intracellular events initiated by the activation of heterotrimeric G proteins or β-arrestins followed by effector activation/inhibition. Here, we report an alternative signal transduction mode used by the orphan GPR50 that relies on the nuclear translocation of its carboxyl-terminal domain (CTD). Activation of the calcium-dependent calpain protease cleaves off the CTD from the transmembrane-bound GPR50 core domain between Phe-408 and Ser-409 as determined by MALDI-TOF-mass spectrometry. The cytosolic CTD then translocates into the nucleus assisted by its 'DPD' motif, where it interacts with the general transcription factor TFII-I to regulate c-fos gene transcription. RNA-Seq analysis indicates a broad role of the CTD in modulating gene transcription with ~ 8000 differentially expressed genes. Our study describes a non-canonical, direct signaling mode of GPCRs to the nucleus with similarities to other receptor families such as the NOTCH receptor.

Keywords: Calpain; GPCR; GPR50; Orphan; Proteolytic cleavage; Signal transduction.


Conflict of interest statement

The authors declare no competing financial interests.

Figures

Fig. 1
Fig. 1
Expression of full-length and truncated forms of GPR50. Western blots showing different forms of GPR50 in mouse brain lysates of WT and GPR50 knockout (KO) mice (left), and human lung carcinoma cells (NCI-H520) (middle) and HEK293 cells (right) transfected with empty (mock) or GPR50 expression plasmids. An anti-GPR50 antibody recognizing the last 13 amino acids of GPR50 was used as primary antibody. M monomer, D dimer, O higher molecular weight oligomers, tCTD truncated C-terminal domain. Asterisk indicates the location of the epitope recognized by the anti-GPR50 antibody. Representative results are shown. Similar results were obtained in at least two additional experiments. See also Supplementary Fig. 1
Fig. 2
Fig. 2
The truncated CTD of GPR50 is generated by proteolytic cleavage by calpain. Western blots showing abrogation of the generation of the truncated form of GPR50 (tGPR50) in HEK293 cells expressing the full-length GPR50 (a, b) or in human lung carcinoma cells (NCI-H520) expressing GPR50 endogenously (c) and treated overnight with the indicated serine/cysteine protease inhibitors in the absence (a, c) or presence of the lysosomal inhibitor chloroquine (CL, 25 µM; O/N) (b) (w/o, without inhibitor; Leu, Leupeptin 50 µM; Pep, Pepstatin 50 µM; ALLN, calpain 1 inhibitor 10 µM; ALLM, calpain 2 inhibitor 10 µM; E64d, thiol and cathepsin inhibitor 25 µM; Lacta, lactacystin 10 µM; MG132 10 µM proteasome inhibitor). Arrows indicate abrogation of tCTD generation. Western blots showing time-dependent generation of the tCTD in intact NCI-H520 cells following incubation with ionomycin (5 µM) (d) or cell lysates prepared from NCI-H520 cells (e) or HEK293 cells expressing the entire CTD of GPR50 flCTD (f). Cell lysates were supplemented with recombinant calpain 1 (1 U/mg protein) and 100 µM CaCl2 unless in -Ca2+ control conditions. Cells were pretreated or not with calpain 1 inhibitor (ALLN;10 µM; 1 h). Arrows indicate generation of tCTD. Representative results are shown for all panels. Similar results were obtained in at least two additional experiments. See also Supplementary Fig. 2
Fig. 3
Fig. 3
Determination of calpain cleavage site of GPR50 by MALDI-TOF-MS. a Amino acid sequence surrounding four predicted calpain cleavage sites (asterisk) of GPR50. Deleted residues of the following GPR50 mutants are underlined (GPR50∆C1: ∆396–405; GPR50∆C2: ∆406–412; GPR50∆C3: ∆396–412; GPR50∆C4: ∆469–477). b Western blot showing tCTD in the indicated GPR50 wt and deletion mutants expressed in HEK293 cells. c Kinetics (2, 5, 10 min) of calpain 1 in vitro cleavage of GPR50 in the presence of 100 µM, 500 µM and 1 mM of peptide YK17 and 500 µM and 1 mM of peptide AA17 (control) in NCI-H520 cell lysates. Note: arrows showing reduction in cleavage at particular peptide concentration. d Display of MS spectrum obtained after MALDI-TOF-MS analysis of peptide YK-17 (YRKSASTHHKSVFSHSK; 1987.2 Da) with solvent (DMSO) alone (upper panel; at 1 µM of peptide) or with recombinant calpain 1 (lower panel; 1 U/mg) at 1 pmol of peptide. Peaks representing the detected peptide fragments with their respective molecular weight which was confirmed by sequencing and analysis. Red box in lower part shows the peak of cleaved fragment that correspond to YF13 (YRKSASTHHKSVF; 1547.7 Da) peptide. Representative results are shown for panels, b, c. Similar results were obtained in at least two additional experiments. See also Supplementary Fig. 3
Fig. 4
Fig. 4
Nuclear localization of the tCTD of GPR50. a Confocal images of HEK293 cells expressing either the full-length GPR50 (upper panel) showing staining at the cell membrane and nucleus (white arrows), the tCTD (middle panel) showing predominant nuclear staining and the GPR50∆C2 construct showing staining at the cell membrane, but not the nucleus. GPR50 was stained with anti-GPR50 antibody, nuclei with DAPI (scale bar 10 µm). b Subcellular fractionation of HEK293 lysates of cells expressing either full-length GPR50 or tCTD showing nuclear localization of 35 kDa band (check arrow). c Subcellular fractionation of NCI-H520 cell lysates showing the nuclear localization of the 35 kDa band (tCTD) and its depletion (see arrow) in the presence of the calpain 1 inhibitor ALLN (10 µM, O/N). M, monomer of GPR50. d Confocal images of rat tanycytes stained with anti-GPR50 antibodies showing endogenous localization of GPR50. Zoom on nuclear localization. Staining of nuclei with DAPI (scale bar 10 µm). e Upper part: schematic representation of the flCTD of GPR50 and position of the ‘DPD’ motif mutated to APA; Lower part: Western blot showing reduced nuclear localization of APA flCTD. Quantification expressed as mean ± SEM, n = 4 independent experiments, *p < 0.05 two-tailed unpaired Student’s t test. Tubulin and lamin were used to detect the presence of cytosolic and nuclear proteins in different subcellular fractions. TCL total cell lysate, CF cytoplasmic fraction, NF nuclear fraction (panels b, c, e). Representative results are shown for panels ad. Similar results were obtained in at least two additional experiments. See also Supplementary Fig. 4
Fig. 5
Fig. 5
The tCTD of GPR50 interacts with TFII-I in nucleus and promotes gene transcription. a Identification of the general transcription factor TFII-I by mass spectrometry after tandem affinity purification (TAP) of full-length GPR50 stably expressed in HEK293 cells. b Coimmunoprecipitation (co-IP) experiments in total cell lysates (TCL) of transfected HEK293 cells (left panel) and of mouse brain (right panel), respectively. TFII-I was immunoprecipitated and GPR50 revealed in precipitates by Western blot with anti-GPR50 antibody. Non-relevant IgG were used as a negative control in transfected cells and lysates of GPR50KO mice as negative control of brain samples. M GPR50 monomer, tCTD truncated C-terminal domain. c Co-IP experiment with the nuclear fraction (NF) of HEK293 cells expressing the HA-tagged tCTD. HA-tCTD was immunoprecipitated and TFII-I revealed in precipitates by Western blot. Mock-transfected cells were used as a negative control. The purity of the NF was verified by detecting laminin (nuclear) and tubulin (cytosolic). d Confocal images of nuclear colocalization of HA-tagged tCTD and endogenous TFII-I in HEK293 cells. Staining of nuclei with DAPI (scale bar 10 µm). e, f Confocal images of colocalization of GPR50 and TFII-I in mouse brain slices around the third ventricle region (3 V) (overview in the right panels and focus on the middle and left panels) and in primary rat tanycyte cultures (f scale bar 10 µm). Arrowheads show colocalization in panel e. Staining of nuclei with DAPI. VMH ventromedian hypothalamus, ARC arcuate nucleus. Reporter gene assay showing relative c-fos luciferase promoter activity ± silencing of TFII-I by siRNA (g) and ± ALLN (10 µM, O/N) (h) in NIH3T3 cells expressing full-length GPR50 (GPR50, GPR50ΔTTGH variant), GPR50TM-YFP (mutant lacking the CTD and fused to the yellow fluorescent protein (YFP)), GPR50∆C2 (mutant lacking the calpain cleavage site) or the tCTD or in cells transfected with the empty vector (Mock). Values are expressed as mean ± SEM; n = 3 independent experiments; ****p < 0.001 and ***p < 0.001 vs. Mock Ctrl siRNA; •p < 0.001 significance of difference between Ctrl-siRNA vs. respective adjacent TFII-siRNA group; ns, non-significant difference (panel g); ***p < 0.001, significance of difference when compared to Mock Ctrl and •p < 0.0001, Ctrl vs ALLN of respective groups, (panel h), two-way ANOVA followed by Tukey’s post hoc multiple comparison test. Representative results are shown for panels bf. Similar results were obtained in at least two additional experiments. See also Supplementary Fig. 5
Fig. 6
Fig. 6
Genome-wide modulation of gene transcription by the tCTD of GPR50. a MA—plot showing differentially expressed genes (DEG) in HEK293 cells expressing stably the tCTD vs. mock-transfected HEK293 cells, where X-axis represents the mean of normalized counts and the Y-axis displays log2 fold changes in DSeq2 RNA-Seq experiment. b The upper panel shows bar diagram of top canonical pathways predicted by Ingenuity pathway analysis (IPA) of DEG based on significant –log p values (p < 0.05). Z score represents overall predicted activation state of pathway in comparison to available literature (if positive: activated, orange shades; if negative: inhibited, blue shades; if no activity pattern or neutral, gray). The lower panel displays the top five pathways with percent and number of DEG overlapping with canonical pathway in IPA analysis. c List of top upstream regulators after IPA analysis based on significant p values (< 0.05) and their predicted mode of activation. d List of TIP60 and related genes enriched in the RNA-Seq dataset with significant p value (< 0.05). See also Supplementary Tables 1–6
Fig. 7
Fig. 7
Canonical and non-canonical signaling pathways of GPCRs. The canonical signal transduction mode of G protein-coupled receptors (GPCR) involves ligand binding and either G protein activation, second messenger generation and eventually the regulation and nuclear translocation of transcription factors or β-arrestin recruitment and ERK activation and nuclear translocation. The non-canonical signal transduction mode of GPR50 involves the proteolytic cleavage of its cytosolic carboxyl-terminal domain (CTD) and the direct translocation of the CTD into the nucleus where it interacts with transcription factors to regulate gene transcription

Similar articles

Cited by

References

    1. Weis WI, Kobilka BK. The molecular basis of G protein-coupled receptor activation. Annu Rev Biochem. 2018;87:897–919. - PMC - PubMed
    1. Levoye A, Dam J, Ayoub MA, Guillaume JL, Jockers R. Do orphan G-protein-coupled receptors have ligand-independent functions? New insights from receptor heterodimers. EMBO Rep. 2006;7:1094–1098. - PMC - PubMed
    1. Ahmad R, Wojciech S, Jockers R. Hunting for the function of orphan GPCRs—beyond the search for the endogenous ligand. Br J Pharmacol. 2015;172:3212–3228. - PMC - PubMed
    1. Levoye A, Dam J, Ayoub MA, Guillaume JL, Couturier C, Delagrange P, Jockers R. The orphan GPR50 receptor specifically inhibits MT(1) melatonin receptor function through heterodimerization. EMBO J. 2006;25:3012–3023. - PMC - PubMed
    1. Wojciech S, Ahmad R, Belaid-Choucair Z, Journe AS, Gallet S, Dam J, Daulat A, Ndiaye-Lobry D, Lahuna O, Karamitri A, Guillaume JL, Do Cruzeiro M, Guillonneau F, Saade A, Clement N, Courivaud T, Kaabi N, Tadagaki K, Delagrange P, Prevot V, Hermine O, Prunier C, Jockers R. The orphan GPR50 receptor promotes constitutive TGFbeta receptor signaling and protects against cancer development. Nat Commun. 2018;9:1216. - PMC - PubMed

MeSH terms