. 2020 Nov;77(22):4631-4662.
doi: 10.1007/s00018-019-03427-4. Epub 2020 Jan 3.

Frizzled 1 and Wnt1 as new potential therapeutic targets in the traumatically injured spinal cord

Affiliations

Frizzled 1 and Wnt1 as new potential therapeutic targets in the traumatically injured spinal cord

Pau González et al. Cell Mol Life Sci. 2020 Nov.

Abstract

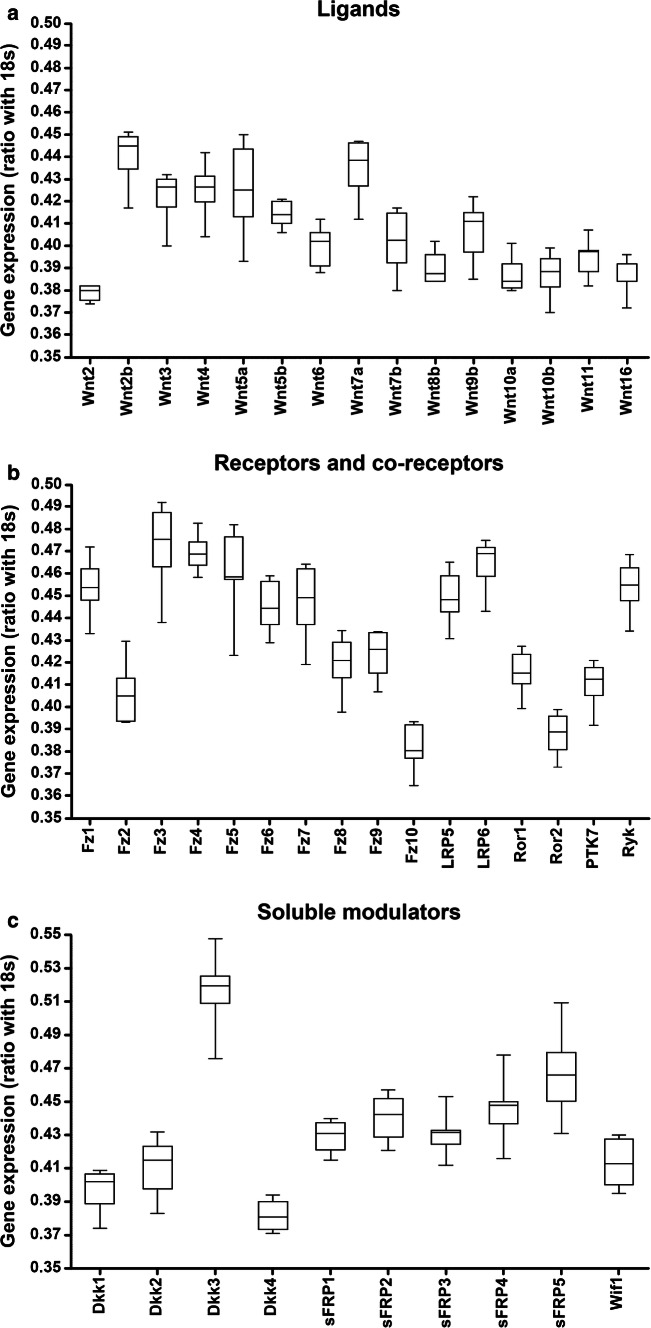
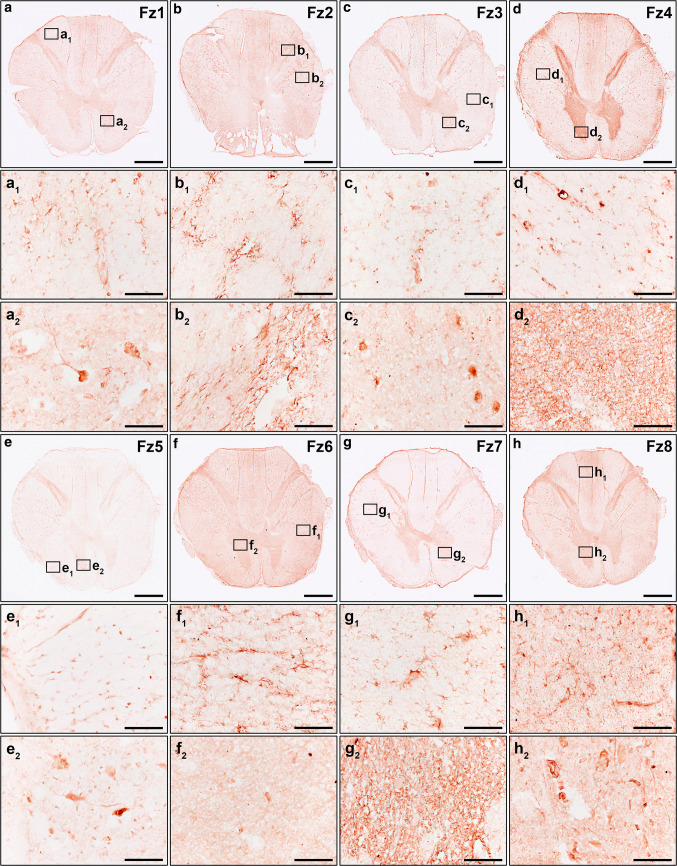
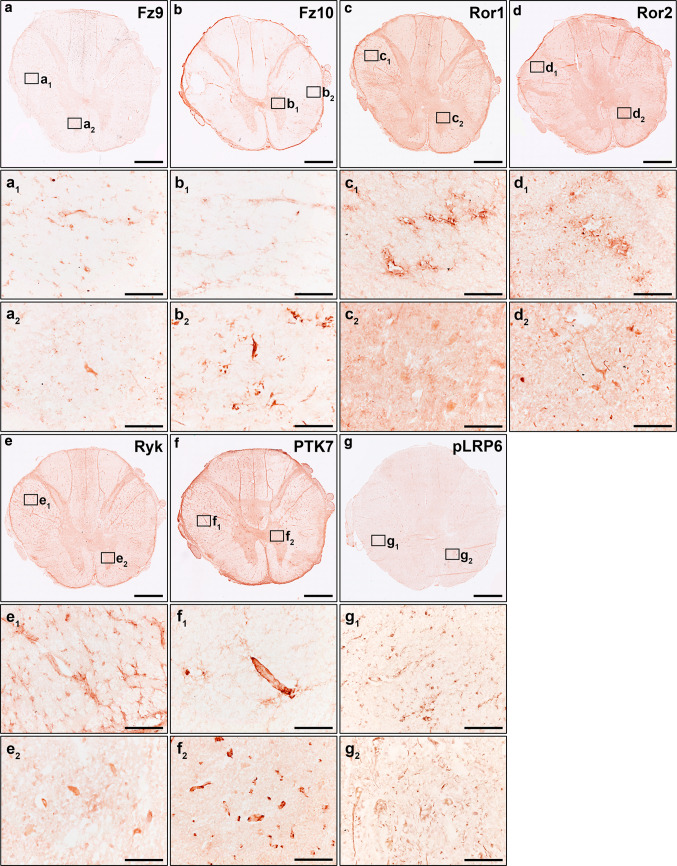
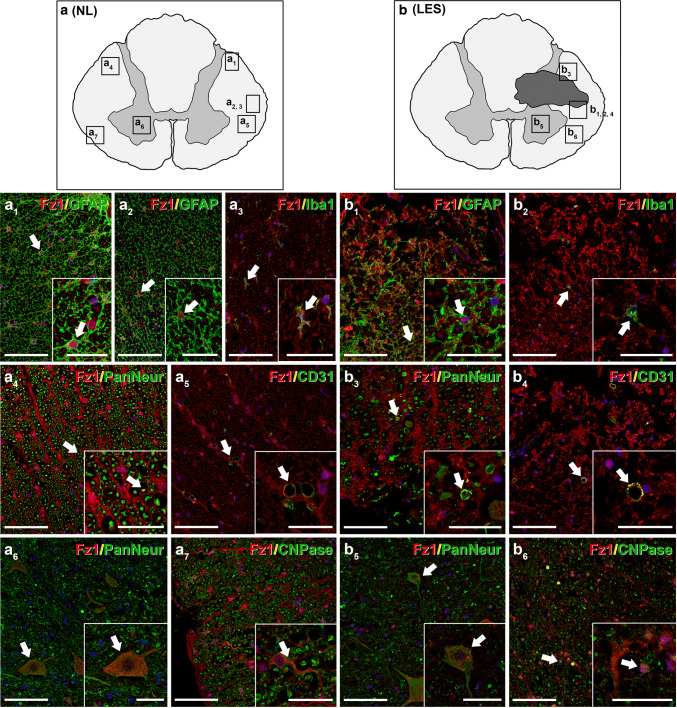
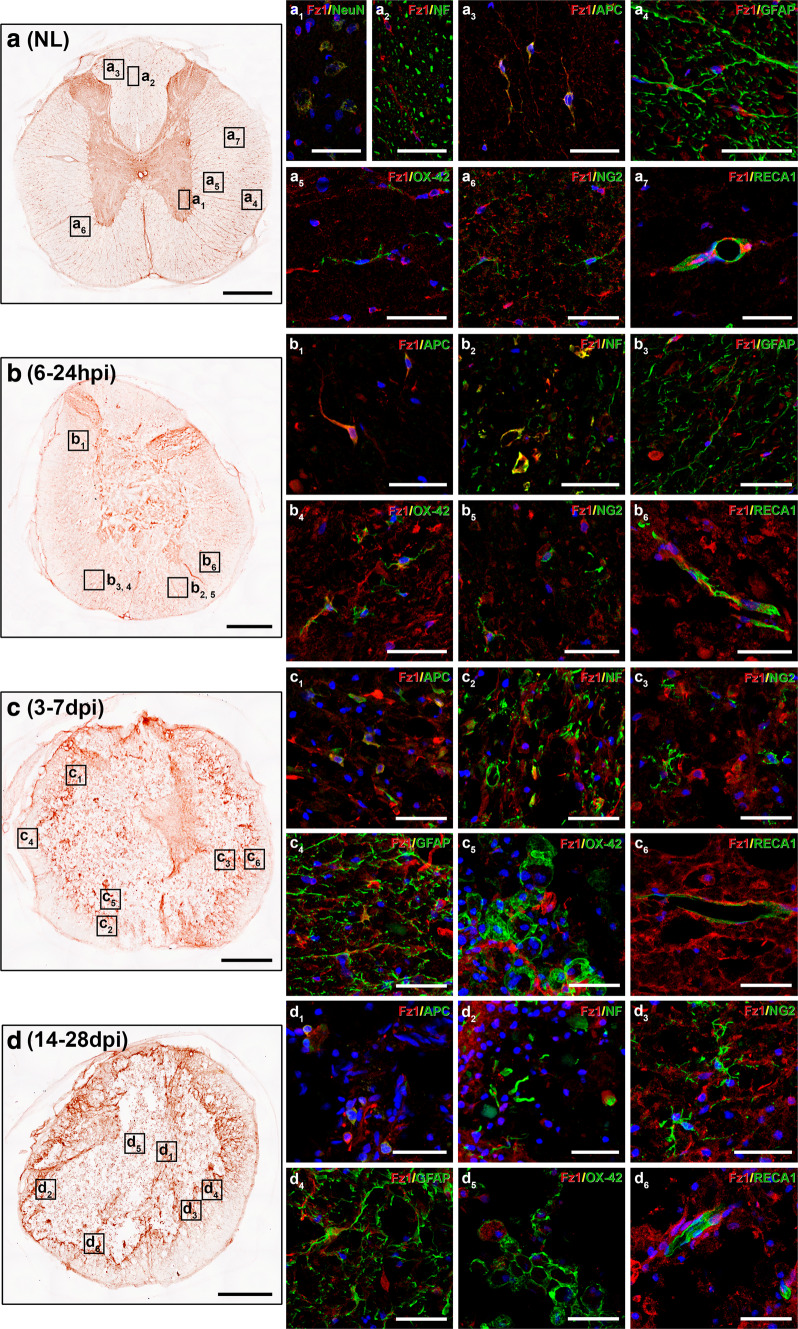
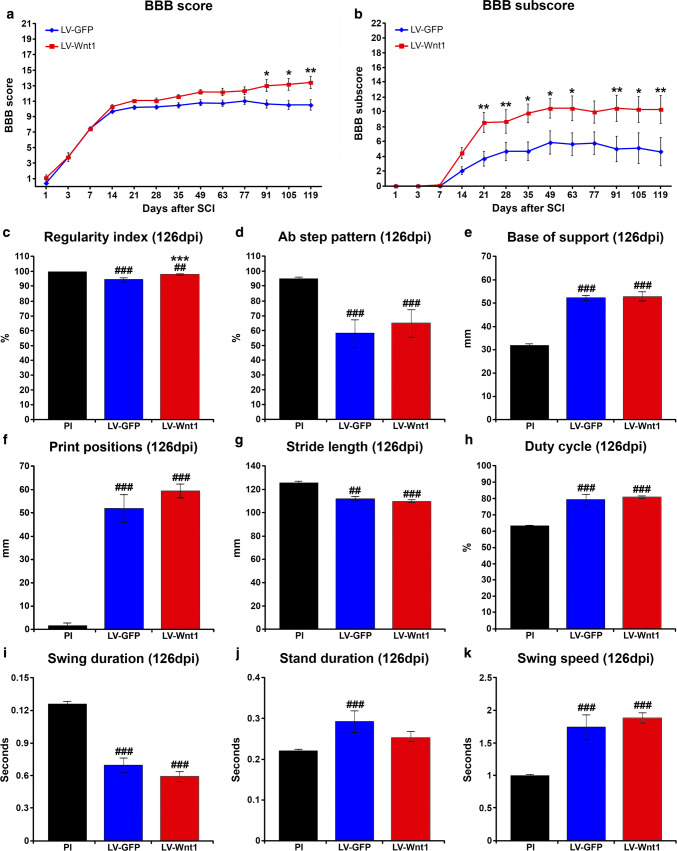
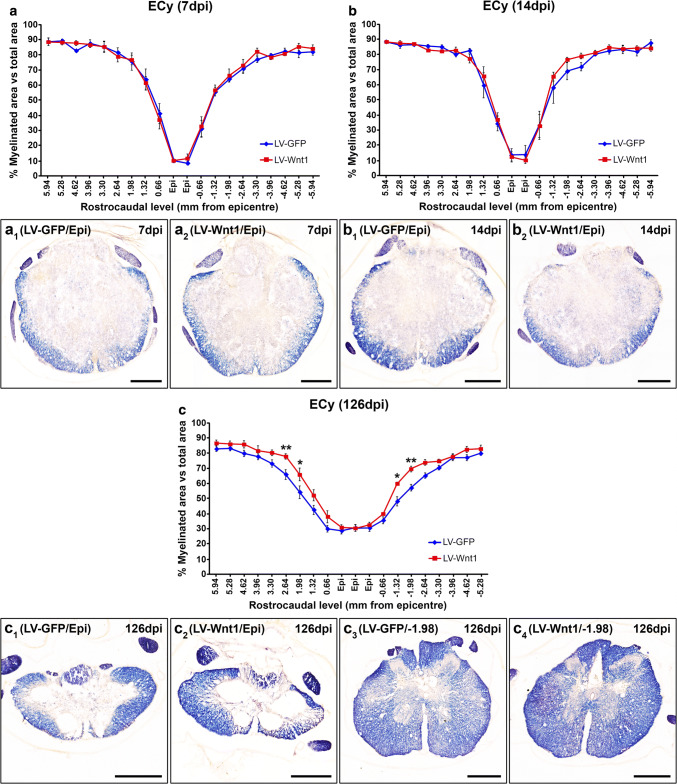
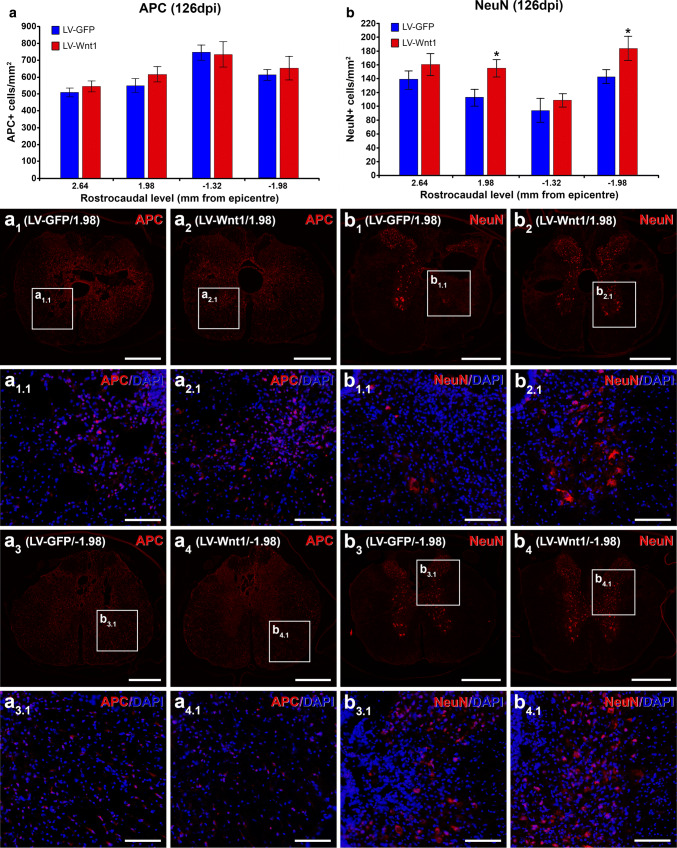
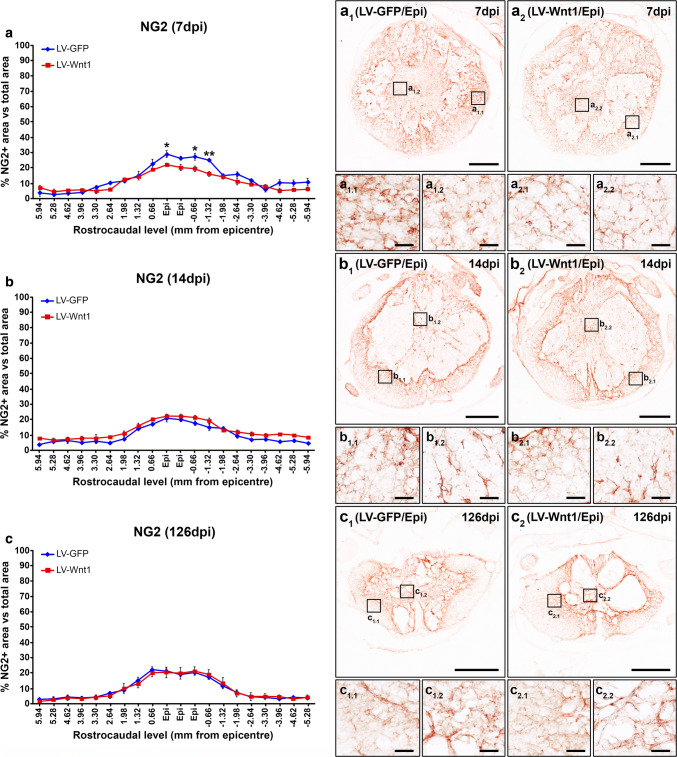
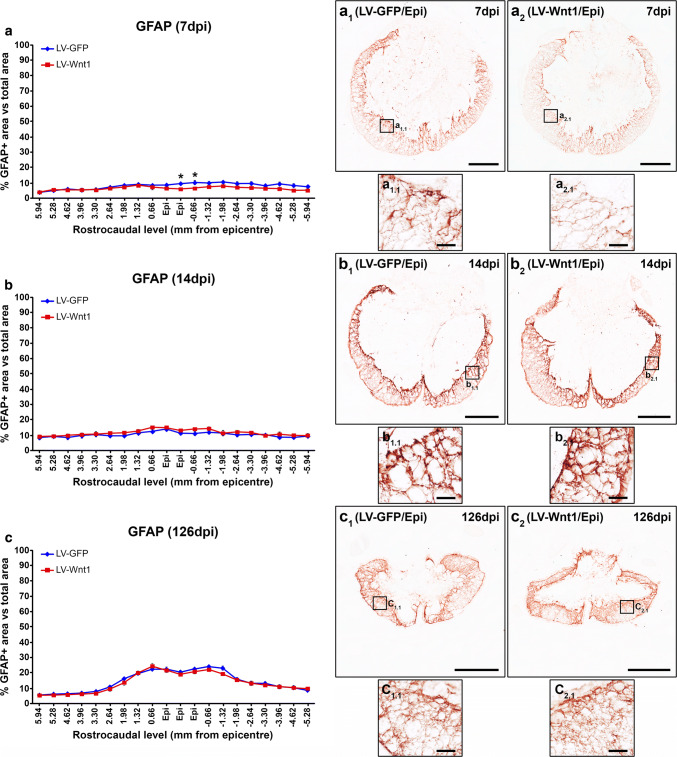
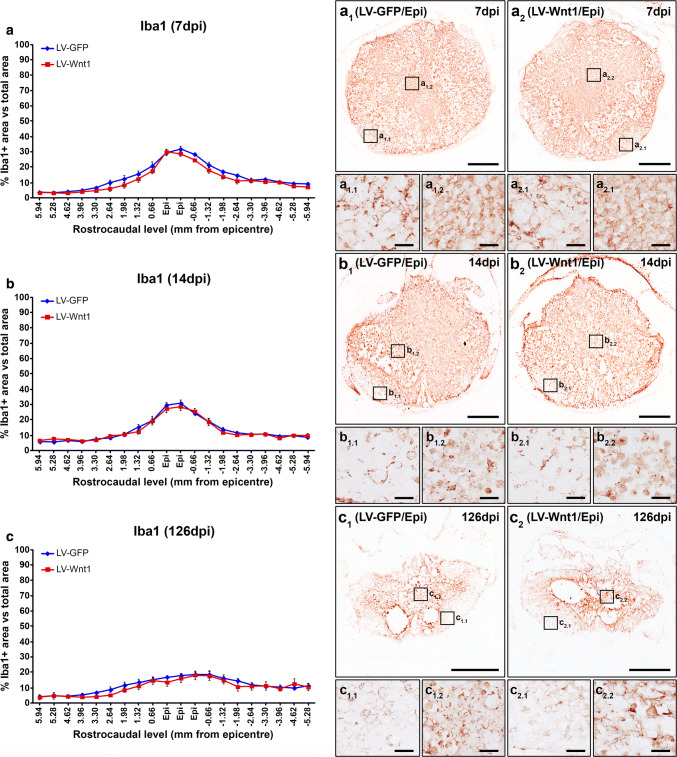
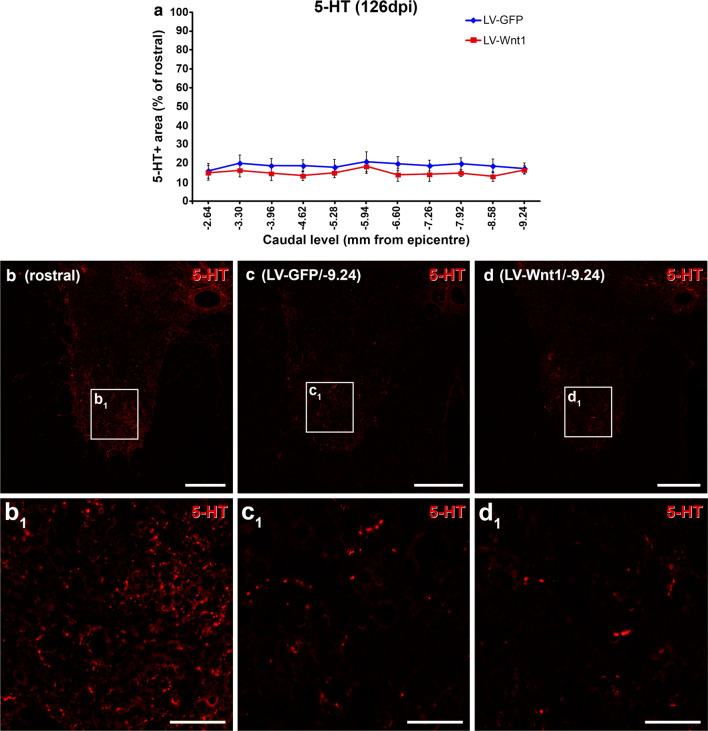
Despite the experimental evidence pointing to a significant role of the Wnt family of proteins in physiological and pathological rodent spinal cord functioning, its potential relevance in the healthy and traumatically injured human spinal cord as well as its therapeutic potential in spinal cord injury (SCI) are still poorly understood. To get further insight into these interesting issues, we first demonstrated by quantitative Real-Time PCR and simple immunohistochemistry that detectable mRNA expression of most Wnt components, as well as protein expression of all known Wnt receptors, can be found in the healthy human spinal cord, supporting its potential involvement in human spinal cord physiology. Moreover, evaluation of Frizzled (Fz) 1 expression by double immunohistochemistry showed that its spatio-temporal and cellular expression pattern in the traumatically injured human spinal cord is equivalent to that observed in a clinically relevant model of rat SCI and suggests its potential involvement in SCI progression/outcome. Accordingly, we found that long-term lentiviral-mediated overexpression of the Fz1 ligand Wnt1 after rat SCI improves motor functional recovery, increases myelin preservation and neuronal survival, and reduces early astroglial reactivity and NG2+ cell accumulation, highlighting the therapeutic potential of Wnt1 in this neuropathological situation.

Keywords: Frizzled 1; Human; Rat; Spinal cord injury; Wnt; Wnt1.


Conflict of interest statement

The authors declare that they have no conflicts of interest.

Figures

Fig. 1
Fig. 1
mRNA expression of the Wnt family of proteins in the healthy human spinal cord. This figure shows data obtained from the evaluation, by quantitative Real-Time PCR, of the mRNA expression of the different components of the Wnt family of proteins in the healthy human spinal cord (n = 7). As shown, we found detectable mRNA expression of most Wnt ligands (Wnt2, 2b, 3, 4, 5a, 5b, 6, 7a, 7b, 8b, 9b, 10a, 10b, 11, and 16) (a), receptors [Frizzled (Fz)1–10, receptor tyrosine kinase-like orphan receptor (Ror) 1 and 2, protein tyrosine kinase 7 (PTK7) and Ryk] (b), co-receptors [low-density lipoprotein receptor protein (LRP) 5 and 6] (b), and soluble modulators [Dickkopf (Dkk) 1–4, secreted Frizzled-related proteins (sFRP) 1–5 and the Wnt inhibitory factor 1 (Wif1)] (c) in the human spinal cord under physiological conditions. Data are presented as the ratio between each gene of interest and 18s
Fig. 2
Fig. 2
Protein expression of Wnt receptors in the healthy human spinal cord I. This figure shows representative images from the immunohistochemical evaluation of the protein expression of Frizzled (Fz) 1 (a, a1, a2), 2 (b, b1, b2), 3 (c, c1, c2), 4 (d, d1, d2), 5 (e, e1, e2), 6 (f, f1, f2), 7 (g, g1, g2), and 8 (h, h1, h2) in the healthy human spinal cord (n = 5). Squares in a–h indicate the areas shown in the corresponding higher magnification images. Scale bars in ah = 2 mm; scale bars in a1h2 = 100 µm
Fig. 3
Fig. 3
Protein expression of Wnt receptors in the healthy human spinal cord II. This figure shows representative images from the immunohistochemical evaluation of the protein expression of Frizzled (Fz) 9 (a, a1, a2) and 10 (b, b1, b2), receptor tyrosine kinase-like orphan receptor (Ror) 1 (c, c1, c2) and 2 (d, d1, d2), Ryk (e, e1, e2), protein tyrosine kinase 7 (PTK7) (f, f1, f2), and the phosphorylated active form of the low-density lipoprotein receptor protein 6 (pLRP6) (g, g1, g2) in the healthy human spinal cord (n = 5). Squares in ag indicate the areas shown in the corresponding higher magnification images. Scale bars in ag = 2 mm; scale bars in a1g2 = 100 µm
Fig. 4
Fig. 4
Expression pattern of Fz1 in the non-lesioned (NL) and injured human spinal cord. This figure shows representative images from the immunohistochemical evaluation of Frizzled (Fz) 1 expression in astrocytes [glial fibrillary acidic protein (GFAP)] (a, a1, a2, b, b1), microglia/macrophages [ionized calcium-binding adaptor molecule 1 (Iba1)] (a, a3, b, b2), axons (a, a4, b, b3), and neuronal somas (a, a6, b, b5) [Pan Neuronal Marker (PanNeur)], endothelial cells (CD31) (a, a5, b, b4) and oligodendrocytes [2′,3′-cyclic nucleotide-3′-phosphodiesterase (CNPase)] (a, a7, b, b6) in the NL (n = 4) (a, a1–7) and traumatically injured human spinal cord (LES) (n = 6) (b, b16). a, b correspond to schematic drawings of prototypical NL and lesioned human spinal cord sections, respectively, indicating the approximate areas shown in the corresponding images. Scale bars in a1–7 and b1–6 = 100 µm; scale bars in image insets = 40 µm
Fig. 5
Fig. 5
Expression pattern of Fz1 in the non-lesioned (NL) and injured rat spinal cord. This figure shows representative images obtained from the evaluation by simple (ad) and double immunohistochemistry (a1d6) of the spatial and cellular expression of Frizzled (Fz) 1 in the NL rat spinal cord and after SCI at 6 and 24 h post-injury (hpi) and 3, 7, 14, and 28 days post-injury (dpi) (n = 5 per group). Double immunohistochemistry was used to evaluate Fz1 expression in neurons [neuronal nuclei (NeuN)] (a1) axons [neurofilament 200 (NF)] (a2, b2, c2, d2), oligodendrocytes [adenomatous polyposis coli (APC)] (a3, b1, c1, d1), astrocytes [glial fibrillary acidic protein (GFAP)] (a4, b3, c4, d4), microglia/macrophages (OX-42) (a5, b4, c5, d5), NG2+ cells (NG2) (a6, b5, c3, d3), and endothelial cells (RECA1) (a7, b6, c6, d6). Squares in ad indicate the approximate areas shown in the corresponding images. Scale bars in ad = 500 µm; scale bars in a1d6 = 40 µm
Fig. 6
Fig. 6
Wnt1 overexpression in motor functional recovery after SCI. This figure shows the BBB score (a) and subscore (b) data obtained from the evaluation of motor functional recovery using the 21-point BBB open-field test, as well as data obtained from the analysis of relevant gait parameters using the CatWalk® gait analysis system (ck), in lesioned animals injected with a lentiviral vector that only induce the expression of the green fluorescence protein (GFP) (LV-GFP) or with a lentiviral vector that induce the expression of both GFP and Wnt1 (LV-Wnt1). The 21-point BBB open-field test was carried out at 1, 3, 7, 14, 21, 35, 49, 63, 77, 91, 105, and 119 days post-injury (dpi), and data obtained from all animals used to evaluate the effects exerted by Wnt1 overexpression, which were sacrificed at 7 (n = 5 per group), 14 (n = 5 per group), and 126 dpi (LV-GFP, n = 10; LV-Wnt1, n = 7), were included in the analysis. The analysis of the different gait parameters was performed either before injury [pre-injury (PI)] or at 126 dpi in animals displaying consistent stepping (LV-GFP, n = 3; LV-Wnt1, n = 5) (ck). The existence of statistically significant differences between groups in a and b was assessed by two-way ANOVA, while, in ck, one-way ANOVA was used. In both cases, Bonferroni post hoc test was used. Data are presented as the mean ± SEM. *p < 0.05, **p < 0.01 and ***p < 0.001 vs. LV-GFP; ##p < 0.01 and ###p < 0.001 vs. PI
Fig. 7
Fig. 7
Wnt1 overexpression in myelin preservation after SCI. This figure shows the data (ac) and representative images (a1c4) obtained from the quantification of myelin preservation in eriochrome cyanine staining (ECy) processed spinal cord sections from lesioned animals injected with a lentiviral vector that only induce the expression of the green fluorescence protein (GFP) (LV-GFP) (n = 10) or with a lentiviral vector that induce the expression of both GFP and Wnt1 (LV-Wnt1) (n = 7). Evaluation was performed at 7 (a, a1, a2), 14 (b, b1, b2), and 126 (c, c1–4) days post-injury (dpi). Scale bars in a1c4 = 500 µm. The existence of statistically significant differences between groups was assessed by two-way ANOVA followed by Bonferroni post hoc test. Data are presented as the mean ± SEM. *p < 0.05 and **p < 0.01 vs. LV-GFP
Fig. 8
Fig. 8
Wnt1 overexpression in oligodendroglial and neuronal cell number after SCI. This figure shows the data and representative images obtained from the quantification of oligodendroglial (aa4.1) and neuronal (bb4.1) cell number in spinal cord sections, processed for the immunohistochemical visualization of adenomatous polyposis coli (APC) or neuronal nuclei (NeuN), from lesioned animals injected with a lentiviral vector that only induce the expression of the green fluorescence protein (GFP) (LV-GFP) (n = 10) or with a lentiviral vector that induce the expression of both GFP and Wnt1 (LV-Wnt1) (n = 7). The analysis was performed at 126 days post-injury (dpi) in spinal cord levels where the significant differences in myelin preservation were observed (2.64, 1.98, − 1.32, and − 1.98 mm from epicenter). Squares in a1–4 and b1–4 indicate the areas shown in the corresponding images. Scale bars in a1–4 and b1–4 = 500 µm; scale bars in a1.14.1 and b1.14.1 = 100 µm. The existence of statistically significant differences between groups in each analyzed rostro-caudal level was assessed by two-tailed t test. Data are presented as the mean ± SEM. *p < 0.05 vs. LV-GFP
Fig. 9
Fig. 9
Wnt1 overexpression in NG2 immunoreactivity after SCI. This figure shows the data (ac) and representative images (a1c2) obtained from the quantification of the area occupied by NG2 immunoreactivity in spinal cord sections from lesioned animals injected with a lentiviral vector that only induce the expression of the green fluorescence protein (GFP) (LV-GFP) (n = 10) or with a lentiviral vector that induce the expression of both GFP and Wnt1 (LV-Wnt1) (n = 7). Evaluation was performed at 7 (a, a12 and a1.12.2), 14 (b, b12 and b1.12.2), and 126 (c, c12 and c1.12.2) days post-injury (dpi). Squares in a1c2 indicate the areas shown in the corresponding images. Scale bars in a1c2 = 500 µm; scale bars in a1.1c2.2 = 40 µm. The existence of statistically significant differences between groups was assessed by two-way ANOVA followed by Bonferroni post hoc test. Data are presented as the mean ± SEM. *p < 0.05 and **p < 0.01 vs. LV-GFP
Fig. 10
Fig. 10
Wnt1 overexpression in astroglial reactivity after SCI. This figure shows the data (ac) and representative images (a1c2) obtained from the quantification of the area occupied by glial fibrillary acidic protein (GFAP) immunoreactivity in spinal cord sections from lesioned animals injected with a lentiviral vector that only induce the expression of the green fluorescence protein (GFP) (LV-GFP) (n = 10) or with a lentiviral vector that induce the expression of both GFP and Wnt1 (LV-Wnt1) (n = 7). Evaluation was performed at 7 (a, a12 and a1.12.1), 14 (b, b12 and b1.12.1), and 126 (c, c12 and c1.12.1) days post-injury (dpi). Squares in a1c2 indicate the areas shown in the corresponding images. Scale bars in a1c2 = 500 µm; scale bars in a1.1c2.1 = 40 µm. The existence of statistically significant differences between groups was assessed by two-way ANOVA followed by Bonferroni post hoc test. Data are presented as the mean ± SEM. *p < 0.05 vs. LV-GFP
Fig. 11
Fig. 11
Wnt1 overexpression in microglia/macrophage reactivity after SCI. This figure shows the data (ac) and representative images (a1c2) obtained from the quantification of the area occupied by ionized calcium-binding adaptor molecule 1 (Iba1) immunoreactivity in spinal cord sections from lesioned animals injected with a lentiviral vector that only induce the expression of the green fluorescence protein (GFP) (LV-GFP) (n = 10) or with a lentiviral vector that induce the expression of both GFP and Wnt1 (LV-Wnt1) (n = 7). Evaluation was performed at 7 (a, a1–2 and a1.12.2), 14 (b, b12 and b1.12.2), and 126 (c, c12 and c1.12.2) days post-injury (dpi). Scale bars in a1c2 = 500 µm; scale bars in a1.1c2.2 = 40 µm. The existence of statistically significant differences between groups was assessed by two-way ANOVA followed by Bonferroni post hoc test. Data are presented as the mean ± SEM
Fig. 12
Fig. 12
Wnt1 overexpression in motor serotonergic innervation after SCI. This figure shows the data (a) and representative images (bd1) obtained from the densitometrical quantification of the area occupied by serotonin (5-HT) immunoreactivity in spinal cord sections from lesioned animals injected with a lentiviral vector that only induce the expression of the green fluorescence protein (GFP) (LV-GFP) (n = 10) or with a lentiviral vector that induce the expression of both GFP and Wnt1 (LV-Wnt1) (n = 7). The analysis was carried out at 126 days post-injury (dpi) in the ventral horns of spinal cord sections corresponding to different spinal cord levels caudal to the injury site. Squares in bd indicate the areas shown in the corresponding images. Scale bars in bd = 150 µm; scale bars in b1d1 = 40 µm. The existence of statistically significant differences between groups was assessed by two-way ANOVA followed by Bonferroni post hoc test. Data are presented as the mean ± SEM

Similar articles

Cited by

References

    1. Grainger S, Willert K (2018) Mechanisms of Wnt signaling and control. Wiley Interdiscip Rev Syst Biol Med. 10.1002/wsbm.1422 - PMC - PubMed
    1. van Amerongen R. Alternative Wnt pathways and receptors. Cold Spring Harb Perspect Biol. 2012;4(10):a007914. doi: 10.1101/cshperspect.a007914. - DOI - PMC - PubMed
    1. Niehrs C. The complex world of WNT receptor signalling. Nat Rev Mol Cell Biol. 2012;13(12):767–779. doi: 10.1038/nrm3470. - DOI - PubMed
    1. Engelhardt B, Liebner S. Novel insights into the development and maintenance of the blood–brain barrier. Cell Tissue Res. 2014;355(3):687–699. doi: 10.1007/s00441-014-1811-2. - DOI - PMC - PubMed
    1. Brafman D, Willert K. Wnt/beta-catenin signaling during early vertebrate neural development. Dev Neurobiol. 2017;77(11):1239–1259. doi: 10.1002/dneu.22517. - DOI - PMC - PubMed