. 2020 Jan 3;5(43):eaay1863.
doi: 10.1126/sciimmunol.aay1863.

Targeted deletion of PD-1 in myeloid cells induces antitumor immunity

Affiliations

Targeted deletion of PD-1 in myeloid cells induces antitumor immunity

Laura Strauss et al. Sci Immunol. .

Abstract

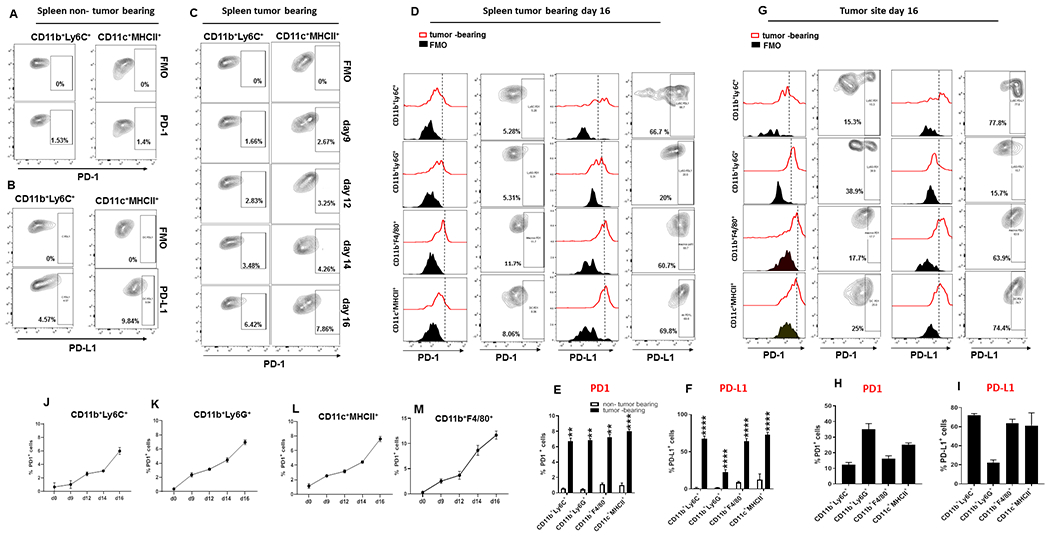
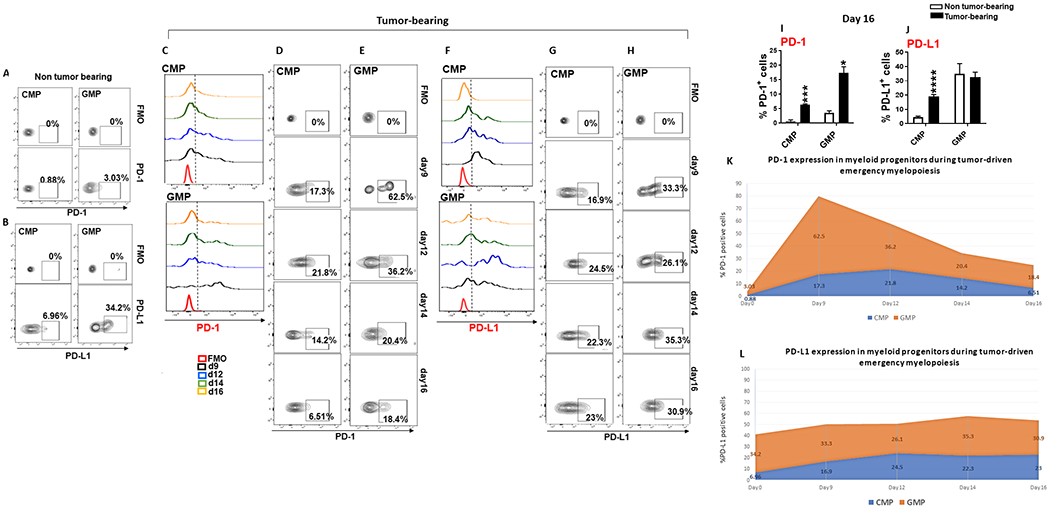
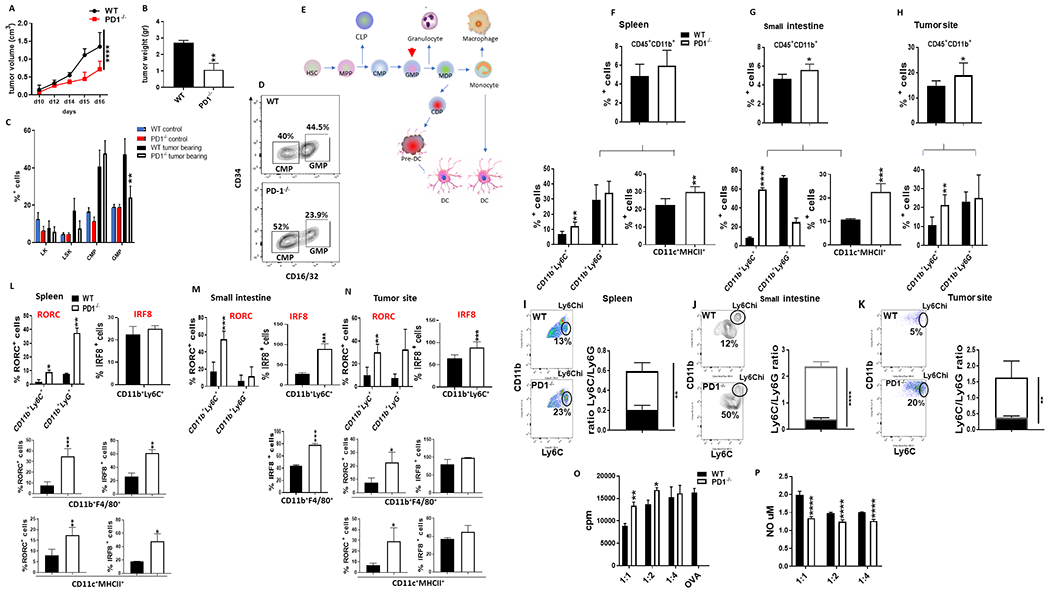
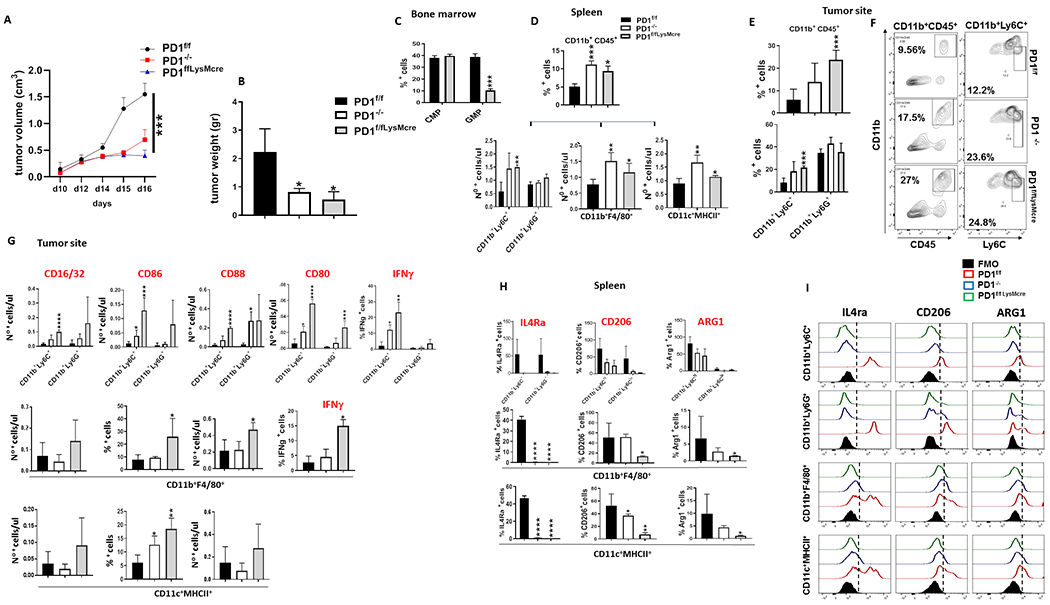
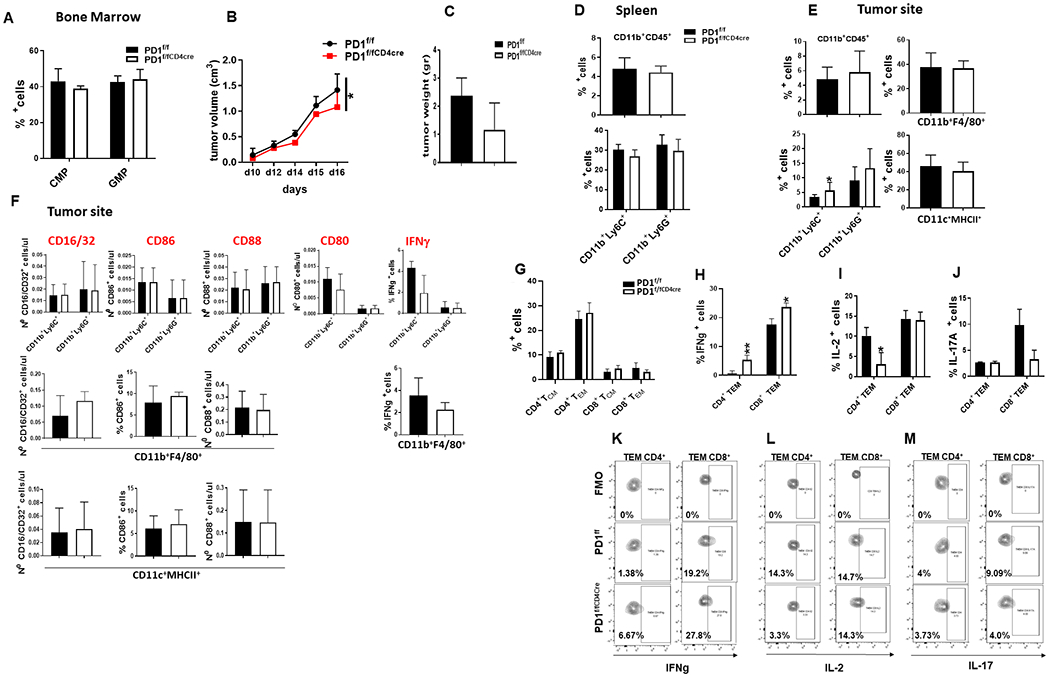
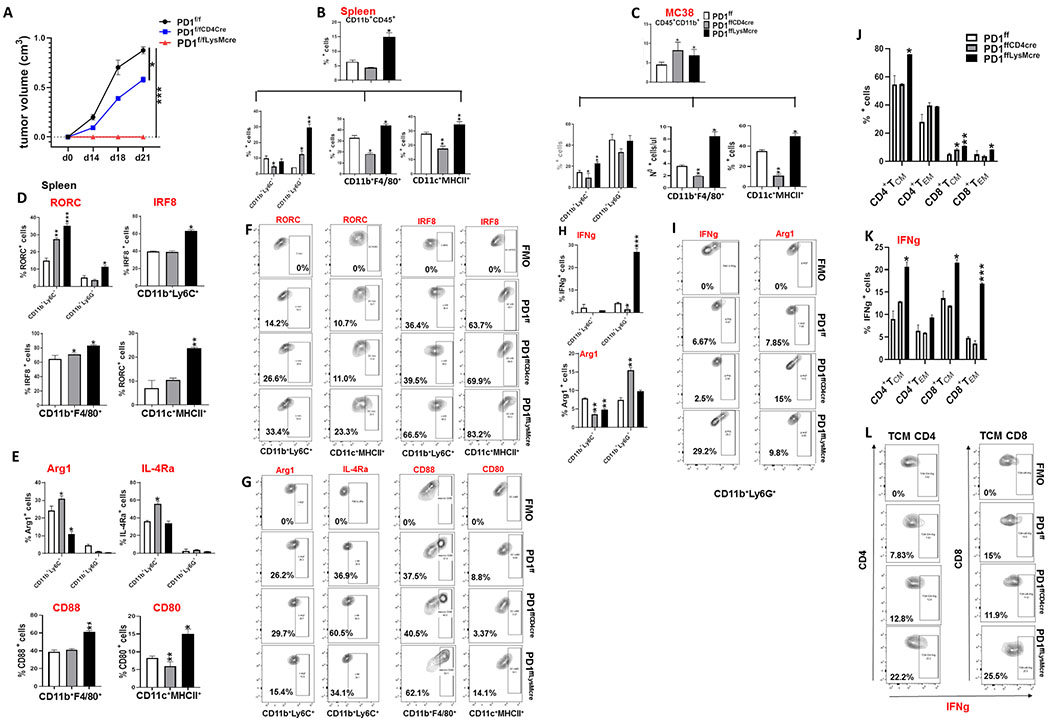
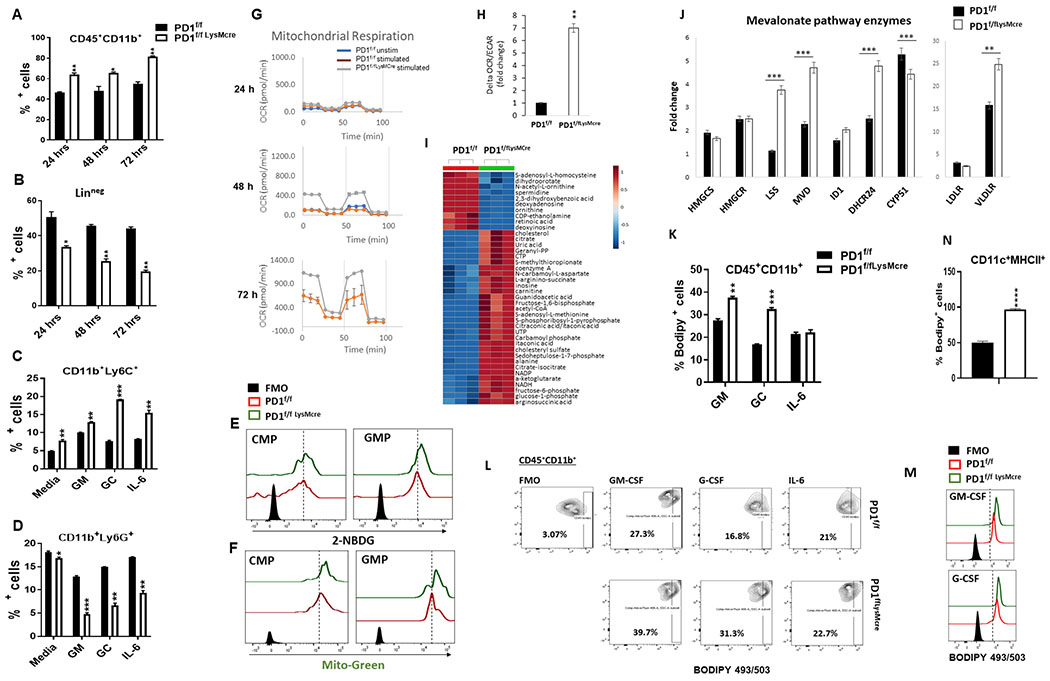
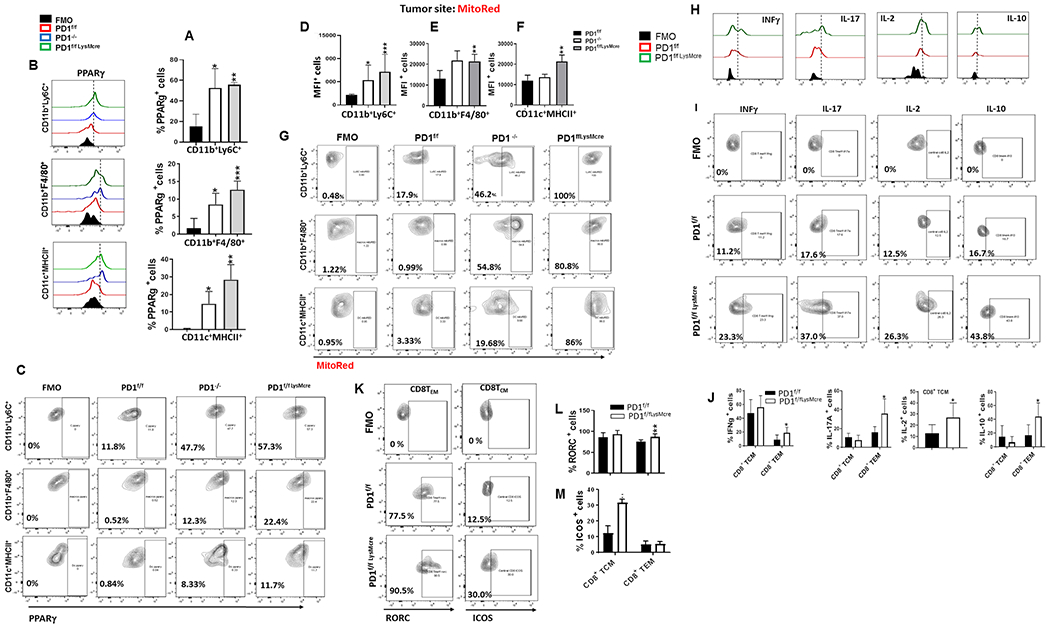
PD-1, a T cell checkpoint receptor and target of cancer immunotherapy, is also expressed on myeloid cells. The role of myeloid-specific versus T cell-specific PD-1 ablation on antitumor immunity has remained unclear because most studies have used either PD-1-blocking antibodies or complete PD-1 KO mice. We generated a conditional allele, which allowed myeloid-specific (PD-1f/fLysMcre) or T cell-specific (PD-1f/fCD4cre) targeting of Pdcd1 gene. Compared with T cell-specific PD-1 ablation, myeloid cell-specific PD-1 ablation more effectively decreased tumor growth. We found that granulocyte/macrophage progenitors (GMPs), which accumulate during cancer-driven emergency myelopoiesis and give rise to myeloid-derived suppressor cells (MDSCs), express PD-1. In tumor-bearing PD-1f/fLysMcre but not PD-1f/fCD4cre mice, accumulation of GMP and MDSC was prevented, whereas systemic output of effector myeloid cells was increased. Myeloid cell-specific PD-1 ablation induced an increase of T effector memory cells with improved functionality and mediated antitumor protection despite preserved PD-1 expression in T cells. In PD-1-deficient myeloid progenitors, growth factors driving emergency myelopoiesis induced increased metabolic intermediates of glycolysis, pentose phosphate pathway, and TCA cycle but, most prominently, elevated cholesterol. Because cholesterol is required for differentiation of inflammatory macrophages and DC and promotes antigen-presenting function, our findings indicate that metabolic reprogramming of emergency myelopoiesis and differentiation of effector myeloid cells might be a key mechanism of antitumor immunity mediated by PD-1 blockade.


Conflict of interest statement

Competing interests: Vassiliki A. Boussiotis has patents on the PD-1 pathway licensed by Bristol-Myers Squibb, Roche, Merck, EMD-Serono, Boehringer Ingelheim, AstraZeneca, Novartis and Dako. The authors report no other competing interests related to this work.

Figures

Figure 1:
Figure 1:. PD-1 and PD-L1 are expressed on myeloid cells that expand in tumor-bearing mice.
(A-B) Expression of PD-1 and PD-L1 on CD11b+Ly6C+ monocytes and CD11c+MHCII+ DC in the spleen of non-tumor bearing C57BL/6 mice. (C) C57BL/6 mice were inoculated with B16-F10 mouse melanoma and at the indicated time points, expression of PD-1 was examined by flow cytometry in the spleen after gating on the indicated myeloid populations; contour plots depicting % positive cells are shown. On day 16 after tumor inoculation, expression of PD-1 and PD-L1 was assessed in the spleen (D) and the tumor site (G) after gating on the indicated myeloid populations. (D, G) FACS histograms and contour plots depicting % positive cells, and bar graphs (E, F, H, I) of mean ± SEM positive cells. Results are representative of 12 independent experiments with 6 mice per group. (J-M) Kinetics of PD-1 upregulation on CD11b+Ly6C+, CD11b+Ly6G+, CD11b+F4/80+ and CD11c+MHCII+ of the spleen after tumor inoculation.
Figure 2:
Figure 2:. PD-1 and PD-L1 is expressed on CMP and GMP myeloid progenitors during cancer-driven emergency myelopoiesis.
(A-B) Expression of PD-1 and PD-L1 on CMP and GMP of non-tumor bearing mice. (C-J) C57BL/6 mice were inoculated with B16-F10 mouse melanoma and expression of PD-1 and PD-L1 on CMP and GMP was examined on days 9, 12, 14 and 16 after implantation. FACS histograms (C, F), contour plots (D, E, G, H) indicating % positive cells and bar graphs of mean ± SEM positive cells (I, J) are shown. Results are representative of 4 independent experiments with 6 mice per group. (K, L) Kinetics of PD-1 (K) and PD-L1 (L) expression on CMP (blue) and GMP (orange) during tumor-driven emergency myelopoiesis. Results are representative of four separate experiments with 6 mice per group.
Figure 3.
Figure 3.. PD-1 ablation alters emergency myelopoiesis and the profile of myeloid cell output.
(A, B) WT and PD-1−/− mice were inoculated with B16-F10 melanoma and tumor size was monitored daily (A). Mice were euthanized on day 16 and tumor weight was measured (B). Data shown are the mean ± SEM of 6 mice/group and are representative of six independent experiments. (C) Mean percentages ± SEM of LK, LSK, CMP and GMP in the bone marrow of non tumor-bearing and tumor-bearing WT and PD-1−/− mice. GMP in PD-1−/− mice were significantly lower compared to GMP in WT mice (** p< 0.01). (D) Representative contour plots of FACS analysis for CMP and GMP in the bone marrow of tumor-bearing WT and PD-1−/− mice. (E) Schematic presentation of myeloid lineage differentiation. Arrowhead indicates GMP, the key target population of PD-1 during emergency myelopoiesis. (F-H) Mean percentages of CD45+CD11b+, CD11b+Ly6C+, CD11b+Ly6G+ and CD11c+MHCII+ in the spleen (F), small intestine (G), and B16-F10 site (H) of tumor-bearing WT and PD-1−/− mice. (I-K) Representative plots of FACS analysis for CD11b+Ly6Chi and CD11b+Ly6C+/ CD11b+Ly6G+ ratio in the spleen (I), small intestine (J) and B16-F10 site (K). (L-N) Mean percentages ± SEM of RORC and IRF8 expressing CD11b+Ly6C+, CD11b+Ly6G+, CD11b+F4/80+ and CD11c+MHCII+ myeloid cells within the CD45+CD11b+ gate in spleen (L), small intestine (M), and B16-F10 site (N). Data from one representative experiment out of three independent experiments with 6 mice per group is shown. (O-P) Diminished suppressive activity (O) and NO production (P) of CD11b+Ly6C+ cells isolated from PD-1−/− tumor bearing mice. CD11b+Ly6C+ cells were isolated from tumor-bearing WT and PD-1−/− mice and cultured at various ratios with OTI splenocytes stimulated with OVA257-264. Data show the mean ± SEM of one representative of two experiments (*p<0.05, **p<0.01, ***p<0.001). HSC, hematopoietic stem cells; CMP, common myeloid progenitor; GMP, granulocyte and macrophage progenitor.
Figure 4.
Figure 4.. Myeloid-specific PD-1 ablation is the driver of altered tumor-driven emergency myelopoiesis, inflammatory myeloid cell differentiation and anti-tumor immunity.
(A, B) PD-1f/f, PD-1f/fLysMcre and PD-1−/− mice were inoculated with B16-F10 melanoma and tumor size was monitored daily (A). After mice were euthanized, tumor weight was measured (B). (C) Mean percentages ± SEM of CMP and GMP in the bone marrow of tumor-bearing PD-1f/f and PD-1f/fLysMcre mice (D) Mean percentages ± SEM of CD11b+CD45+ cells and CD11b+Ly6C+, CD11b+Ly6G+, CD11b+F4/80+ and CD11c+MHCII+ myeloid subsets in the spleen of tumor-bearing mice. (E) Mean percentages ± SEM of CD11b+CD45+, CD11b+Ly6C+ and CD11b+Ly6G+ cells and (F) representative contour plots of FACS analysis for CD11b+CD45+ and CD11b+Ly6C+ cells at the tumor site in PD-1f/f, PD-1f/fLysMcre and PD-1−/− mice. (G) Mean percentages ± SEM of CD16/CD32+, CD86+, CD88+ and CD80+ cells and IFN-γ-expressing myeloid cell subsets within the CD45+CD11b+ gate in B16-F10 tumors from PD-1f/f, PD-1f/fLysMcre and PD-1−/− mice. (H) Mean percentages ± SEM and (I) FACS histograms of IL-4Ra, CD206 and ARG1 expression in CD11b+Ly6C+, CD11b+Ly6G+, CD11b+F4/80+ and CD11c+MHCII+ myeloid cells within the CD11b+CD45+ gate in the spleen of tumor-bearing PD-1f/f, PD-1f/fLysMcre and PD-1−/− mice. Data from one representative of three independent experiments, with 6 mice per group are shown in all panels (* p< 0.05, ** p< 0.01, *** p< 0.001).
Figure 5.
Figure 5.. T cell-specific PD-1 ablation has no impact on tumor-driven emergency myelopoiesis and profile of myeloid cell output and provides minimal protection against tumor growth.
PD-1f/f and PD-1f/fCD4cre mice were inoculated with B16-F10 melanoma. (A) On day 16, mice were euthanized and bone marrow CMP and GMP were examined by flow cytometry. Mean percentages ± SEM of CMP or GMP are shown. (B-C) Tumor size was assessed evert other day from inoculation (B). On the day of euthanasia, tumor weight was measured (C). (D) Mean percentages ± SEM of CD11b+CD45+ cells and CD11b+Ly6C+ and CD11b+Ly6G+ populations within the CD11+CD45+ gate in the spleen. (E) Mean percentages ± SEM of CD11b+CD45+ cells and CD11b+Ly6C+, CD11b+Ly6G+, CD11b+F4/80+ and CD11c+MHCII+ cells within the CD11b+CD45+ gate in the tumor site. (F) Mean percentages ± SEM of CD16/CD32+, CD86+, CD88+, CD80+ and IFN-γ expression in the indicated myeloid subsets (CD11b+Ly6C+, CD11b+Ly6G+, CD11b+F4/80+, CD11c+MHCII+) within the CD11b+CD45+ gate in the tumor site. (G-J) Mean percentages ± SEM of CD4+ and CD8+TCM and TEM (G), as well as IFNγ, IL-2, and IL-17 (H-J) expression in CD4+ and CD8+ TEM and TCM at the tumor site, and respective contour plots (K-M). Results from one representative of two independent experiments with 6 mice per group are shown. (*p< 0.05, **p< 0.01, ***p< 0.001).
Figure 6.
Figure 6.. T cell-specific PD-1 ablation provides diminished protection against tumor growth compared to myeloid-specific PD-1 ablation.
(A) PD-1f/f, PD-1f/fCD4cre and PD-1f/fLysMcre mice were inoculated with MC38 colon adenocarcinoma and tumor size was monitored daily. Mice were euthanized on day 21 and mean percentages ± SEM of CD45+CD11b+ cells and CD11b+Ly6C+, CD11b+Ly6G+ and CD11b+F4/80+ and CD11c+MHCCII+ myeloid subsets in the spleen (B), and tumor site (C) were determined. (D) Mean percentages ± SEM of RORC- and IRF8-expressing CD11b+Ly6C+, CD11b+Ly6G+, CD11b+F/480+ and CD11c+MHCII+ myeloid cells, and (E) mean percentages ± SEM of Arg1, IL-4Ra, CD88 and CD80 cells within the same myeloid subsets in the spleen. (F, G) Representative flow cytometry plots for RORC and IRF8 expression. (H) Mean percentages ± SEM and (I) representative flow cytometry plots of IFN-γ and Arg1-expressing CD11b+Ly6C+ and CD11b+Ly6G+ myeloid cells at the tumor site. (J-L) Mean percentages ± SEM of CD4+ and CD8+TCM and TEM cells (J) and IFN-γ-expressing CD4+ and CD8+ TEM and TCM at the tumor site (K) and respective contour plots (L). Data from one representative of three experiments with 6 mice per group (*p< 0.05, ** p< 0.01, *** p <0.001).
Figure 7.
Figure 7.. Myeloid-specific PD-1 ablation reprograms myeloid cell signalling and metabolism and induces cholesterol synthesis.
(A, B) Linneg BM from PD-1f/f and PD-1f/fLysMcre mice was cultured with GM-CSF, G-CSF and IL-6 for the indicated time intervals. Mean percentages ± SEM of CD11b+CD45+ (A) and Linneg cells (B) are shown. (C, D) Bone marrow cells purified as in (A, B) were cultured with the indicated growth factors and mean percentages ± SEM of CD11b+Ly6C+ and CD11b+Ly6G+ cells were examined after 48 hours of culture. (E-H) Bone marrow cells were prepared and cultured as in (A, B) and at 48 hours of culture glucose uptake was assessed by 2-NBDG (E) and mitochondrial biogenesis was assessed by MitoGreen staining and flow cytometry (F). (G) At 24, 48 and 72 hrs of culture oxygen consumption rate (OCR) and extracellular acidification rate (ECAR) were measured by Seahorse extracellular flux analyser and mitostress responses at each time point of culture were examined. (H) OCR/ECAR ratio was measured at these time points and the increase of OCR/ECAR ratio during stimulation was calculated. (I) BM Linneg cells from PD-1f/f and PD-1f/fLysMcre mice were cultured with G-CSF and GM-CSF for 48 hours and metabolite analysis was performed by mass spectrometry. Unsupervised hierarchical clustering heat map of the top 50 metabolites is shown. (J) At 24, 48 and 72 hours of culture with G-CSF and GM-CSF, mRNA was extracted and analysed for the expression of the indicated genes by qPCR. Results of 48-hr culture are shown and are presented as the fold increase over the mRNA level expressed by PD-1f/f cells. Results are from one of three independent experiments. (K-M) At 24 hrs of culture with GM-CSF, G-CSF or IL-6, content of neutral lipid droplets, including triglycerides and cholesterol esters, was assessed by flow cytometry using BODIPY 493/503. Mean percentages ± SEM (K) of BODIPY 493/503 positive cells within the CD11b+CD45+ gate, representative contour plots (L) and histograms of FACS analysis (M) are shown. (N) PD-1f/f and PD-1f/fLysMcre DC were differentiated in the presence of B16-F10 tumor supernatant and content of neutral lipids was assessed. Mean percentage ± SEM of BODIPY 493/503 positive DC within the CD45+CD11b+ gate is shown. Results are representative of three experiments.
Figure 8.
Figure 8.. PD-1 ablation induces enhanced mitochondrial metabolism of myeloid cells in tumor-bearing mice and improved T cell function.
(A-C) Expression of PPARγ in myeloid cells at the B16-F10 site in PD-1f/f, PD-1f/fLysMcre and PD-1−/− mice was examined by flow cytometry. Mean percentages ± SEM (A), representative histograms (B) and contour plots (C) of PPARγ-expressing CD11b+Ly6C+, CD11b+F4/80+ and CD11c+MHCII+ subsets. (D-G) Mitochondrial metabolic activity of myeloid cells at the B16-F10 tumor site in PD-1f/f, PD-1f/fLysMcre and PD-1−/− mice was examined by assessing mitochondrial membrane potential using MitoRed. MFI ± SEM of MitoRed positive CD11b+Ly6C+, CD11b+F4/80+, and CD11c+MHCII+ subsets within the CD45+CD11b+ gate (D-F) and representative plots of FACS analysis (G) are shown. (H-L) In parallel, expression of IFN-γ, IL-17A, IL-2, IL-10, RORC and ICOS in CD8+ TCM and TEM isolated from B16-F10-bearing PD-1f/f and PD-1f/fLysMcre mice was assessed by flow cytometry. Representative histograms (H), contour plots (I, K), and mean percentages ± SEM (J, L, M) within the CD44hiCD62Lhi gate (for TCM) and CD44hiCD62lo gate (for TEM) cells are shown. Data are from one representative of four independent experiments. (* p< 0.05, ** p< 0.01, *** p< 0.001).

Comment in

References

    1. Okazaki T, Chikuma S, Iwai Y, Fagarasan S, Honjo T, A rheostat for immune responses: the unique properties of PD-1 and their advantages for clinical application. Nature immunology 14, 1212–1218 (2013). - PubMed
    1. Boussiotis VA, Molecular and Biochemical Aspects of the PD-1 Checkpoint Pathway. The New England journal of medicine 375, 1767–1778 (2016). - PMC - PubMed
    1. Rizvi NA et al., Cancer immunology. Mutational landscape determines sensitivity to PD-1 blockade in non-small cell lung cancer. Science (New York, N.Y 348, 124–128 (2015). - PMC - PubMed
    1. Chen W, Wang J, Jia L, Liu J, Tian Y, Attenuation of the programmed cell death-1 pathway increases the M1 polarization of macrophages induced by zymosan. Cell Death Dis 7, e2115 (2016). - PMC - PubMed
    1. Huang X et al., PD-1 expression by macrophages plays a pathologic role in altering microbial clearance and the innate inflammatory response to sepsis. Proceedings of the National Academy of Sciences of the United States of America 106, 6303–6308 (2009). - PMC - PubMed

Publication types

Substances