

Knockdown of long noncoding RNA TP73-AS1 suppresses the malignant progression of breast cancer cells in vitro through targeting miRNA-125a-3p/metadherin axis
- PMID: 31901156
- PMCID: PMC6996984
- DOI: 10.1111/1759-7714.13283
Knockdown of long noncoding RNA TP73-AS1 suppresses the malignant progression of breast cancer cells in vitro through targeting miRNA-125a-3p/metadherin axis
Abstract
Background: TP73 antisense RNA 1 (TP73-AS1) is a long noncoding RNA which has been shown to be involved in the progression of multiple malignant tumors. Previous studies have demonstrated the oncogenic role of TP73-AS1 in breast cancer. However, its molecular mechanism remains largely unknown in breast tumorigenesis.
Methods: Expression of TP63-AS1, miRNA-125a-3p (miR-125a) and metadherin (MTDH) was detected by real-time quantitative PCR and western blotting. The malignancy was evaluated by cell counting kit 8 (CCK-8), transwell assays, flow cytometry and western blotting. The target binding was confirmed by dual luciferase reporter assay. Xenograft tumor model was performed to detect tumor growth in vivo.
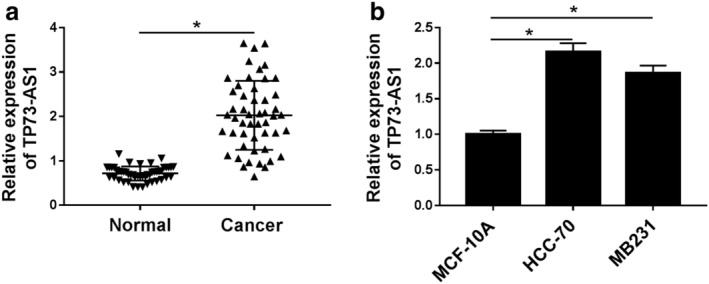
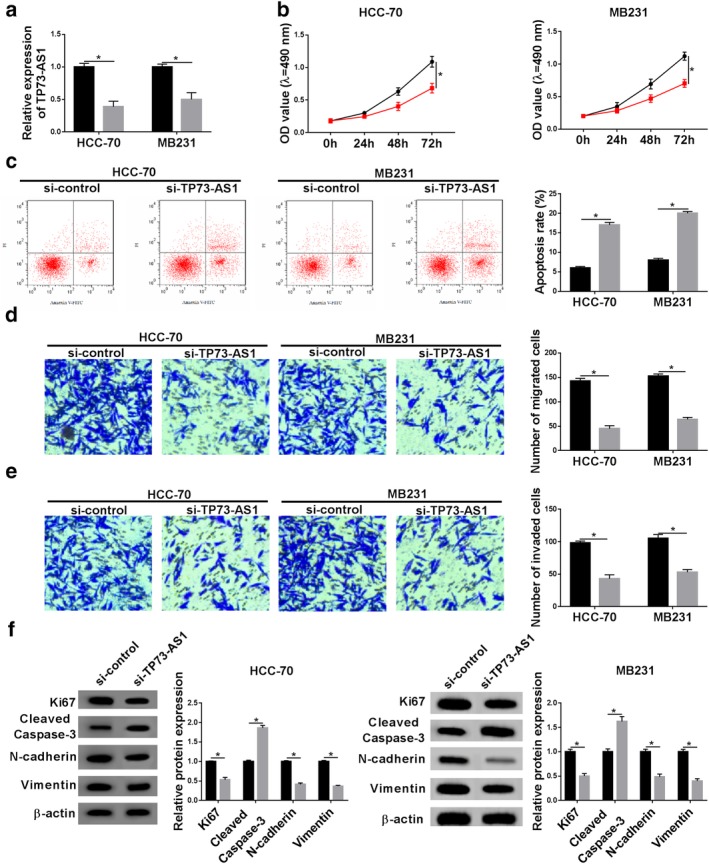
Results: Expression of TP73-AS1 was higher in breast cancer tissues and cell lines. Biologically, its knockdown could promote cell apoptosis rate, and inhibit proliferative capacity, migration and invasion ability in HCC-70 and MB231 cells, accompanied with higher cleaved caspase 3 level and lower Ki67, N-cadherin and Vimentin level. Moreover, TP73-AS1 downregulation restrained the tumor growth of HCC-70 cells in vivo. Mechanically, TP73-AS1 functioned as a molecular "sponge" for miR-125a to modulate MTDH, a downstream target of miR-125a. Intriguingly, both miR-125a overexpression and MTDH silencing exerted a tumor-suppressive effect in the malignant progression of HCC-70 and MB231 cells, which was counteracted by TP73-AS1 upregulation and miR-125a downregulation, respectively.
Conclusion: Knockdown of TP73-AS1 inhibited cell proliferation, migration and invasion, but facilitated apoptosis in breast cancer cells in vitro through targeting miR-125a and upregulating MTDH, suggesting a novel TP73-AS1/miR-125a/MTDH pathway in the malignant progression of breast cancer.
Keywords: Breast cancer; MTDH; TP73-AS1; malignant progression; miR-125a.
© 2019 The Authors. Thoracic Cancer published by China Lung Oncology Group and John Wiley & Sons Australia, Ltd.
Figures
 ) si‐control and (
 ) si‐TP73‐AS1. (b) HCC (
 ) si‐control and (
 ) si‐TP73‐AS1. MB231 (
 ) si‐control and (
 ) si‐TP73‐AS1. (c–e) (
 ) si‐control and (
 ) si‐TP73‐AS1. (f) HCC‐70 (
 ) si‐control and (
 ) si‐TP73‐AS1. MB231 (
 ) si‐control and (
 ) si‐TP73‐AS1.
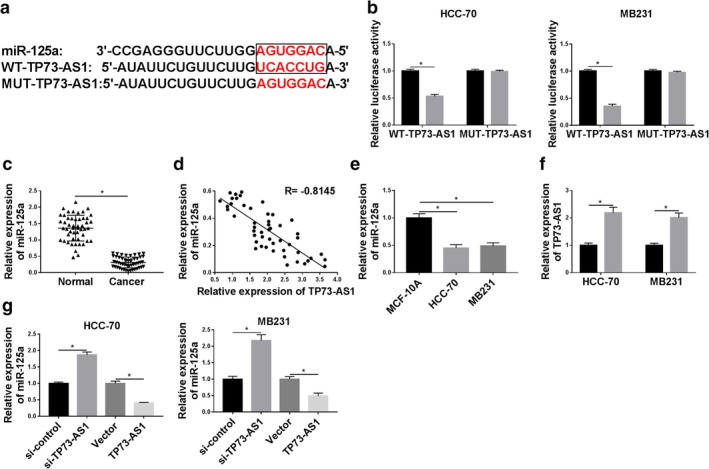
 ) miR‐control and (
 ) miR‐125a. MB231 (
 ) miR‐control and (
 ) miR‐125a. (c) RT‐qPCR measured level of miR‐125a in breast cancer tissues (n = 45) compared with the paired normal tissues. (d) Spearman's rank correlation analysis clarified the association between miR‐125a and TP73‐AS1 expression in breast cancer tissues (n = 45). (e) RT‐qPCR measured miR‐125a level in breast cancer cell lines (HCC‐70 and MB231) comparing to the normal cell line MCF‐10A. (f) RT‐qPCR determined the transfection efficiency of pIRES2‐EGFP empty vector (vector) and recombinant vector containing TP73‐AS1 (TP73‐AS1) in HCC‐70 and MB231 cells. (
 ) Vector and (
 ) TP73‐AS1. (g) RT‐qPCR detected miR‐125a expression level in HCC‐70 and MB231 cells when transfected with si‐TP73‐AS1, si‐control, TP73‐AS1 and vector. Data represent mean ± SEM and *P < 0.05.
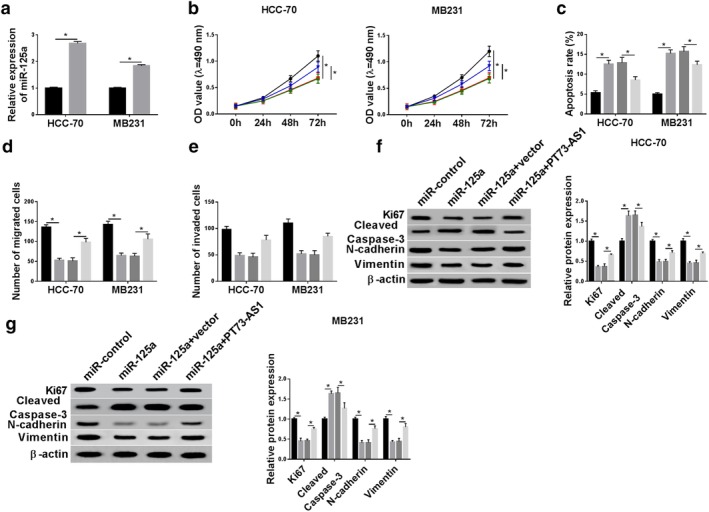
 ) miR‐control and (
 ) miR‐125a. (b–f) HCC‐70 and MB231 cells were transfected with miR‐125a or miR‐control, and cotransfected with miR‐125a and either TP73‐AS1 or vector. (b) CCK‐8 determined cell proliferative capacity after transfection at 0 hour, 24 hours, 48 hours and 72 hours. HCC‐70 (
 ) miR‐control, (
 ) miR‐125a, (
 ) miR‐125a+vector and (
 ) miR‐125a+TP73‐AS1. MB231 (
 ) miR‐control, (
 ) miR‐125a, (
 ) miR‐125a+vector and (
 ) miR‐125a+TP73‐AS1. (c) Flow cytometry examined apoptosis rate after transfection at 24 hours. (
 ) miR‐control, (
 ) miR‐125a, (
 ) miR‐125a+vector and (
 ) miR‐125a+TP73‐AS1. (d, e) Transwell assays were performed to evaluate cell migration and invasion abilities at 24 hours. (
 ) miR‐control, (
 ) miR‐125a, (
 ) miR‐125a+vector and (
 ) miR‐125a+TP73‐AS1. (f, g) Western blotting tested protein expression of Ki67, cleaved caspase‐3, N‐cadherin and Vimentin after transfection at 24 hours. (f) HCC‐70 (
 ) miR‐control, (
 ) miR‐125a, (
 ) miR‐125a+vector and (
 ) miR‐125a+TP73‐AS1. (g) MB231 (
 ) miR‐control, (
 ) miR‐125a, (
 ) miR‐125a+vector and (
 ) miR‐125a+TP73‐AS1. Data represent mean ± SEM and *P < 0.05.
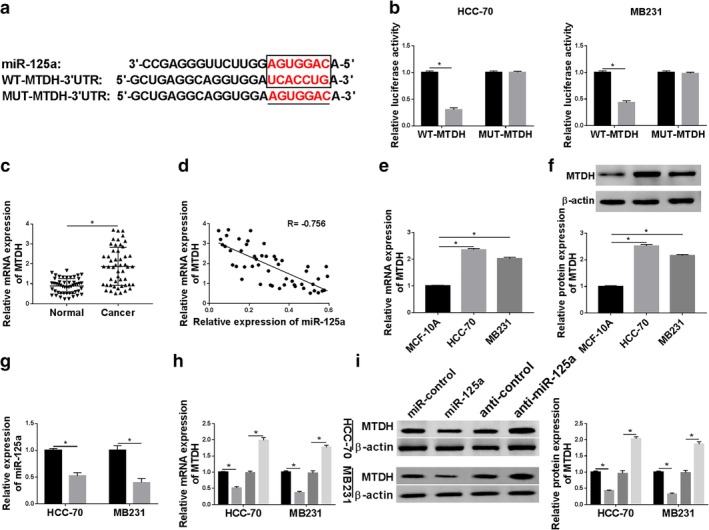
 ) miR‐control and (
 ) miR‐125a. MB231 (
 ) miR‐control and (
 ) miR‐125a. (c) RT‐qPCR measured MTDH mRNA level in breast cancer tissues (n = 45) compared with the paired normal tissues. (d) Spearman's rank correlation analysis clarified the association between miR‐125a and MTDH expression in breast cancer tissues (n = 45). (e, f) RT‐qPCR and western blotting measured MTDH levels in breast cancer cell lines (HCC‐70 and MB231) comparing to MCF‐10A. (g) RT‐qPCR determined the transfection efficiency of miR‐125a inhibitor (anti‐miR‐125a) and its control (anticontrol) in HCC‐70 and MB231 cells. (
 ) anticontrol and (
 ) anti‐miR‐125a. (h, i) RT‐qPCR and western blotting detected MTDH expression levels in HCC‐70 and MB231 cells when transfected with miR‐125a, miR‐control, anti‐miR‐125a and anticontrol. (
 ) miR‐control, (
 ) miR‐125a, (
 ) anticontrol and (
 ) anti‐miR‐125a. Data represent mean ± SEM and *P < 0.05.
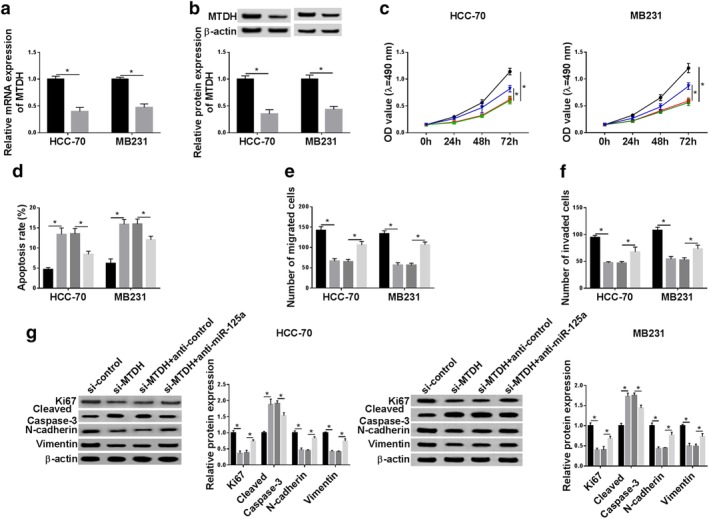
 ) si‐control and (
 ) si‐MTDH. (c–g) HCC‐70 and MB231 cells were transfected with si‐control or si‐MTDH, and cotransfected with si‐MTDH and either anticontrol or anti‐miR‐125a. (c) CCK‐8 determined cell proliferative capacity after transfection at 0 hour, 24 hours, 48 hours and 72 hours. HCC‐70 (
 ) si‐control, (
 ) si‐MTDH, (
 ) si‐MTDH+anticontrol and (
 ) si‐MTDH+anti‐miR‐125a. MB231 (
 ) si‐control, (
 ) si‐MTDH, (
 ) si‐MTDH+anticontrol and (
 ) si‐MTDH+anti‐miR‐125a. (d) Flow cytometry examined apoptosis rate after transfection at 24 hours. (
 ) si‐control, (
 ) si‐MTDH, (
 ) si‐MTDH+anticontrol and (
 ) si‐MTDH+anti‐miR‐125a. (e, f) Transwell assays were performed to evaluate cell migration and invasion abilities at 24 hours. (
 ) si‐control, (
 ) si‐MTDH, (
 ) si‐MTDH+anticontrol and (
 ) si‐MTDH+anti‐miR‐125a. (g) Western blotting tested protein expression of Ki67, cleaved caspase‐3, N‐cadherin and Vimentin after transfection at 24 hours. HCC‐70 (
 ) si‐control, (
 ) si‐MTDH, (
 ) si‐MTDH+anticontrol and (
 ) si‐MTDH+anti‐miR‐125a. MB231 (
 ) si‐control, (
 ) si‐MTDH, (
 ) si‐MTDH+anticontrol and (
 ) si‐MTDH+anti‐miR‐125a. Data represent mean ± SEM and *P < 0.05.
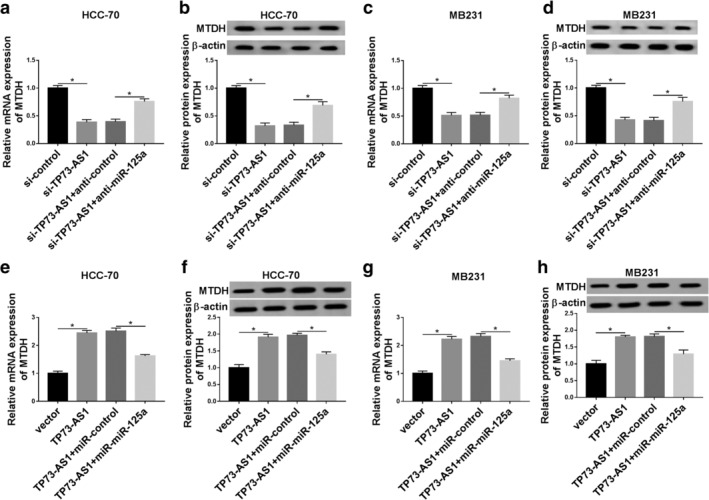
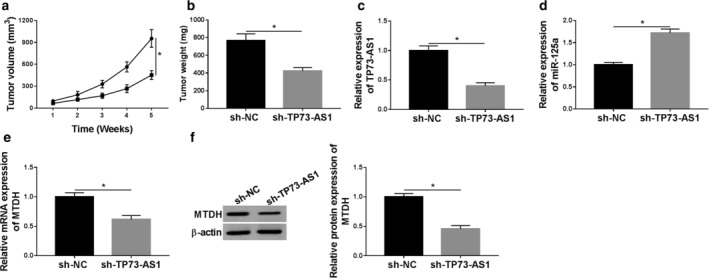
 ) sh‐NC and (
 ) sh‐TP73‐AS1. (b) Tumor weight was recorded on the last week. (c–e) RT‐qPCR analysis testified the relative expression of TP73‐AS1, miR‐125a and MTDH in xenograft tumors. (f) Western blotting determined MTDH protein expression in randomly selected one xenograft tumor. Data represent mean ± SEM and *P < 0.05.
Similar articles
-
Long non-coding RNA TP73-AS1 sponges miR-194 to promote colorectal cancer cell proliferation, migration and invasion via up-regulating TGFα.Cancer Biomark. 2018;23(1):145-156. doi: 10.3233/CBM-181503. Cancer Biomark. 2018. PMID: 30010111
-
lncRNA CERS6-AS1 as ceRNA promote cell proliferation of breast cancer by sponging miR-125a-5p to upregulate BAP1 expression.Mol Carcinog. 2020 Oct;59(10):1199-1208. doi: 10.1002/mc.23249. Epub 2020 Aug 18. Mol Carcinog. 2020. PMID: 32808708
-
Deletion of HNF1A-AS1 Suppresses the Malignant Phenotypes of Breast Cancer Cells In Vitro and In Vivo Through Targeting miRNA-20a-5p/TRIM32 Axis.Cancer Biother Radiopharm. 2021 Feb;36(1):23-35. doi: 10.1089/cbr.2019.3168. Epub 2020 Apr 22. Cancer Biother Radiopharm. 2021. PMID: 32319789
-
Long Non-Coding TP73-AS1: A Potential Biomarker and Therapeutic Target in Cancer.Int J Mol Sci. 2025 Apr 20;26(8):3886. doi: 10.3390/ijms26083886. Int J Mol Sci. 2025. PMID: 40332793 Free PMC article. Review.
-
The multifaceted role of MTDH/AEG-1 in cancer progression.Clin Cancer Res. 2009 Sep 15;15(18):5615-20. doi: 10.1158/1078-0432.CCR-09-0049. Epub 2009 Sep 1. Clin Cancer Res. 2009. PMID: 19723648 Free PMC article. Review.
Cited by
-
Novel associations between MTDH gene polymorphisms and invasive ductal breast cancer: a case-control study.Discov Oncol. 2024 Jul 9;15(1):273. doi: 10.1007/s12672-024-01086-x. Discov Oncol. 2024. PMID: 38977630 Free PMC article.
-
Down-regulation of lncRNA LINC00152 Suppresses Gastric Cancer Cell Migration and Invasion Through Inhibition of the ERK/MAPK Signaling Pathway.Onco Targets Ther. 2020 Mar 9;13:2115-2124. doi: 10.2147/OTT.S217452. eCollection 2020. Onco Targets Ther. 2020. PMID: 32210577 Free PMC article.
-
The Long Non-Coding RNA AC006329.1 Facilitates Hepatocellular Carcinoma Progression and Metastasis by Regulating miR-127-5p/SHC3/ERK Axis.J Hepatocell Carcinoma. 2023 Jul 17;10:1085-1103. doi: 10.2147/JHC.S415309. eCollection 2023. J Hepatocell Carcinoma. 2023. PMID: 37483310 Free PMC article.
-
MicroRNA-324-5p affects the radiotherapy response of cervical cancer via targeting ELAV-like RNA binding protein 1.Kaohsiung J Med Sci. 2020 Dec;36(12):965-972. doi: 10.1002/kjm2.12277. Epub 2020 Aug 5. Kaohsiung J Med Sci. 2020. PMID: 32757457 Free PMC article.
-
Coding roles of long non-coding RNAs in breast cancer: Emerging molecular diagnostic biomarkers and potential therapeutic targets with special reference to chemotherapy resistance.Front Genet. 2023 Jan 6;13:993687. doi: 10.3389/fgene.2022.993687. eCollection 2022. Front Genet. 2023. PMID: 36685962 Free PMC article. Review.
References
-
- Rakha EA, Ellis IO. Triple‐negative/basal‐like breast cancer: Review. Pathology 2009; 41 (1): 40–7. - PubMed
-
- Samadi P, Saki S, Dermani FK, Pourjafar M, Saidijam M. Emerging ways to treat breast cancer: Will promises be met? Cell Oncol (Dordr) 2018; 41 (6): 605–21. - PubMed
-
- Abdollahzadeh R, Daraei A, Mansoori Y, Sepahvand M, Amoli MM, Tavakkoly‐Bazzaz J. Competing endogenous RNA (ceRNA) cross talk and language in ceRNA regulatory networks: A new look at hallmarks of breast cancer. J Cell Physiol 2019; 234 (7): 10080–100. - PubMed
MeSH terms
Substances
LinkOut - more resources
Full Text Sources
Medical
Research Materials
