

A Robust Method Uncovers Significant Context-Specific Heritability in Diverse Complex Traits
- PMID: 31901249
- PMCID: PMC7042488
- DOI: 10.1016/j.ajhg.2019.11.015
A Robust Method Uncovers Significant Context-Specific Heritability in Diverse Complex Traits
Abstract
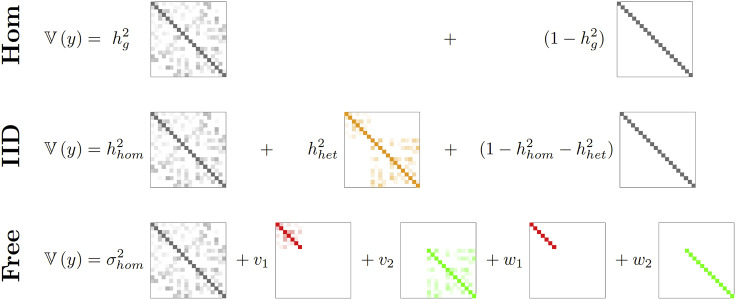
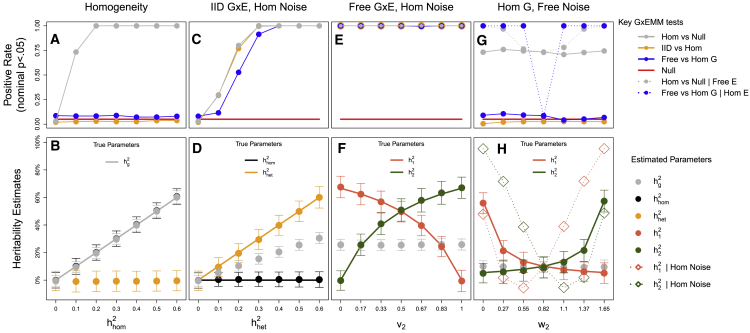
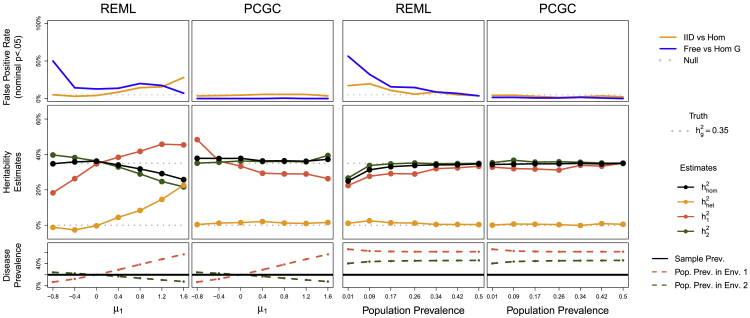
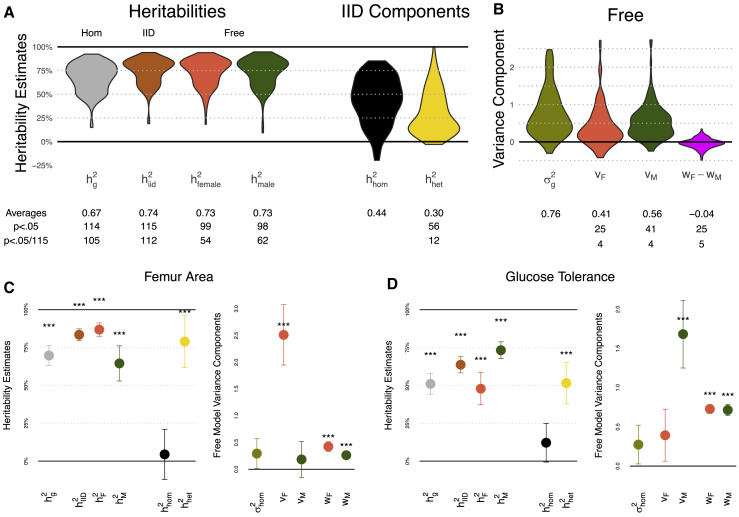
Gene-environment interactions (GxE) can be fundamental in applications ranging from functional genomics to precision medicine and is a conjectured source of substantial heritability. However, unbiased methods to profile GxE genome-wide are nascent and, as we show, cannot accommodate general environment variables, modest sample sizes, heterogeneous noise, and binary traits. To address this gap, we propose a simple, unifying mixed model for gene-environment interaction (GxEMM). In simulations and theory, we show that GxEMM can dramatically improve estimates and eliminate false positives when the assumptions of existing methods fail. We apply GxEMM to a range of human and model organism datasets and find broad evidence of context-specific genetic effects, including GxSex, GxAdversity, and GxDisease interactions across thousands of clinical and molecular phenotypes. Overall, GxEMM is broadly applicable for testing and quantifying polygenic interactions, which can be useful for explaining heritability and invaluable for determining biologically relevant environments.
Keywords: G-E correlation; GxE; disease subtypes; genetic heterogeneity; heritability; heteroskedasticity; linear mixed model; psychiatric disease.
Copyright © 2019 American Society of Human Genetics. Published by Elsevier Inc. All rights reserved.
Conflict of interest statement
The authors declare no competing interests.
Figures
Similar articles
-
A scalable and robust variance components method reveals insights into the architecture of gene-environment interactions underlying complex traits.Am J Hum Genet. 2024 Jul 11;111(7):1462-1480. doi: 10.1016/j.ajhg.2024.05.015. Epub 2024 Jun 11. Am J Hum Genet. 2024. PMID: 38866020 Free PMC article.
-
Distinct explanations underlie gene-environment interactions in the UK Biobank.Am J Hum Genet. 2025 Mar 6;112(3):644-658. doi: 10.1016/j.ajhg.2025.01.014. Epub 2025 Feb 17. Am J Hum Genet. 2025. PMID: 39965571 Free PMC article.
-
Trade-offs in modeling context dependency in complex trait genetics.Elife. 2025 Apr 10;13:RP99210. doi: 10.7554/eLife.99210. Elife. 2025. PMID: 40207770 Free PMC article.
-
Open problems in human trait genetics.Genome Biol. 2022 Jun 20;23(1):131. doi: 10.1186/s13059-022-02697-9. Genome Biol. 2022. PMID: 35725481 Free PMC article. Review.
-
Predicting Polygenic Risk of Psychiatric Disorders.Biol Psychiatry. 2019 Jul 15;86(2):97-109. doi: 10.1016/j.biopsych.2018.12.015. Epub 2018 Dec 28. Biol Psychiatry. 2019. PMID: 30737014 Free PMC article. Review.
Cited by
-
Allele frequency impacts the cross-ancestry portability of gene expression prediction in lymphoblastoid cell lines.Am J Hum Genet. 2024 Dec 5;111(12):2814-2825. doi: 10.1016/j.ajhg.2024.10.009. Epub 2024 Nov 15. Am J Hum Genet. 2024. PMID: 39549695 Free PMC article.
-
High-throughput screening of glucocorticoid-induced enhancer activity reveals mechanisms of stress-related psychiatric disorders.Proc Natl Acad Sci U S A. 2023 Dec 5;120(49):e2305773120. doi: 10.1073/pnas.2305773120. Epub 2023 Nov 27. Proc Natl Acad Sci U S A. 2023. PMID: 38011552 Free PMC article.
-
Integration of DNA Methylation and Transcriptome Data Improves Complex Trait Prediction in Hordeum vulgare.Plants (Basel). 2022 Aug 24;11(17):2190. doi: 10.3390/plants11172190. Plants (Basel). 2022. PMID: 36079572 Free PMC article.
-
A versatile, fast and unbiased method for estimation of gene-by-environment interaction effects on biobank-scale datasets.Nat Commun. 2023 Aug 25;14(1):5196. doi: 10.1038/s41467-023-40913-7. Nat Commun. 2023. PMID: 37626057 Free PMC article.
-
Characterizing the genetic architecture of drug response using gene-context interaction methods.Cell Genom. 2024 Dec 11;4(12):100722. doi: 10.1016/j.xgen.2024.100722. Epub 2024 Dec 4. Cell Genom. 2024. PMID: 39637863 Free PMC article.
References
MeSH terms
Substances
Grants and funding
LinkOut - more resources
Full Text Sources
Medical
Miscellaneous
