. 2020 Jan 2;26(1):48-63.e6.
doi: 10.1016/j.stem.2019.11.015.

Outer Radial Glia-like Cancer Stem Cells Contribute to Heterogeneity of Glioblastoma

Affiliations

Outer Radial Glia-like Cancer Stem Cells Contribute to Heterogeneity of Glioblastoma

Aparna Bhaduri et al. Cell Stem Cell. .

Abstract

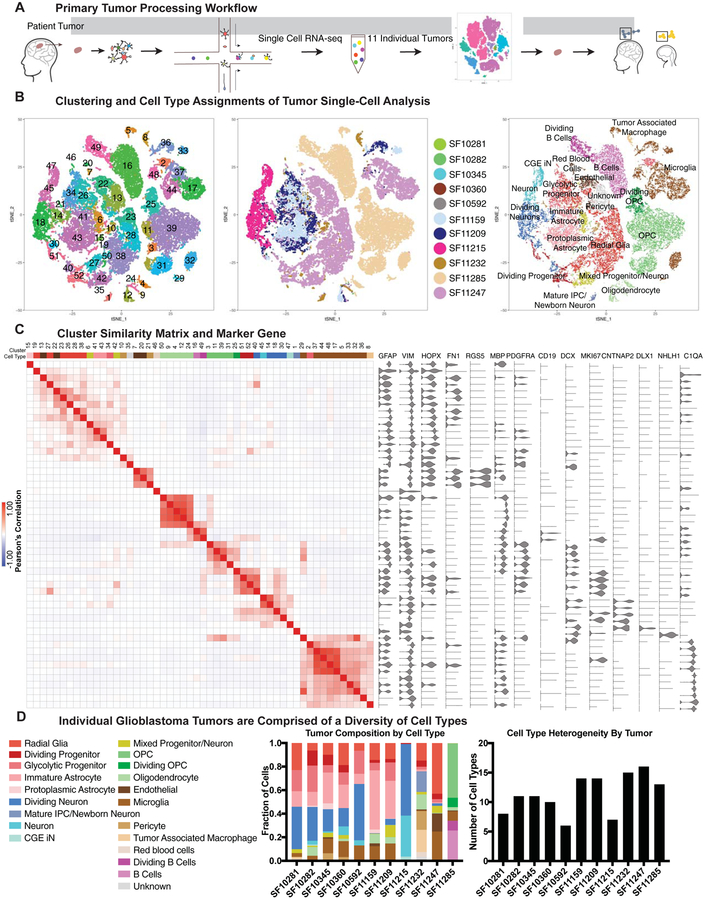
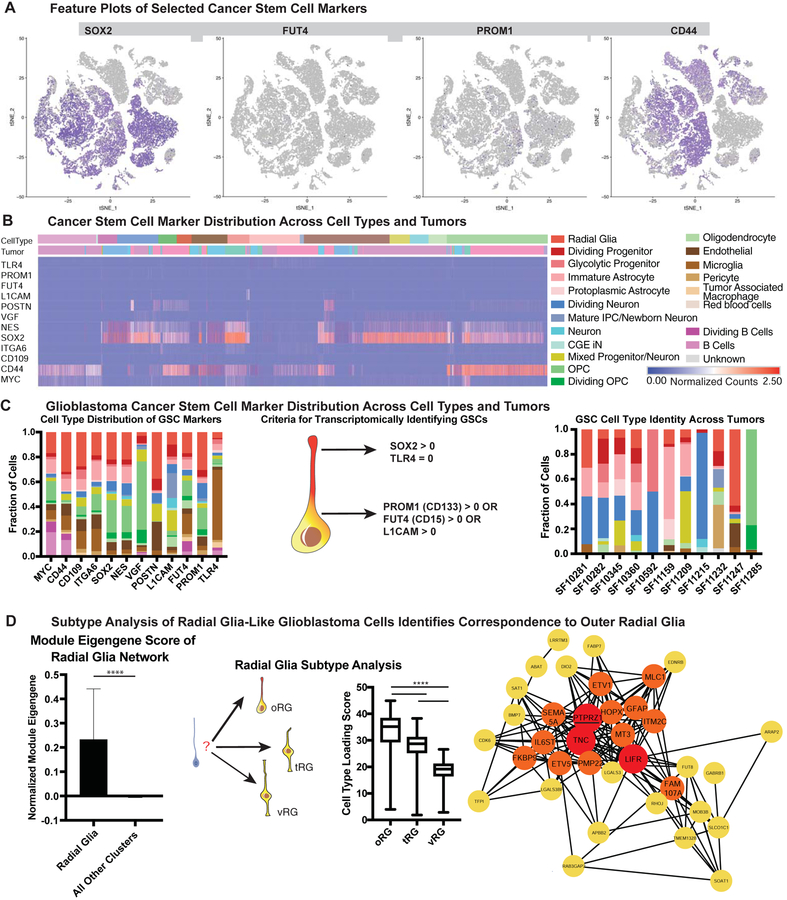
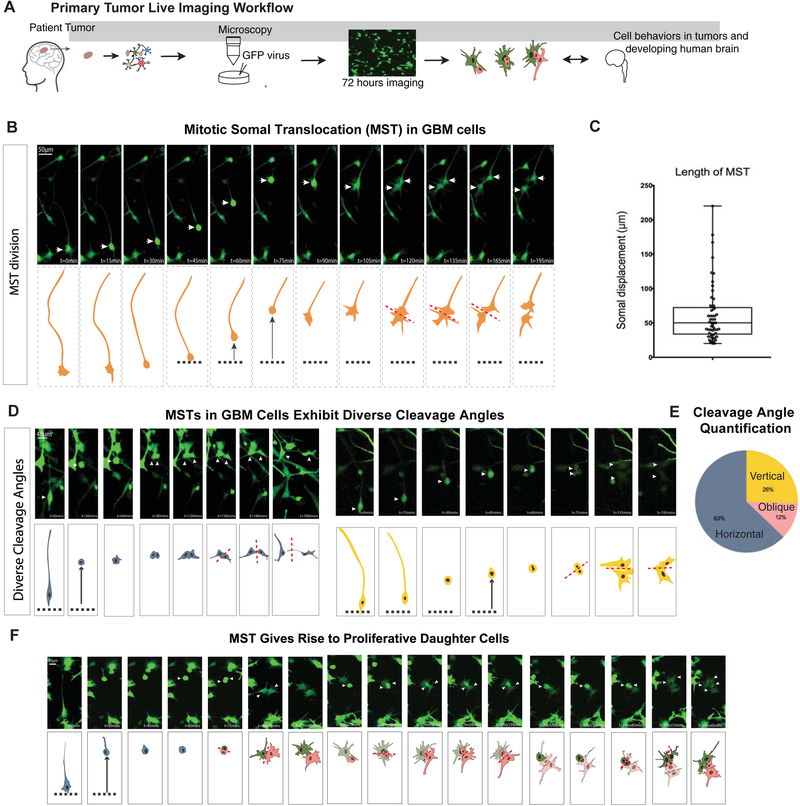
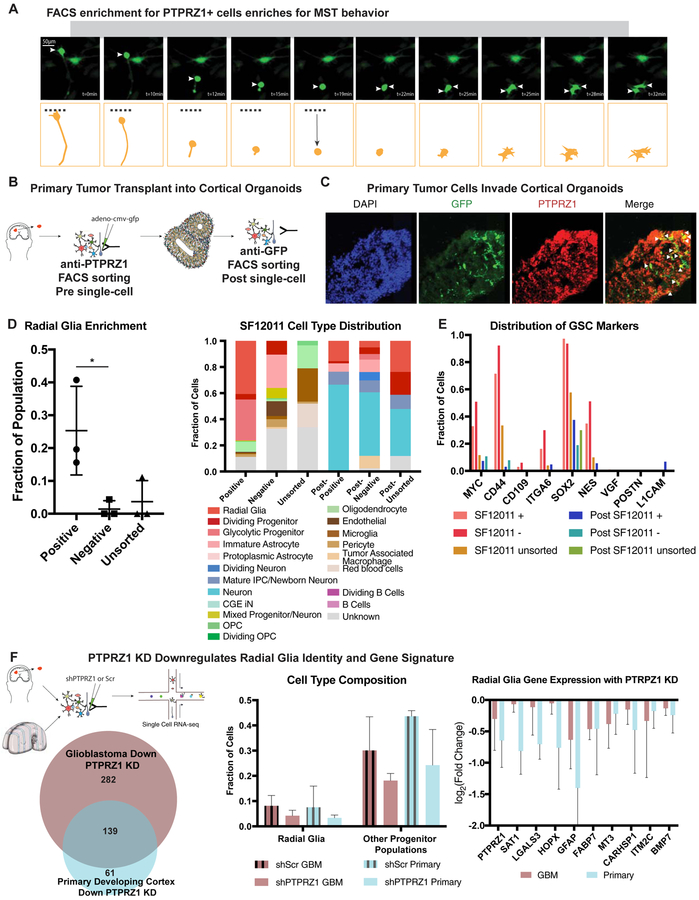
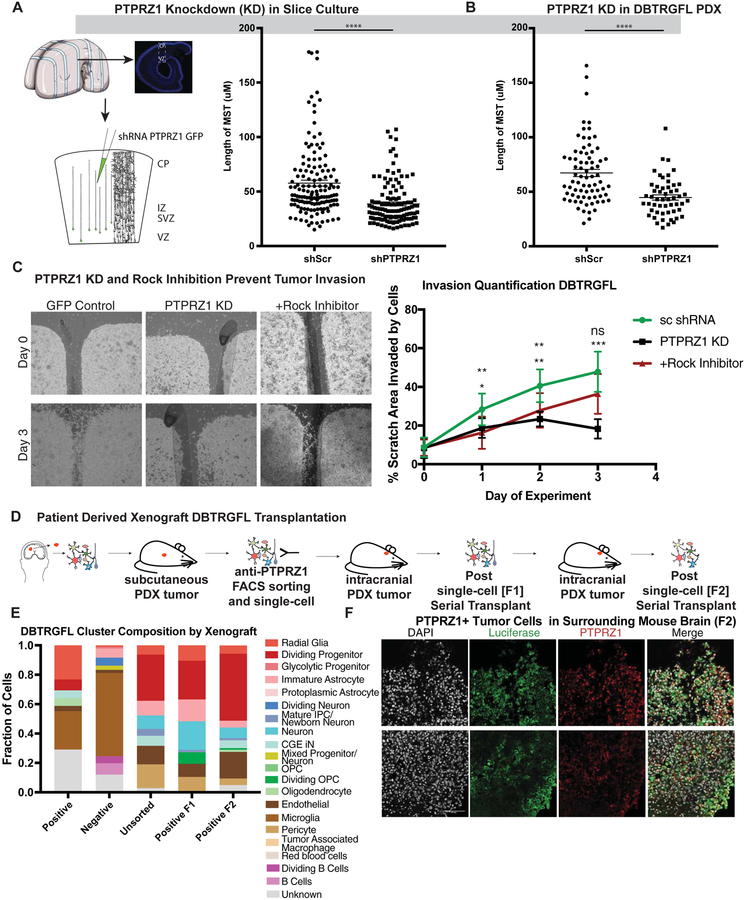
Glioblastoma is a devastating form of brain cancer. To identify aspects of tumor heterogeneity that may illuminate drivers of tumor invasion, we created a glioblastoma tumor cell atlas with single-cell transcriptomics of cancer cells mapped onto a reference framework of the developing and adult human brain. We find that multiple GSC subtypes exist within a single tumor. Within these GSCs, we identify an invasive cell population similar to outer radial glia (oRG), a fetal cell type that expands the stem cell niche in normal human cortex. Using live time-lapse imaging of primary resected tumors, we discover that tumor-derived oRG-like cells undergo characteristic mitotic somal translocation behavior previously only observed in human development, suggesting a reactivation of developmental programs. In addition, we show that PTPRZ1 mediates both mitotic somal translocation and glioblastoma tumor invasion. These data suggest that the presence of heterogeneous GSCs may underlie glioblastoma's rapid progression and invasion.

Keywords: cancer stem cell; glioblastoma; outer radial glia; single-cell sequencing; tumor heterogeneity.


Conflict of interest statement

Declaration of Interests

The authors declare no competing interests.

Figures

Figure 1.
Figure 1.. Single cell RNA-sequencing of primary glioblastoma tumors creates an atlas of tumor cell types
a) Schematic of the workflow used to create the tumor atlas. Primary tumor resections are obtained and dissociated for single-cell sequencing. Clustering is performed and cell clusters are compared to annotated clusters from adult and developing human datasets. b) tSNE plots showing the clustering of primary tumor cells, colored by cluster, tumor of origin, and annotated cell type. c) Similarity matrix of clusters from primary glioblastoma analysis, correlated in the space of marker genes. Heatmap color indicates the Pearson’s correlation, and above the heatmap is the annotated cell type for each cluster. To the right of the heatmap are marker gene violin plots depicting the distribution of cell type genes across clusters. Some genes (such as GFAP) are broadly expressed but strongly enriched in clusters where the marker is associated with cell type (such as cluster 15, protoplasmic astrocyte-like cells). d) Composition of individual tumors is shown as a proportion of single-cells identified as each annotated cell type. Stacked barchart shows the proportional composition for each tumor, and graph to the right shows the number of cell types represented in each tumor.
Figure 2.
Figure 2.. Glioblastoma Cancer Stem Markers are Expressed in a Variety of Cell Types
a) Feature plots of selected cancer stem markers. Some stemness genes (such as SOX2 and CD44) are widely expressed, while others (such as PROM1 and FUT4) mark rare populations. b) Heatmap of normalized gene counts for glioblastoma cancer stem cell (GSC) markers with blue corresponding to no expression and red corresponding to 2.5 or more normalized counts within the cell. Many markers are co-expressed, and GSC markers span a variety of cell types (annotated above the heatmap). c) Fraction of cells annotated by cell type (based upon clustering analysis) that comprise GSC marker positive cells (based upon individual cell annotations), organized first by marker. Using markers that have been characterized in primary glioblastoma tumors and exist in tumor bulk populations, GSCs were identified for each tumor (based upon individual cell annotations). The heterogeneous composition of cell types for GSCs within a single is shown on the right. d) The expression of the radial glia gene signature was evaluated to be significantly higher in GBM radial glia-like cells compared to all other cell types (**** = p <0.0001, Student’s two sided t-test). GBM radial glia-like cells were compared to the known molecular signatures of radial glia subtypes. The arrows pointing to outer radial glia (oRG), truncated radial glia (tRG) and ventricular radial glia (vRG) are weighted in their thickness proportional to the relative correlation of GBM developmental radial glia-like cells to each subtype. The graph shows a significantly higher correlation (**** = p <0.0001, Student’s two sided t-test using all 32,000 cell observations) to oRG than to the other subtypes. Network diagram depicts the oRG network (Pollen et al 2015) that is highly correlated (R > 0.30) in GBM single-cell data. Red highlights nodes with > 20 connections, and orange highlights those with greater than 10 connections. The majority of genes in the developmental oRG network are preserved in GBM.
Figure 3.
Figure 3.. Copy Number Analysis Demonstrates Enrichment of Progenitor Cell Types in Tumor Cells.
a) Quantification of the proportion of cells by tumor that are designated as normal or tumor cells based upon copy number variation (CNV) analysis. The fraction of all cells is shown by annotated cell type in a stack barchart. b) The fraction of radial glia-like cells annotated as normal or tumor cells, mean with standard deviation is shown. (* = p <0.05, Student’s two sided t-test). c) Reconstructions of the relationship between cells within the tumor are shown in phylogenies. Phylogenies were reconstructed based upon parsimony based upon the CNV calls. On each branch of the phylogeny, proportions of the annotated cell types for each CNV event are shown in horizontal stacked barcharts.
Figure 4.
Figure 4.. GBM oRG-like cells undergo mitotic somal translocation and can give rise to proliferative daughter cells
a) Schematic of the workflow used to set up live imaging analysis of primary tumor resections. Tumors were dissociated and plated on Matrigel, after which they were infected with an adenovirus to express GFP. Live imaging was performed over the course of 72 hours. b) Still images of videos of time-lapse imaging depict a glioblastoma cell undergoing a mitotic somal translocation (MST) as seen by the translocation of the soma followed by cytokinesis. c) Box plot (min to max) shows the somal translocation distance in the observed MSTs. These distances and distribution are comparable to normal development. Distances calculated from 5 biological replicates and 3–8 imaging positions each. d) Another two examples of MST with the cleavage plane annotated to depict the different angles observed. e) Pie chart shows the proportion of horizontal, vertical, and oblique cleavage angles observed (relative to primary fiber) in live imaging analysis. 43 observations were analyzed across 5 biological replicates. f) Still images from live imaging analysis that identifies MST divisions giving rise to proliferative daughter cells in the same frame.
Figure 5.
Figure 5.. Sorting for PTPRZ1 positive cells enriches for oRG-like cells
a) Still images of mitotic somal translocations in cells that were sorted for PTPRZ1 expression from a primary tumor. b) Schematic shows the process of transplantation. Primary tumor cells are sorted for PTPRZ1 positive populations or unsorted populations and are sampled with single-cell RNA sequencing and remaining cells are infected with adenovirus with GFP labeling. These cells are placed upon cortical organoids aged between week 6 and 10. After two weeks in the organoid, GFP positive cells are FACS sorted and analyzed with single-cell RNA sequencing. c) Immunofluorescence of organoid (SF12011 transplanted) show GFP positive cells, and a subset of these cells co-express PTPRZ1. d) Single-cell RNA sequencing was performed prior to transplant from 3 primary tumors and 2 weeks after cells were transplanted and FACS sorted from the organoid. Positive sort significantly enriches for radial glia-like cells ( * p-value < 0.05, Welch’s t-test). Stacked barchart depicts proportion of cells that correspond to broad cell types. Both PTPRZ1+ and PTPRZ1− cells give rise to a variety of cell types that do not exist in the original population including differentiated populations of neurons and astrocytes. e) For each subpopulation, the subset of cells that express GSC markers is shown. Each of the pre-transplanted populations express high levels of some of these markers, and the expression decreases after transplant, corresponding to the increase in differentiated cell populations in the post-transplanted tumors. f) Workflow of single-cell sequencing is shown. PTPRZ1 KD and a scrambled control were used to knockdown PTPRZ1 in both primary developing human cortex cells and and primary glioblastoma cells. The resulting gene expression identified a significant overlap between the PTPRZ1 downregulated genes. (* = p-value < 0.05). In both systems, the proportion of radial glia and other progenitor populations (OPC, IPC, dividing progenitors) was also decreased. These changes were accompanied by a significant down-regulation of several outer radial glia marker genes.
Figure 6.
Figure 6.. PTPRZ1 Promotes MST driven invasiveness of glioblastoma
a) Short hairpin induced knockdown of PTPRZ1 (**** = p < 0.0001, Student’s two-sided t-test) decrease the length of somal translocation length using 3 biological replicates and 4 technical replicates each in primary samples and in 4 technical replicates of the the DBTRGFL patient derived xenograft line. b) Invasion assays of patient derived xenograft (PDX) line DBTRGFL were performed with control (scrambled shRNA), PTPRZ1 knockdown (shRNA) and Rock Inhibition. Invasions were imaged every 24 hours, and Day 0 and Day 3 are shown. Quantification was performed by calculating how much of the gap was filled. Statistics were performed for both PTPRZ1 knockdown and Rock inhibition, and statistics are showing for Rock inhibition on top and PTPRZ1 knockdown below (* = p <0.05, ** p < 0.01, *** p < 0.001, Student’s two-sided t-test). c) Schematic of the mouse experiments performed in this study. PDX line DBTRGFL was historically generated by sampling primary tumor and propagating as a xenograft in the flank of a mouse. This tumor was then sorted for PTPRZ1 positive cells, and positive and unsorted cells of equal numbers were injected into the mouse. The cells were profiled using single-cell sequencing prior to injection, and resultant tumors were profiled after first emergence of tumor (F1) and after serial transplant (F2). d) Single-cell sequencing was performed on samples prior to and after tumor formation. Each cluster was correlated to the closest broad cell type, and is shown as a proportion of the whole. PTPRZ1+ cells give rise to cell types not present in the initial sort, including astrocytes and upper layer neurons. e) DBTRGFL is labeled with luciferase, and staining of surrounding brain tissue after serial transplantation identifies luciferase positive cells. A subset of these cells are also PTPRZ1 positive. Scale bar = 100 μM.

Comment in

References

    1. Alcantara Llaguno SR, Wang Z, Sun D, Chen J, Xu J, Kim E, Hatanpaa KJ, Raisanen JM, Burns DK, Johnson JE, et al. (2015). Adult Lineage-Restricted CNS Progenitors Specify Distinct Glioblastoma Subtypes. Cancer cell 28, 429–440. - PMC - PubMed
    1. Alvarado AG, Thiagarajan PS, Mulkearns-Hubert EE, Silver DJ, Hale JS, Alban TJ, Turaga SM, Jarrar A, Reizes O, Longworth MS, et al. (2017). Glioblastoma Cancer Stem Cells Evade Innate Immune Suppression of Self-Renewal through Reduced TLR4 Expression. Cell Stem Cell 20, 450–461 e454. - PMC - PubMed
    1. Azzarelli R, Simons BD, and Philpott A (2018). The developmental origin of brain tumours: a cellular and molecular framework. Development 145. - PMC - PubMed
    1. Bao S, Wu Q, Li Z, Sathornsumetee S, Wang H, McLendon RE, Hjelmeland AB, and Rich JN (2008). Targeting cancer stem cells through L1CAM suppresses glioma growth. Cancer Res 68, 6043–6048. - PMC - PubMed
    1. Beadle C, Assanah MC, Monzo P, Vallee R, Rosenfeld SS, and Canoll P (2008). The role of myosin II in glioma invasion of the brain. Molecular biology of the cell 19, 3357–3368. - PMC - PubMed

Publication types

Substances