. 2020 Jan 22;105(2):293-309.e5.
doi: 10.1016/j.neuron.2019.12.013. Epub 2019 Dec 31.

m6A mRNA Methylation Is Essential for Oligodendrocyte Maturation and CNS Myelination

Affiliations

m6A mRNA Methylation Is Essential for Oligodendrocyte Maturation and CNS Myelination

Huan Xu et al. Neuron. .

Abstract

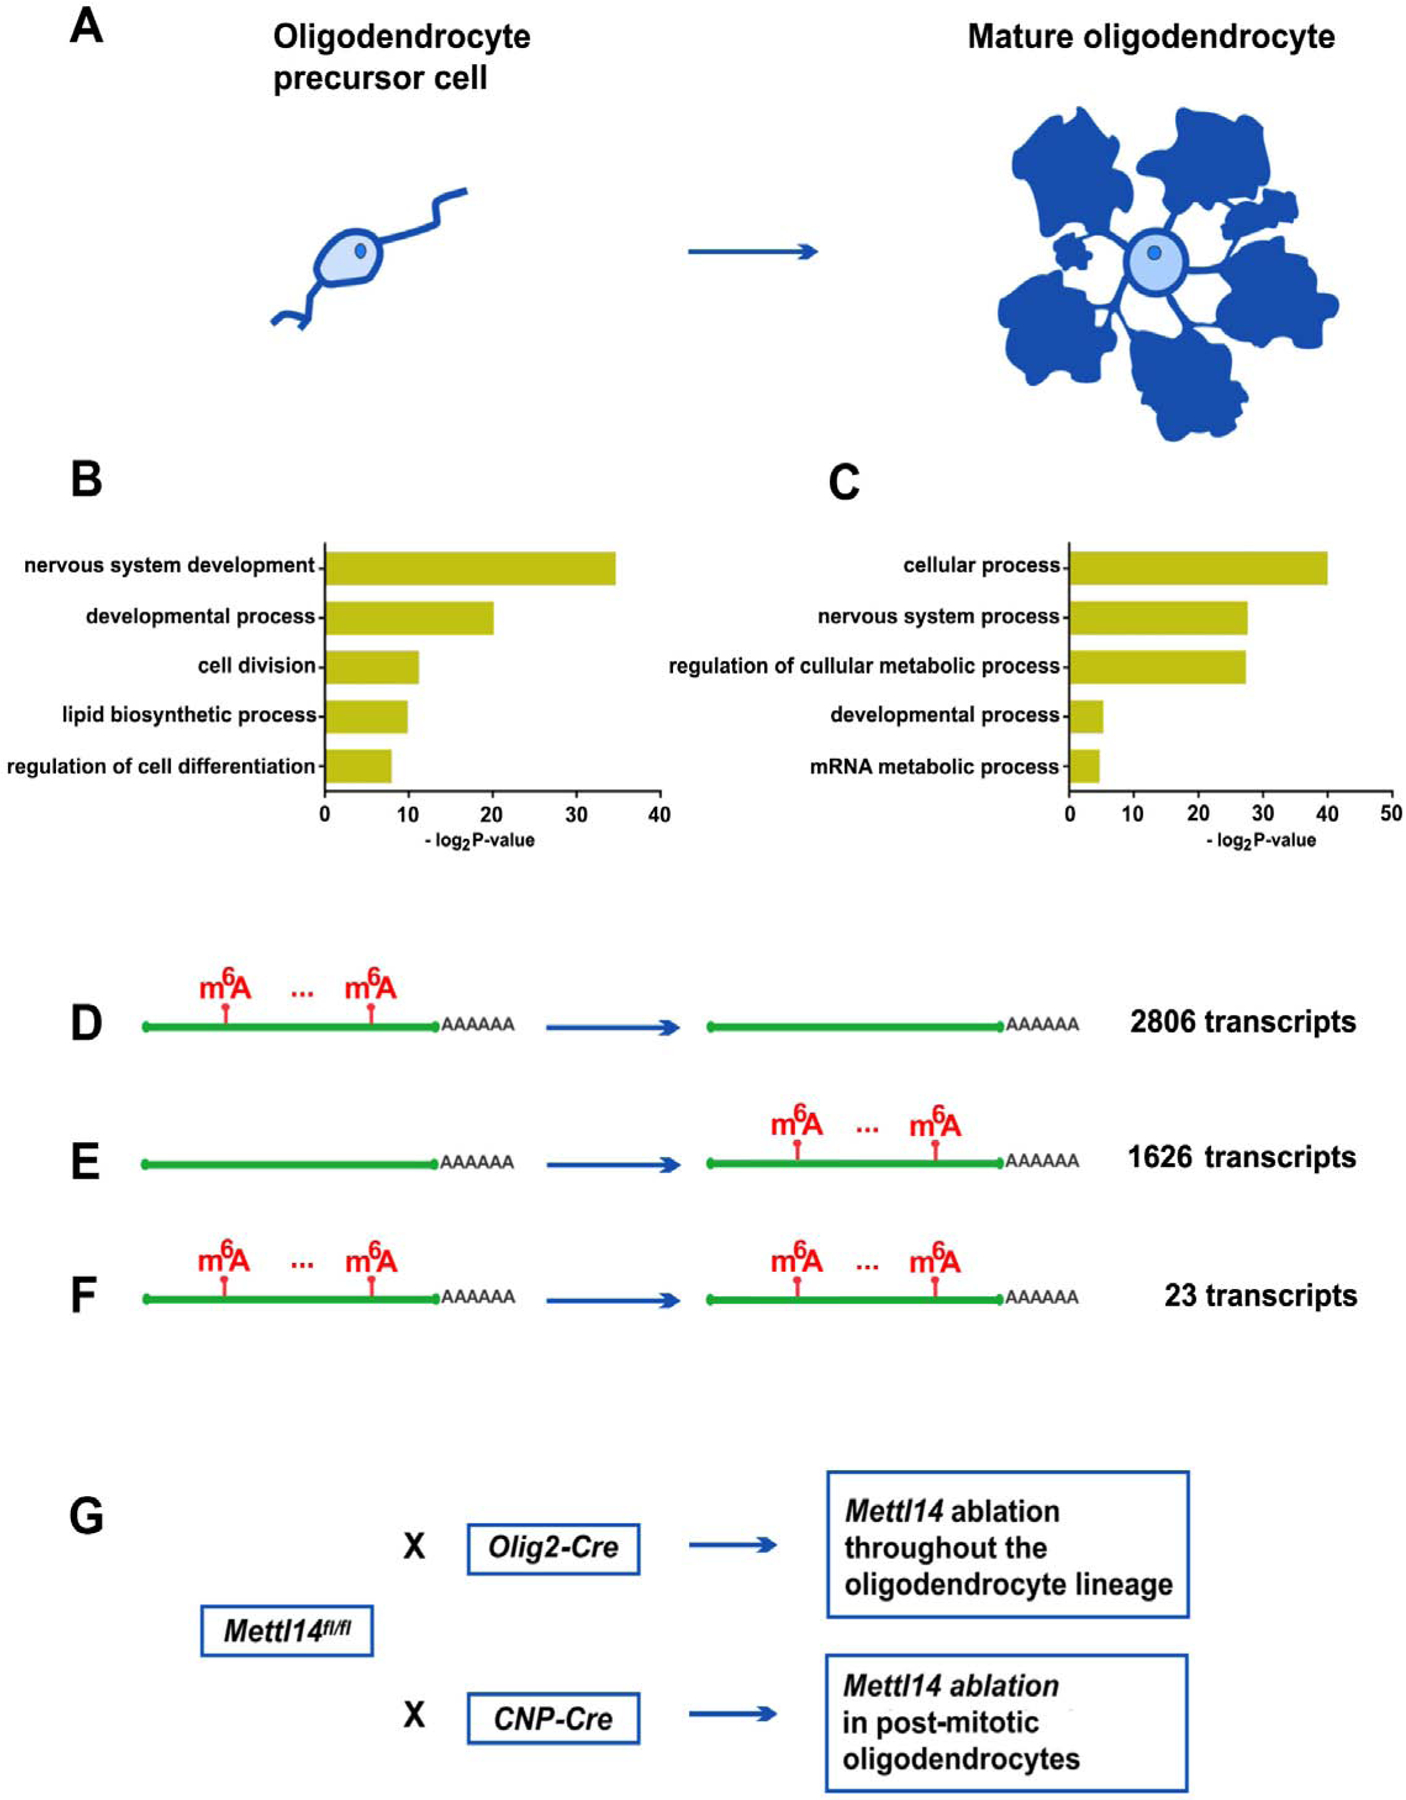
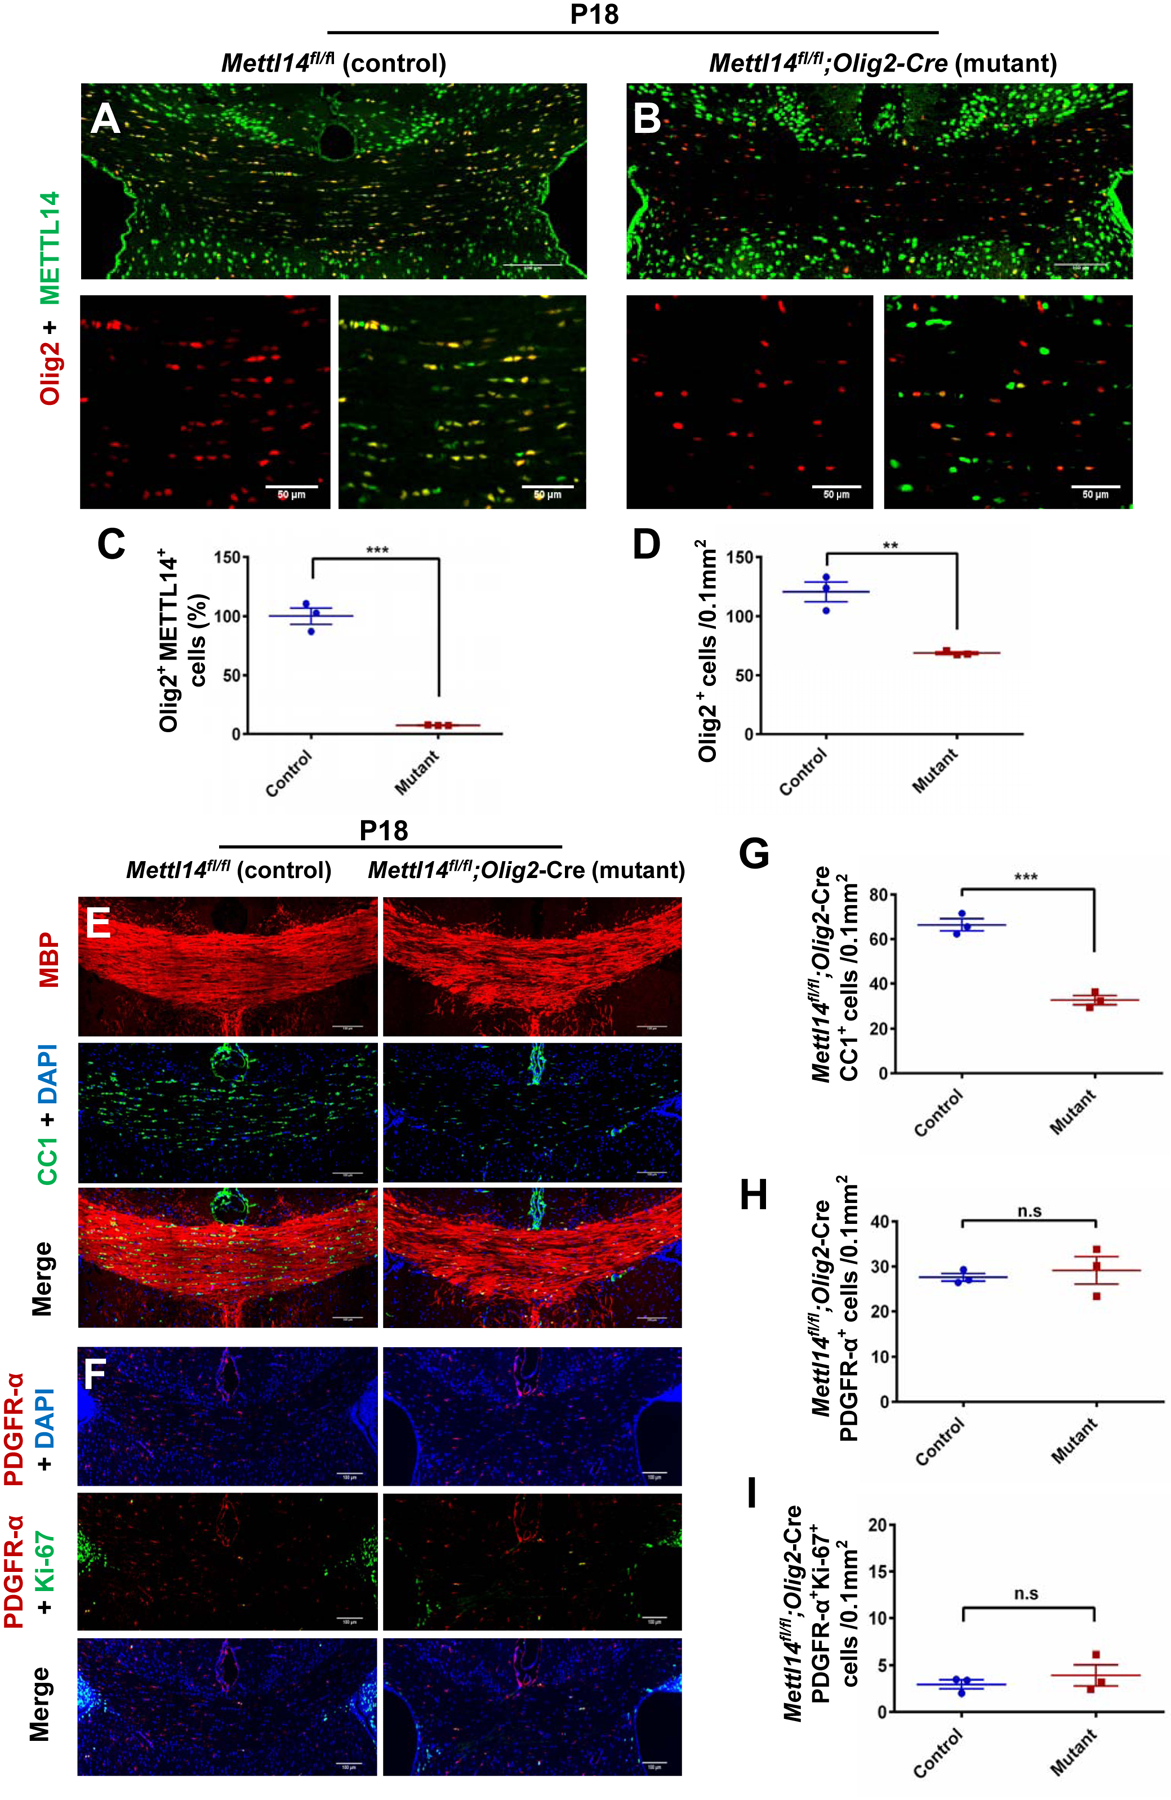
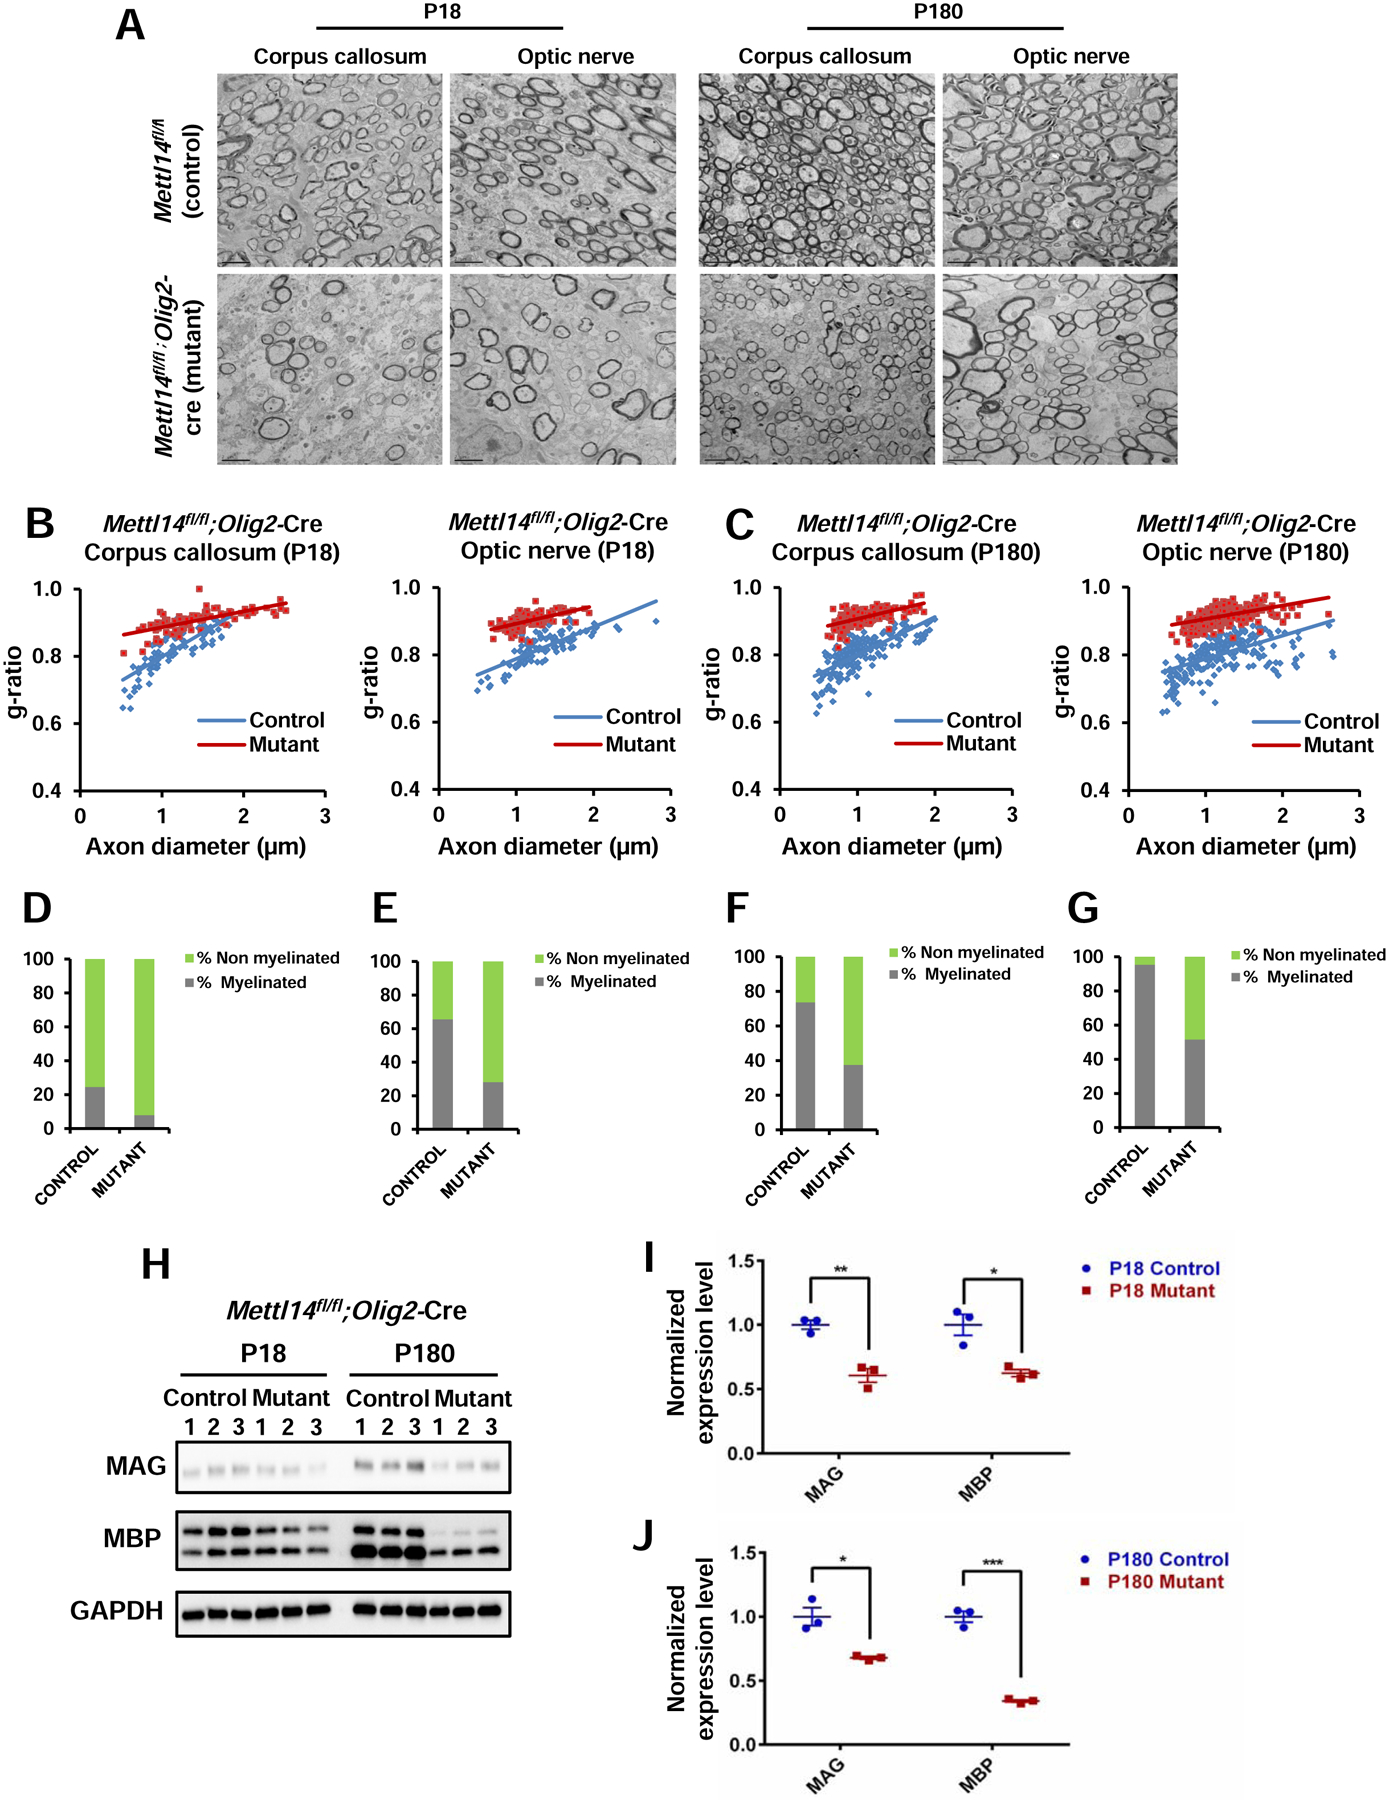
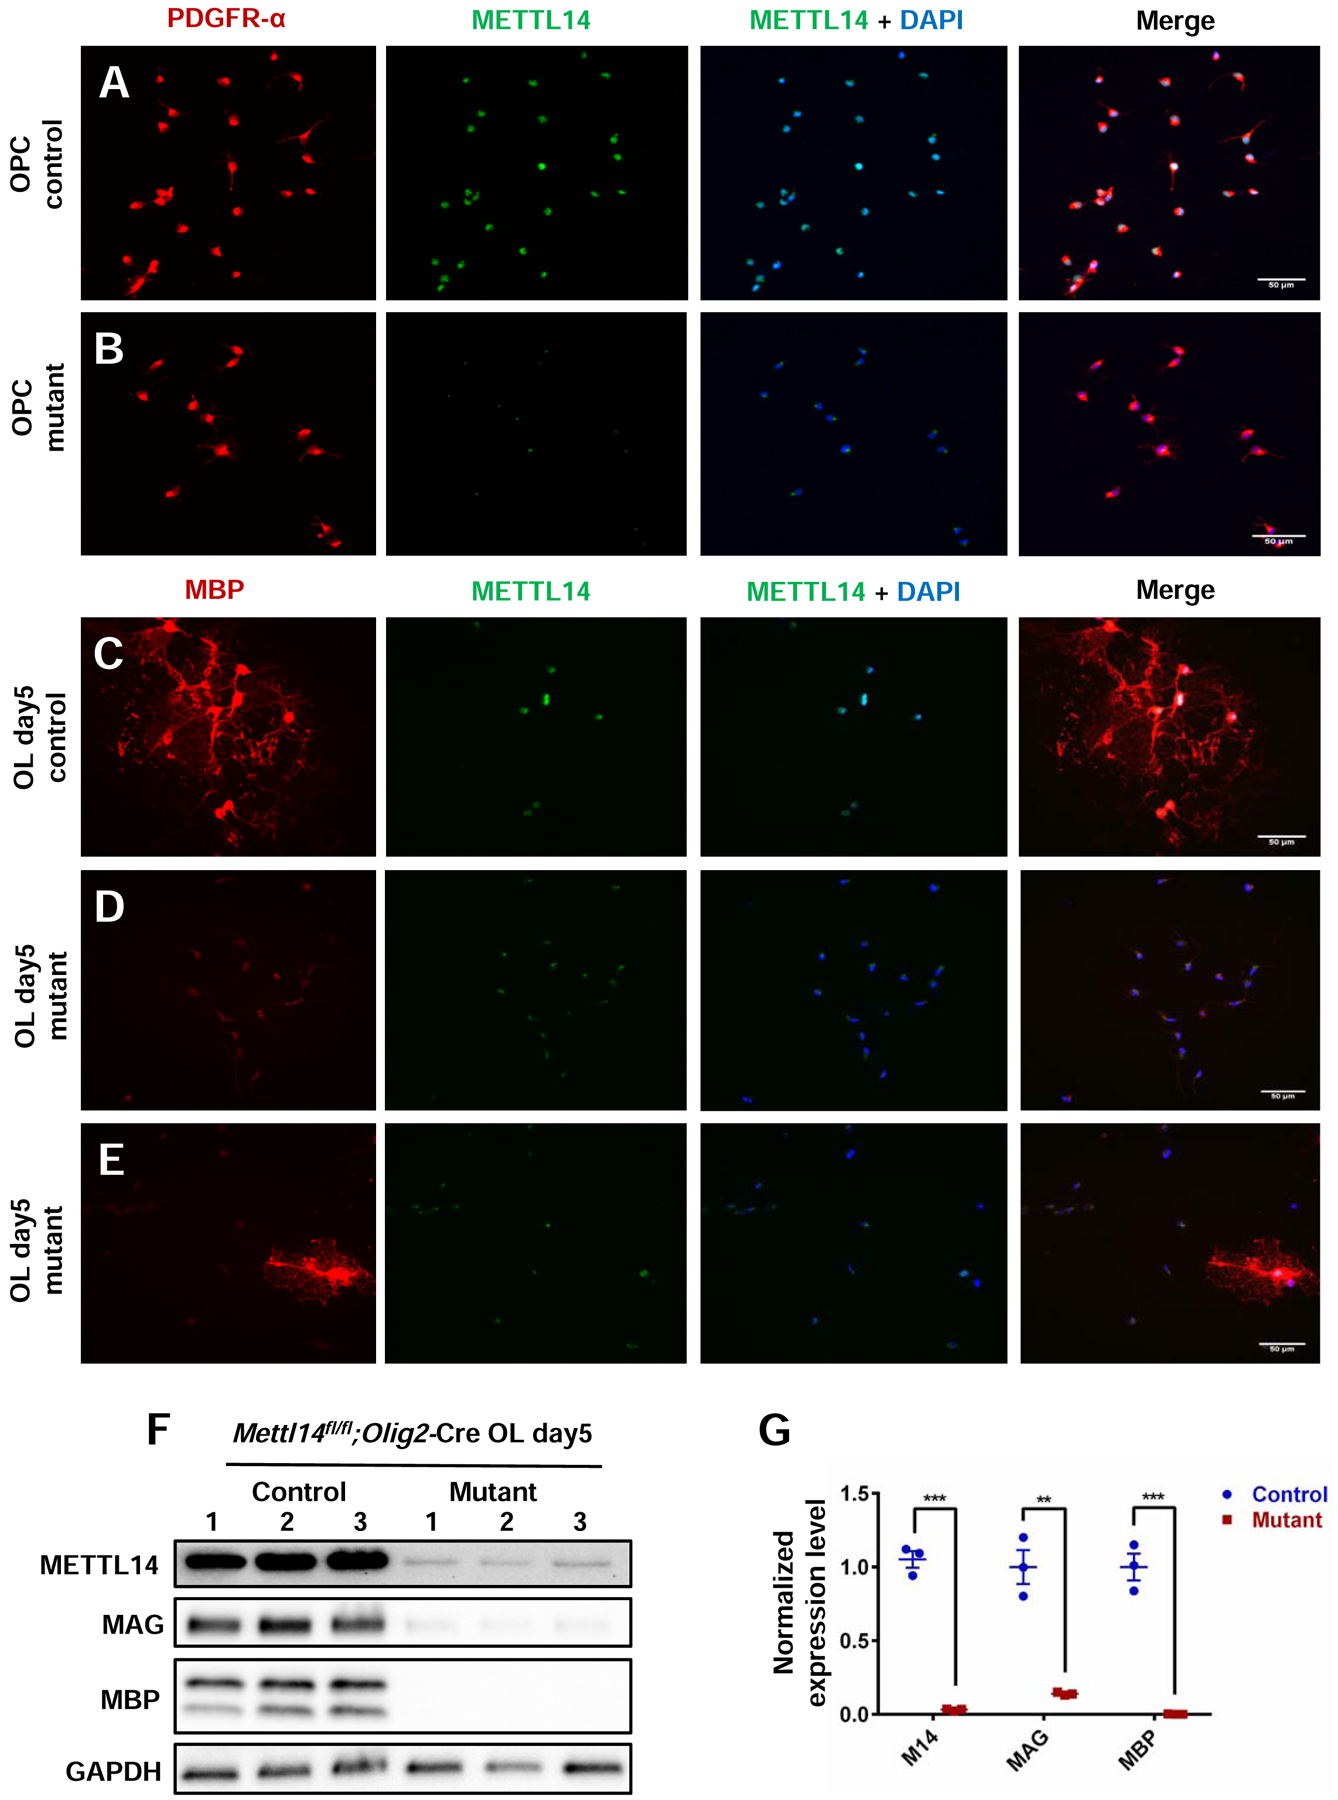
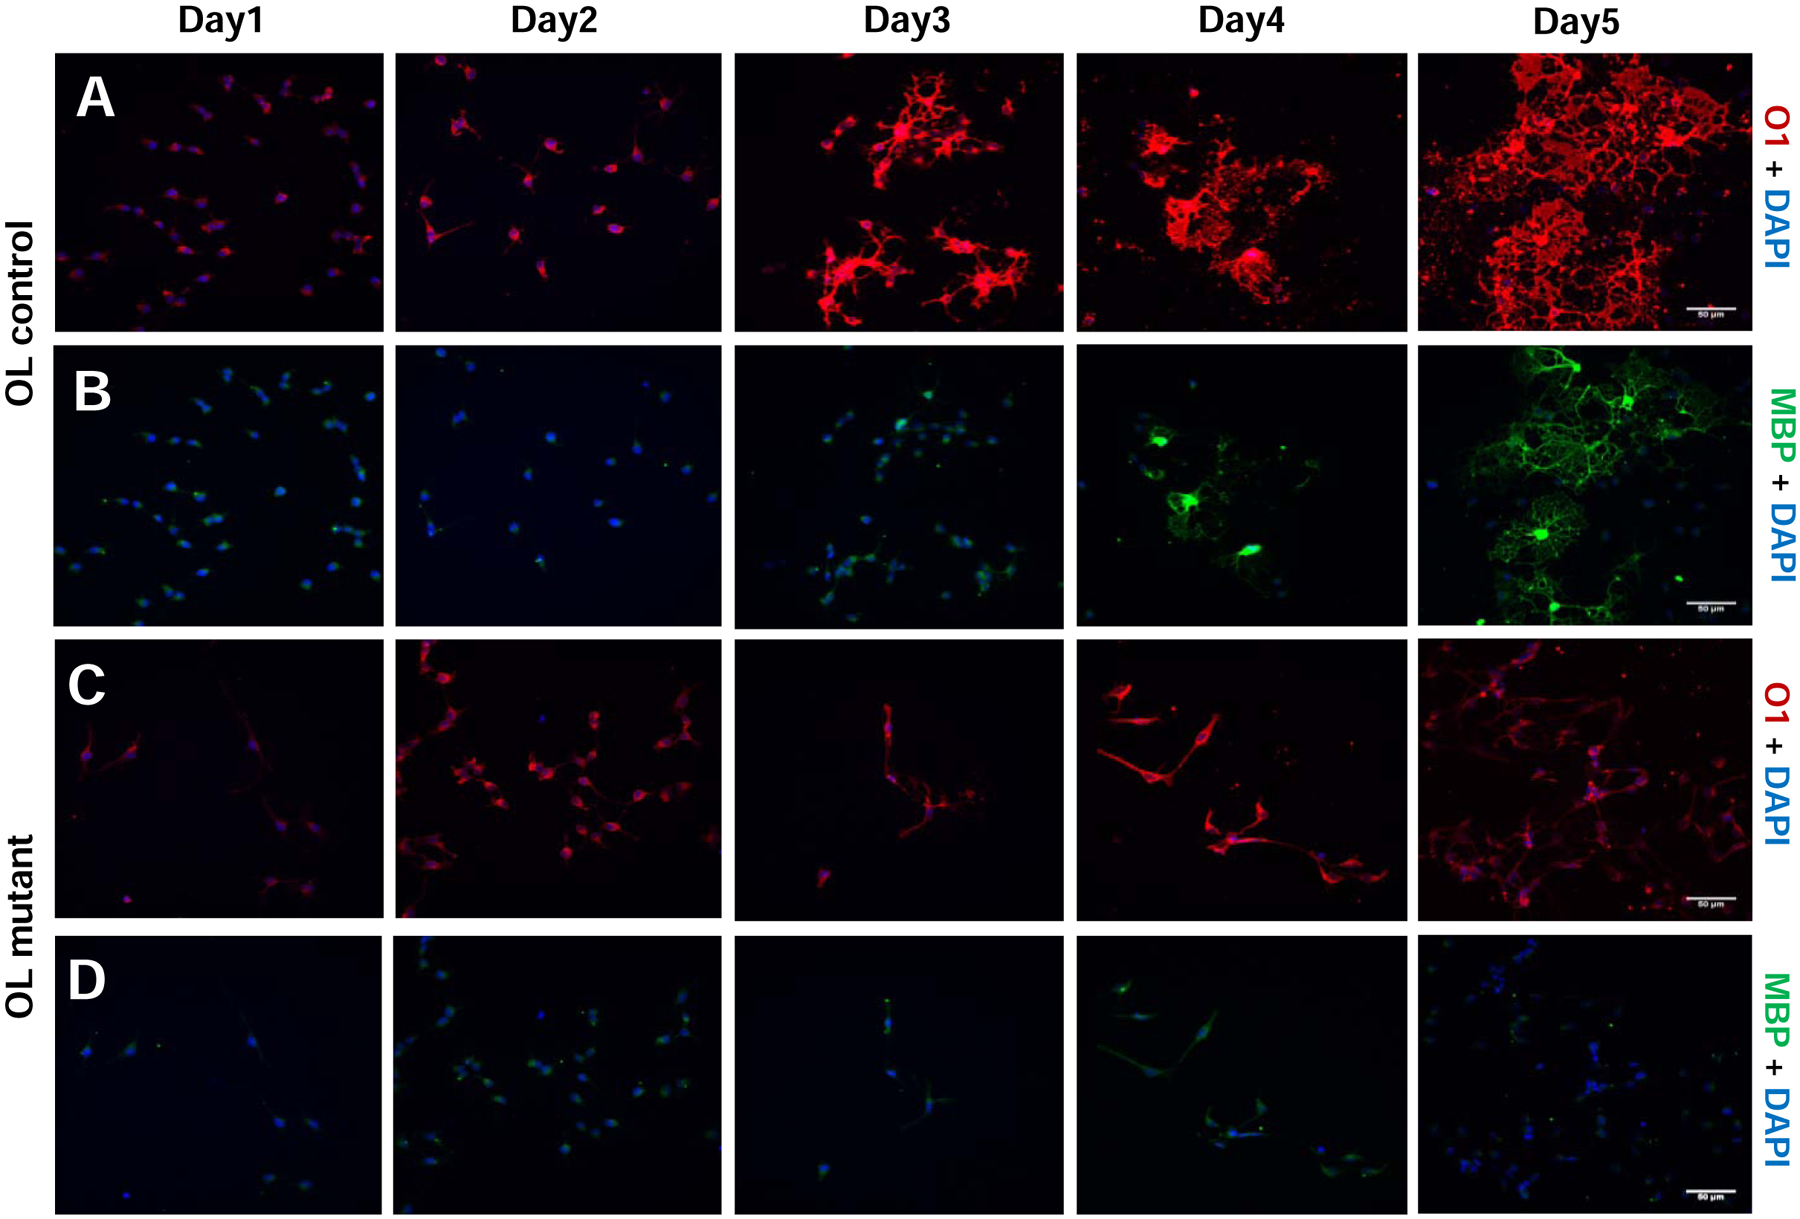
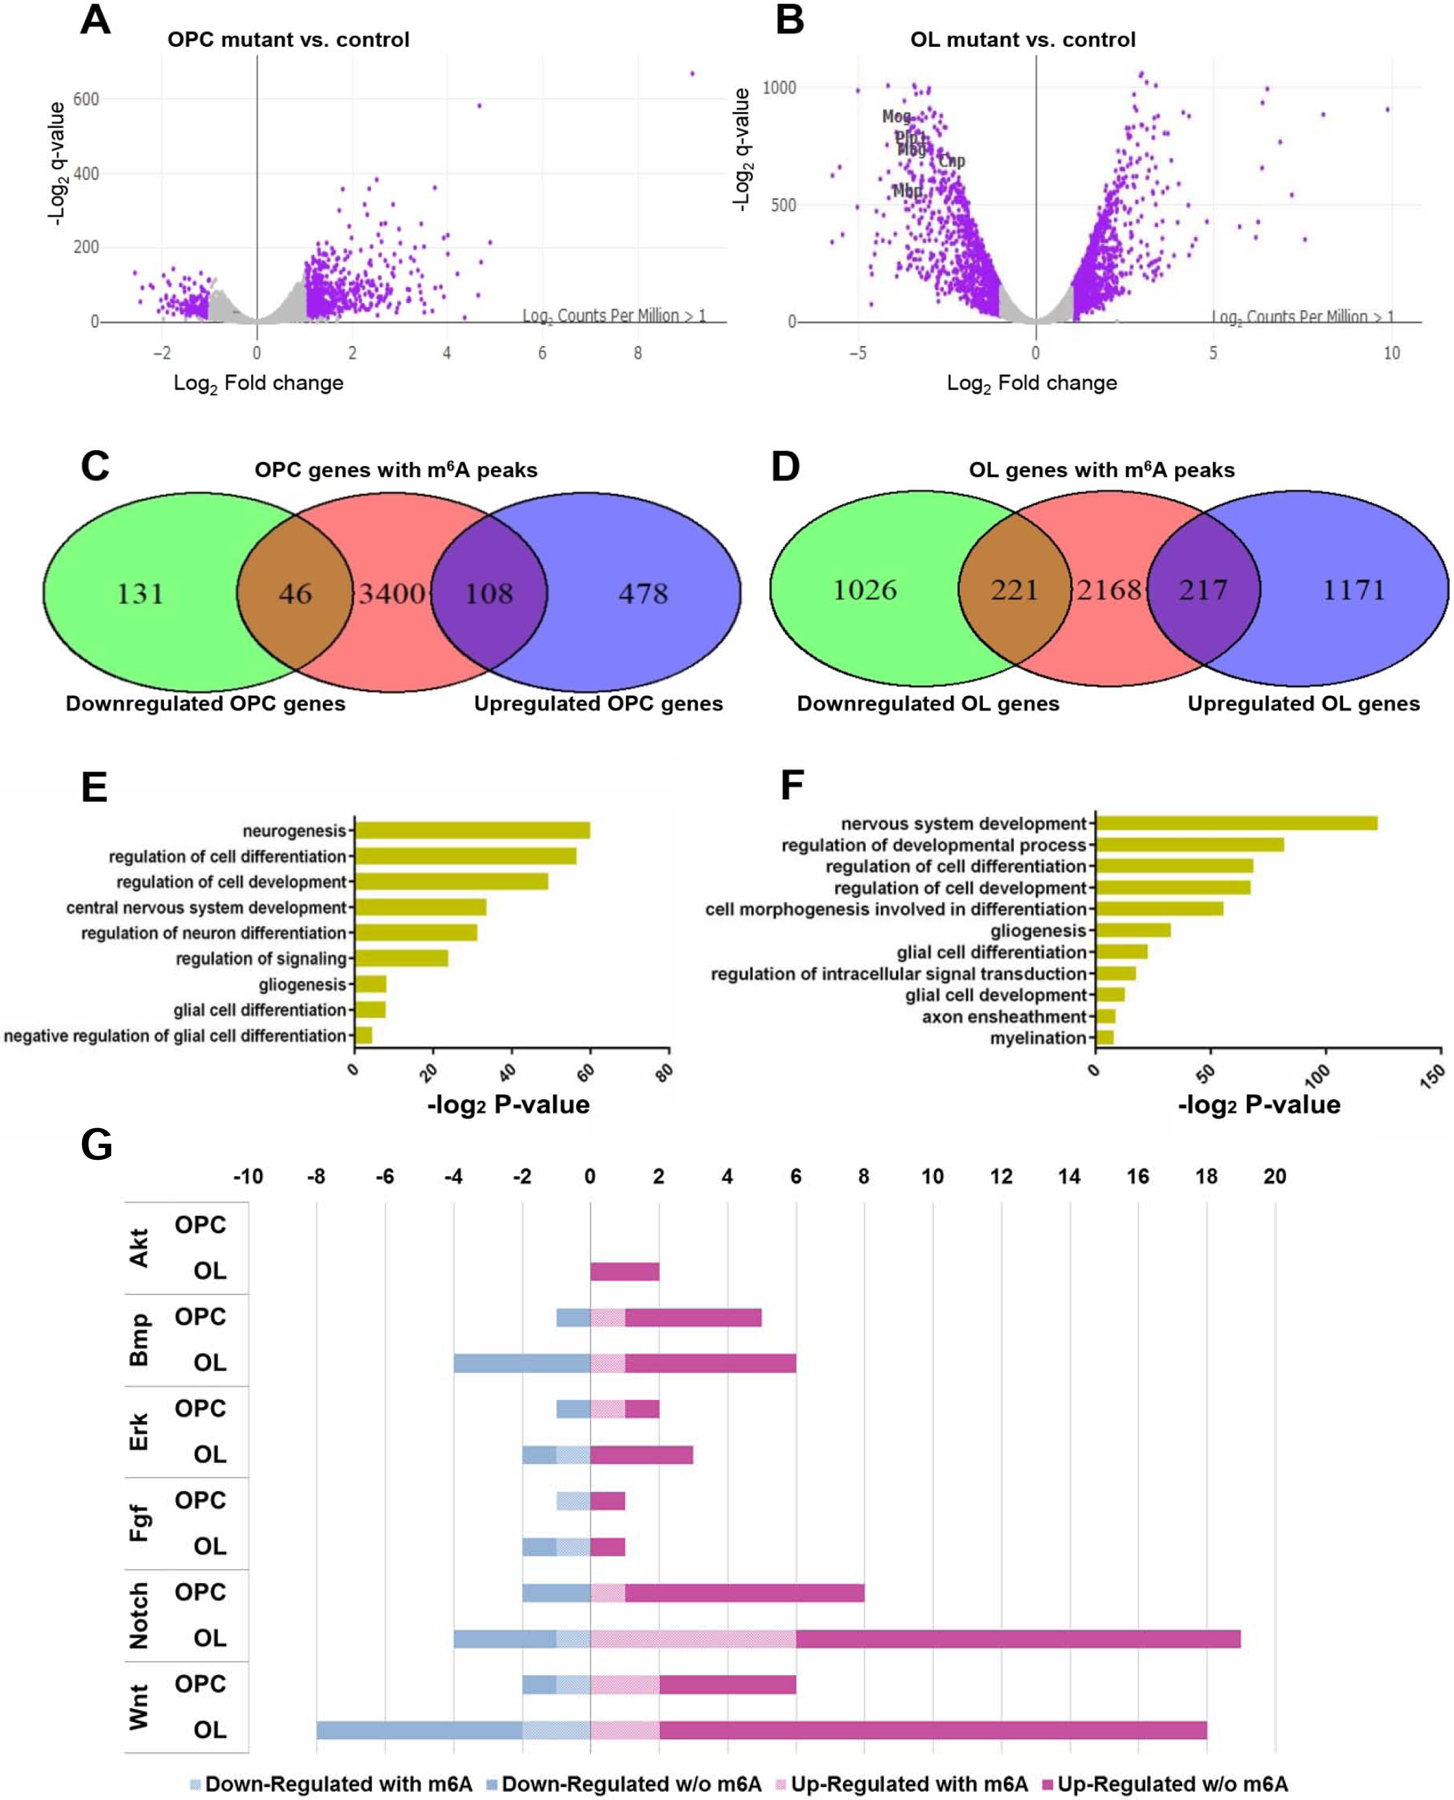
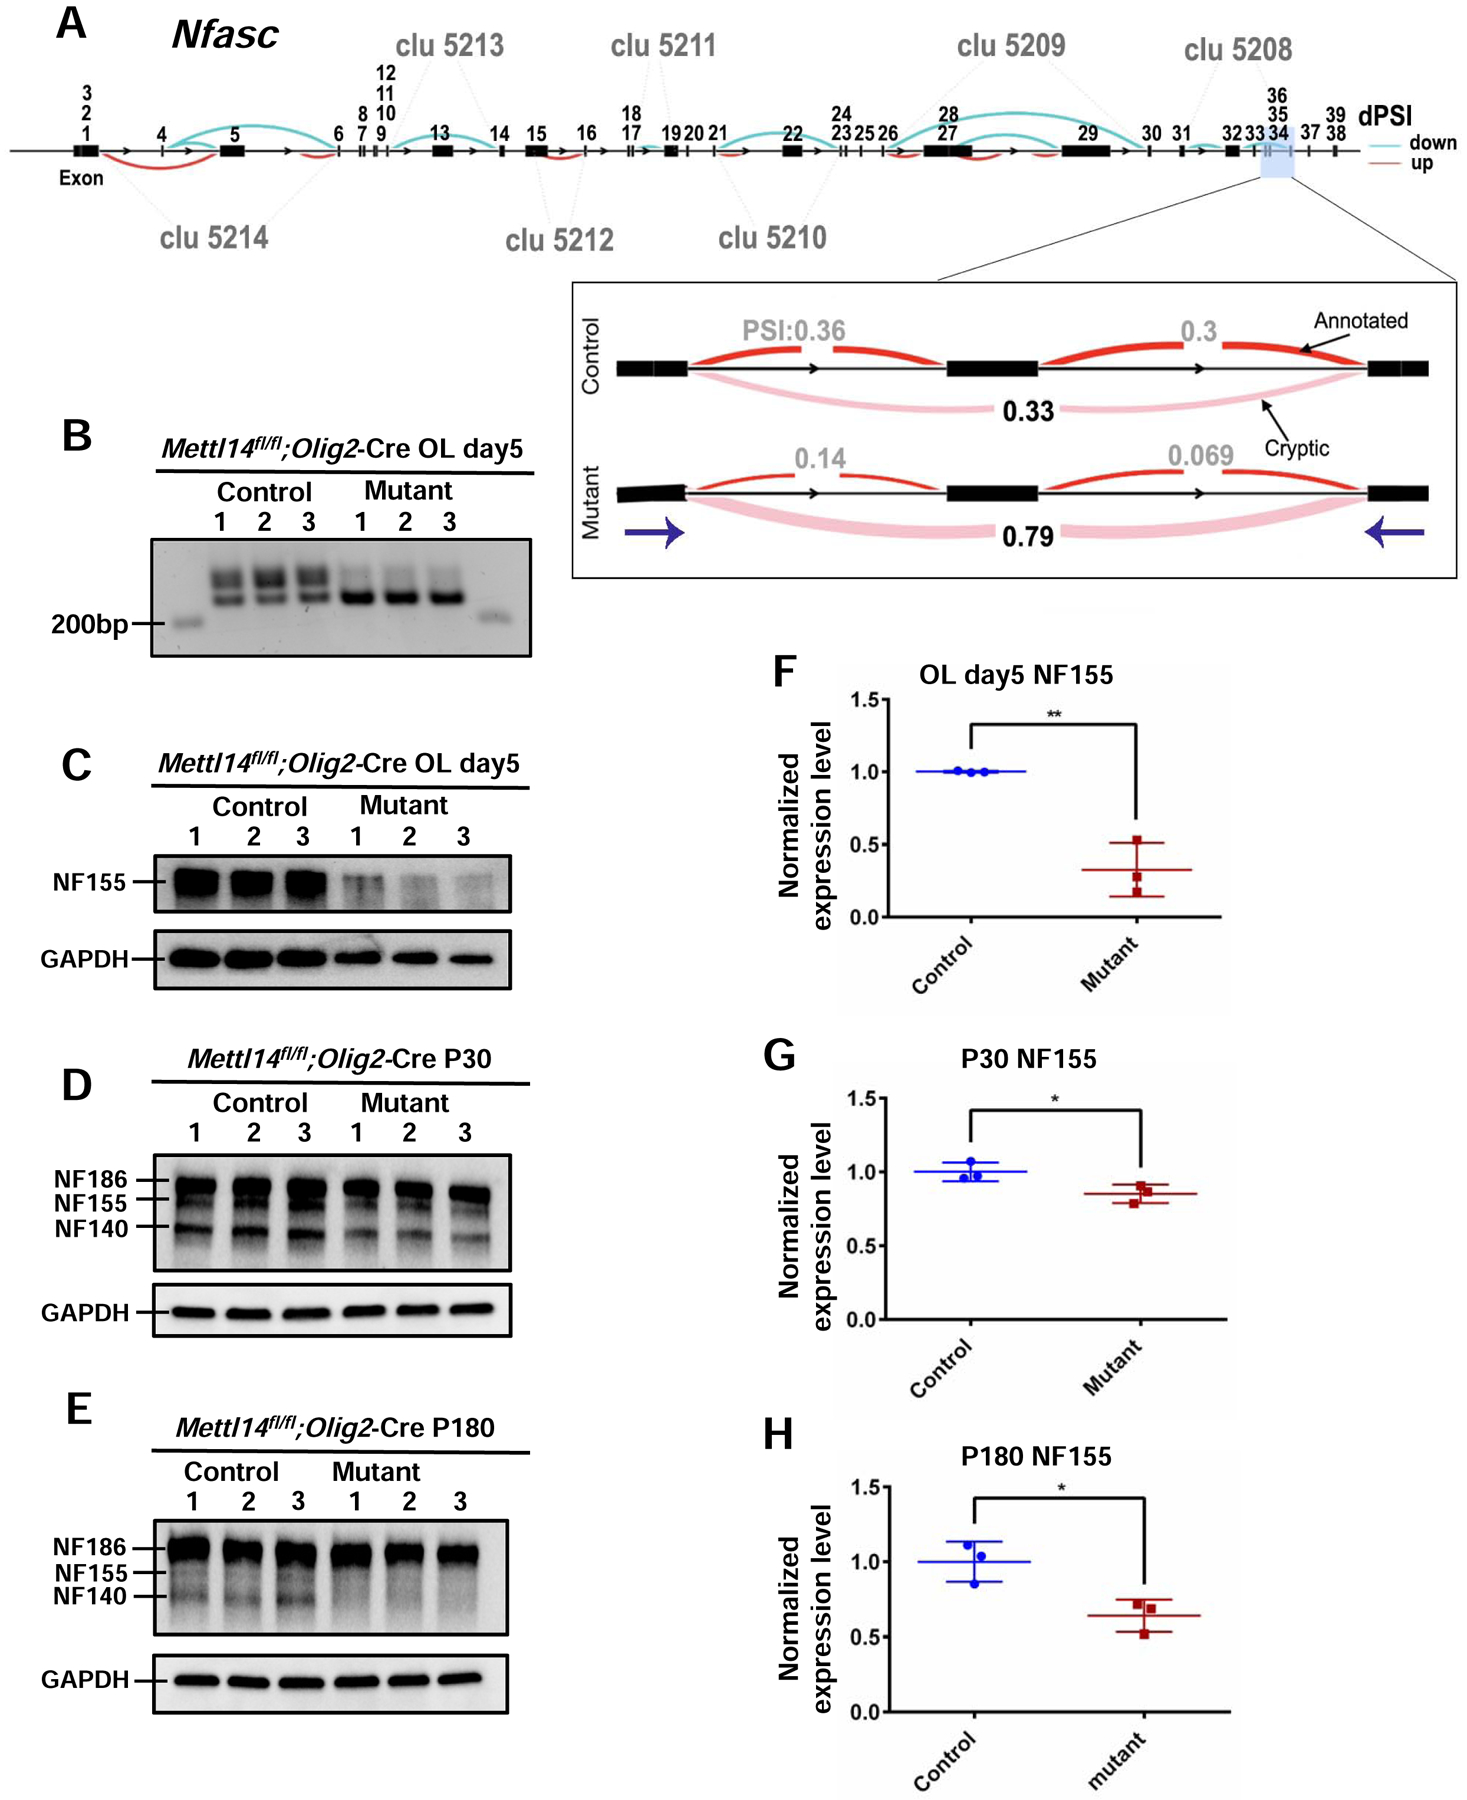
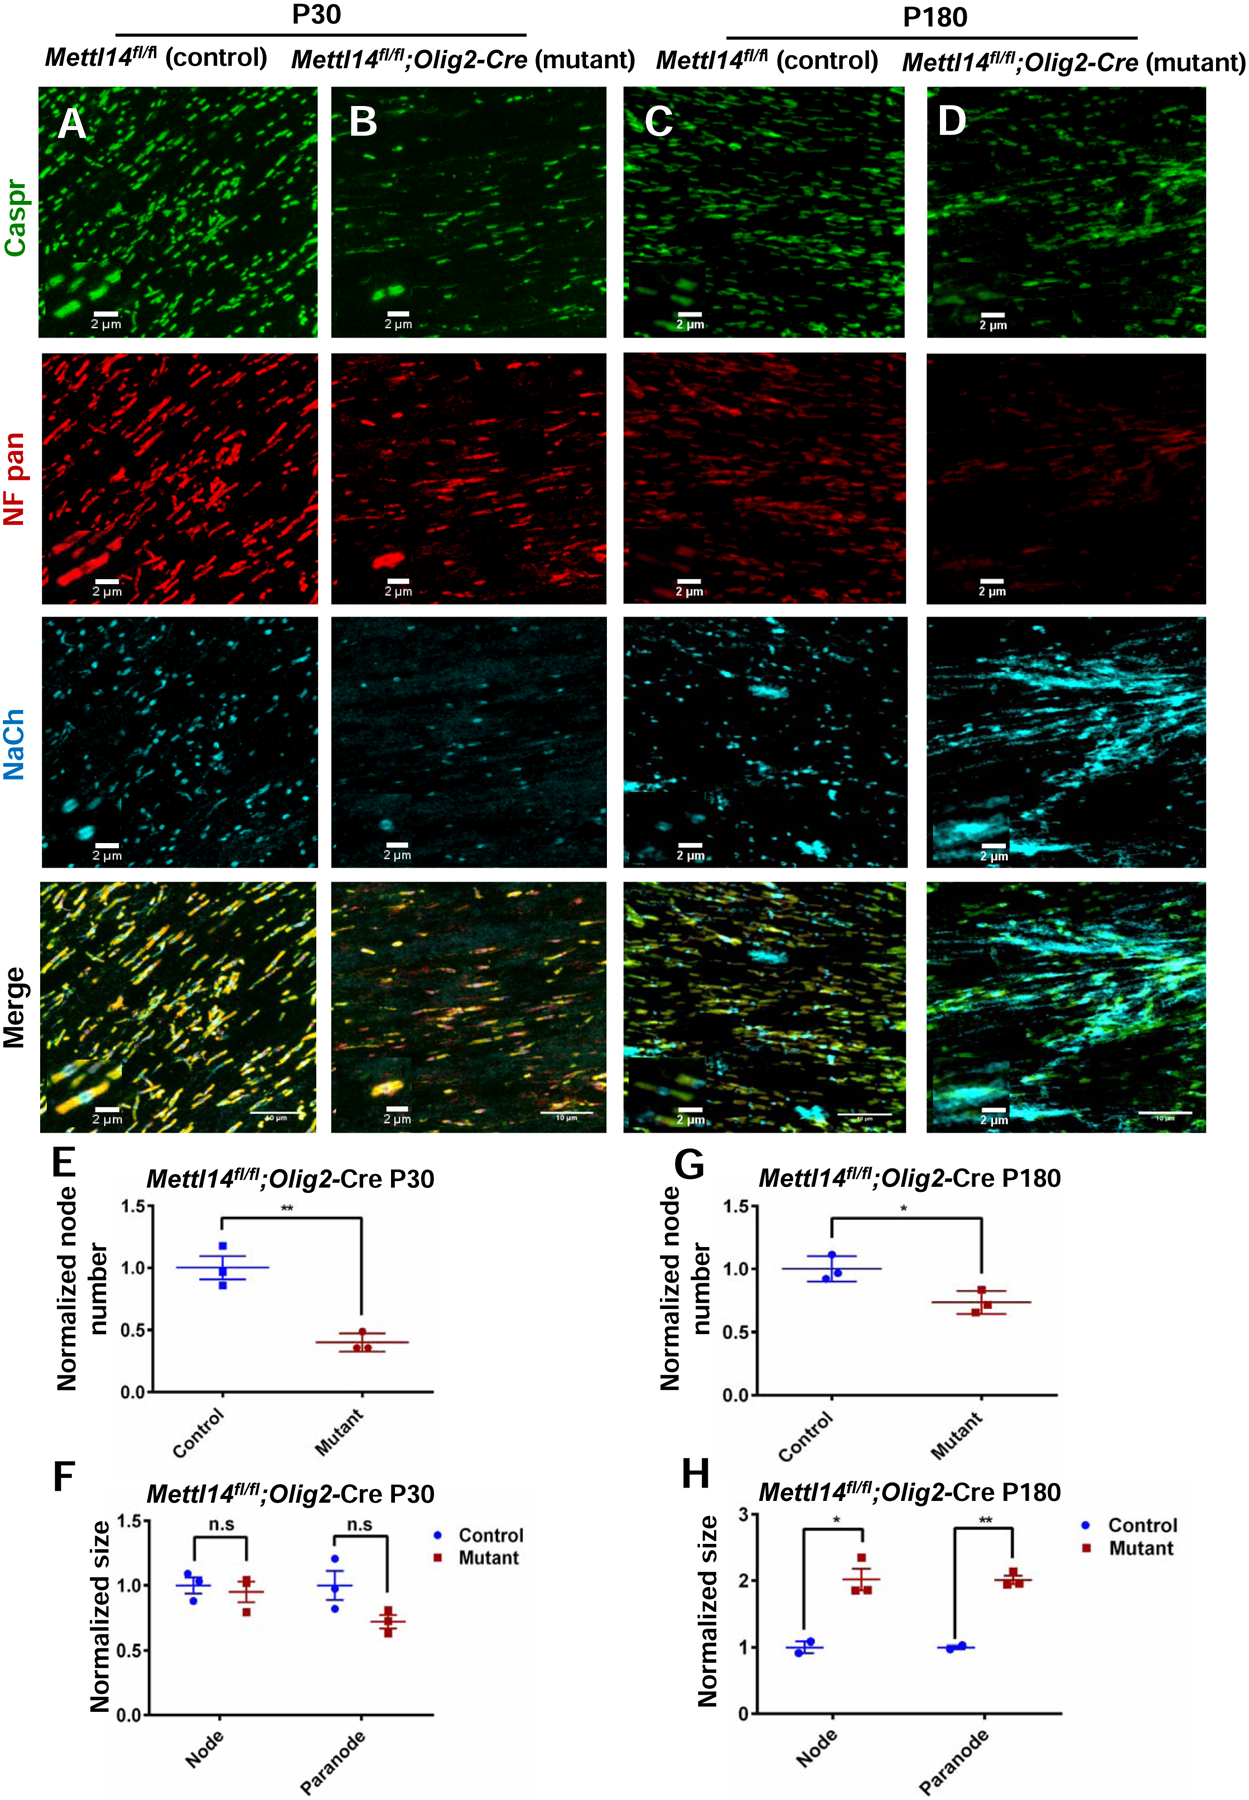
The molecular mechanisms that govern the maturation of oligodendrocyte lineage cells remain unclear. Emerging studies have shown that N6-methyladenosine (m6A), the most common internal RNA modification of mammalian mRNA, plays a critical role in various developmental processes. Here, we demonstrate that oligodendrocyte lineage progression is accompanied by dynamic changes in m6A modification on numerous transcripts. In vivo conditional inactivation of an essential m6A writer component, METTL14, results in decreased oligodendrocyte numbers and CNS hypomyelination, although oligodendrocyte precursor cell (OPC) numbers are normal. In vitro Mettl14 ablation disrupts postmitotic oligodendrocyte maturation and has distinct effects on OPC and oligodendrocyte transcriptomes. Moreover, the loss of Mettl14 in oligodendrocyte lineage cells causes aberrant splicing of myriad RNA transcripts, including those that encode the essential paranodal component neurofascin 155 (NF155). Together, our findings indicate that dynamic RNA methylation plays an important regulatory role in oligodendrocyte development and CNS myelination.

Keywords: Mettl14; NF155; RNA epigenetic regulation; alternative splicing; m(6)A; mRNA methylation; myelin; oligodendrocyte development; oligodendrocyte precursor cells; oligodendrocytes.


Conflict of interest statement

Declaration of Interests

The authors declare no competing interests.

Figures

Figure 1.
Figure 1.. Oligodendrocyte lineage progression is accompanied by changes in m6A modification on numerous transcripts.
(A) Schematic drawing of an OPC and mature oligodendrocyte. (B–C) The gene ontology categories of the m6A marked transcripts that belong to OPCs (B) and oligodendrocytes (C) (log2 |CPM|>1, Z-score>0). (D) Of the 11,502 transcripts that are expressed both in OPCs and oligodendrocytes, 2806 transcripts bear the m6A mark in OPCs, but not in oligodendrocytes. (log2 |CPM|>1, Z score>0). (E) Of the 11,502 transcripts that are expressed both in OPCs and oligodendrocytes, 1626 transcripts bear the m6A mark in oligodendrocytes, but not in OPCs. (F) Of the 11,502 transcripts that are expressed both in OPCs and oligodendrocytes, 23 transcripts bear the m6A mark in both OPCs and oligodendrocytes. (G) Mouse lines generated for this study. Mettl14fl/fl mouse line was crossed with Olig2-Cre and CNP-Cre mouse lines, to conditional eliminate Mettl14 in oligodendrocyte lineage cells and post-mitotic cells, respectively.
Figure 2.
Figure 2.. Oligodendrocyte lineage cell-specific ablation of Mettl14 results in loss of oligodendrocytes.
(A–B) Representative METTL14 (green) and Olig2 (red) immunostaining in the corpus callosum of P18 Mettl14fl/fl;Olig2-Cre control (A) and mutant (B) mice (Scale bar=100μm, 50μm). (C) Quantification analysis showing a significantly reduced percentage of Olig2+/METTL14+ double positive cells in the mutants. Values represent mean ± SEM (n=3; ***p<0.001; unpaired Student’s t-test). (D) Quantification analysis showing a statistically significant reduction of total oligodendrocyte lineage cells (Olig2+ cells). Values represent mean ± SEM (n=3; **p<0.01; unpaired Student’s t- test). (E) Representative CC1 (green) and MBP (red) immunostaining in the corpus callosum of P18 Mettl14fl/fl;Olig2-Cre control and mutant mice. Mutant corpus callosum showed visible reduction of oligodendrocytes (CC1+ cells) and patchy myelin (MBP) (Scale bar=100μm). (F) Representative PDGFR-α (red) and Ki-67 (green) immunostaining in the corpus callosum of P18 Mettl14fl/fl;Olig2-Cre control and mutant mice (Scale bar=100μm). (G) Quantification showing a significant reduction of CC1+ cells (OLs) in P18 Mettl14fl/fl;Olig2-Cre mutant corpus callosum. Values represent mean ± SEM (n=3; ***p<0.001; unpaired Student’s t-test). (H) Quantification showing no significant difference between control and mutant numbers of PDGFR-α+ cells (OPCs) in P18 Mettl14fl/fl;Olig2-Cre mice. Values represent mean ± SEM (n=3; p>0.05; unpaired Student’s t-test). (I) Quantification showing no significant difference between control and mutant numbers of PDGFR-α+ and Ki67+ double positive cells in P18 Mettl14fl/fl;Olig2-Cre mice. Values represent mean ± SEM (n=3; p>0.05; unpaired Student’s t-test). See also Figure S1, Figure S5–S7.
Figure 3.
Figure 3.. Mettl14 ablation leads to hypomyelination.
(A) Representative EM images of corpus callosum and optic nerve in P18 and P180 Mettl14fl/fl;Olig2-Cre control and mutant animals. Mutant corpus callosum and optic nerve had thinner myelin and fewer myelinated axons in both ages (Scale bar=2μm). (B) g-ratio analyses showing significantly higher g-ratios in both P18 Mettl14fl/fl;Olig2-Cre mutant corpus callosum (Mutant g ratio=0.91, control g ratio=0.80) and optic nerve (mutant g ratio= 0.90, control g ratio= 0.82), (n=3; ***p<0.001; unpaired Student’s t test). (C) g-ratio analyses showing significantly higher g-ratios in both P180 Mettl14fl/fl;Olig2-Cre mutant corpus callosum (Mutant g ratio=0.91, control g ratio=0.80) and optic nerve (mutant g ratio= 0.91, control g ratio= 0.83), (n=3; ***p<0.001; unpaired Student’s t test). (D–G) Percentage of myelinated axons in corpus callosum and optic nerve (D. P18 Mettl14fl/fl;Olig2-Cre corpus callosum, E. P18 Mettl14fl/fl;Olig2-Cre optic nerve, F. P180 Mettl14fl/fl;Olig2-Cre corpus callosum, G. P180 Mettl14fl/fl;Olig2-Cre optic nerve). (n=3, ***p<0.001; unpaired Student’s t test). (H) Western blot showing myelin protein expression (MAG, MBP) levels in both P18 and P180 Mettl14fl/fl;Olig2-Cre control and mutant animals (n=3). (I–J) Quantification of immunoblots. MAG and MBP expression levels were normalized to GAPDH expression levels. Both MAG and MBP were significantly reduced in P18 (I) and P180 (J) Mettl14fl/fl;Olig2-Cre mutants. Values represent mean ± SEM (n=3; *p<0.05; **p<0.01; ***p<0.001; unpaired Student’s t test). See also Figure S2.
Figure 4.
Figure 4.. Mettl14 ablated OPCs fail to develop into mature oligodendrocytes in vitro.
(A–B) PDGFR-α and METTL14 immunostaining of Mettl14fl/fl;Olig2-Cre control and mutant OPCs in culture. METTL14 was eliminated from the mutant OPCs, which showed no morphological changes compared to control OPCs (Scale bar=50μm). (C–D) MBP and METTL14 immunostaining of Mettl14fl/fl;Olig2-Cre control and mutant oligodendrocytes that had been cultured in differentiation media for 5 days (oligodendrocyte day5). Mutant cells fail to develop into MBP-positive cells (Scale bar=50μm). (E) Only rare cells (white arrow pointed) that had escaped Cre-mediated recombination and thus expressed METTL14 in the mutant day5 OL group successfully differentiated into MBP expressing oligodendrocytes (Scale bar=50μm). (F) Western blot showing METTL14, MAG, MBP and GAPDH expression levels in control and mutant OL day5 groups. (G) Quantification of immunoblots showing significant reduction of METTL14, MAG and MBP expression in mutant OL day5 group. METTL14, MAG and MBP expression levels were normalized to GAPDH expression level. Values represent mean ± SEM (n=3; **p<0.01; ***p<0.001, unpaired Student’s t test). See also Figure S4.
Figure 5.
Figure 5.. Mettl14 ablation prevents oligodendrocyte differentiation.
(A–B) O1 and MBP immunostaining of Mettl14fl/fl (control) oligodendrocytes that had been seeded in differentiation media for 1–5 days (day1–5). Control cells progressively differentiated into mature oligodendrocytes (Scale bar=50μm). (C–D) O1 and MBP immunostaining of Mettl14fl/fl;Olig2-Cre (mutant) oligodendrocytes that had been seeded in differentiation media for 1–5 days (day1–5). Mutant cells did not differentiate into MBP positive oligodendrocytes, and never formed membrane sheath structures like control cells (Scale bar=50μm).
Figure 6.
Figure 6.. Mettl14 deletion differentially alters OL and OPC transcriptome.
(A–B) Volcano plots display the differentially expressed genes in the Mettl14fl/fl;Olig2-Cre OPCs (A) and oligodendrocytes (B) mutants versus controls (n=3). The highlighted genes (purple) are significantly (q-value<0.001, log2 |CPM|>1) regulated and have a notable fold change (log2 |FC|>1) in their expression in the mutants. Selected myelin genes are labeled. (C–D) Venn diagram shows the numbers of significantly downregulated or upregulated OPC (C) and oligodendrocyte (OL) (D) transcripts that also have the m6A mark. (E–F) The ontology categories of the m6A marked transcripts that are significantly altered in the OPCs (E) and oligodendrocytes (F). (log2 |FC|>1, log2 |CPM|>1, q-value <0.001, Z-score>0). (G) Bar graph shows the number of m6A marked transcripts in the selected altered signaling pathways in OPCs and oligodendrocytes. (log2 |FC|>1, log2 |CPM|>1, q-value<0.001, Z-score>0). See also Figure S8, Table S1–S5
Figure 7.
Figure 7.. Mettl14 deletion differentially alters Nfasc155 alternative splicing and expression.
(A) Schematic view of differentially spliced sites in the Nfasc gene in control versus Mettl14fl/fl;Olig2-Cre mutant day5 oligodendrocytes. The 39 Nfasc exons are labeled above the exons. Each cluster (i.e. abbreviated as “clu X”) represents a group of introns that display alternative excision events. Specifically, these are introns that share a donor site (canonical 5’ splice site, AT) or acceptor site (canonical 3’ splice site, GA). Blue curves represent cases that have fewer splicing events in the mutants, while the red represent cases with more splicing events in the mutants (p<0.05). The magnified window shows the sample cluster (clu 5208) that we examined for the presence of aberrant spliced isoforms in the mutants in panel B. Purple arrows represent the start points for reverse and forward primers that we used for RT-PCR in (B). (B) Differentially spliced Nfasc isoform were detected by RT-PCR and agarose gel electrophoresis in the Mettl14fl/fl;Olig2-Cre day5 oligodendrocyte mutants (218kb). (Primers used: Forward: ACTGGGAAAGCAGATGGTGG Reverse: ACATGAGCCCGATGAACCAG). (C–E) Western blot results of NFASC in vitro (C) and in vivo (D:P30, E:P180) (F–H) Quantification of NF155 expression in vitro (F) and in vivo (G:P30, H:P180). NF155 expression level was normalized to GAPDH expression level. NF155 had significant reduction in both P30 and P180 Mettl14fl/fl;Olig2-Cre mutants. Values represent mean ± SEM (n=3; *p<0.05; **p<0.01; unpaired Student’s t test). See also Figure S3, Table S6–S7.
Figure 8.
Figure 8.. Mettl14 deletion results in aberrant node and paranode morphology.
(A–B) Representative immunostaining with Caspr, Nfasc and NaCh in P30 Mettl14fl/fl;Olig2-Cre control and mutant corpus callosum. Representative node(s) of Ranvier are shown in magnified windows. (Scale bar=10μm, 2μm) (C–D) Representative immunostaining with Caspr, Nfasc and NaCh in P180 Mettl14fl/fl;Olig2-Cre control and mutant corpus callosum. Representative node(s) of Ranvier are are shown in magnified windows. (Scale bar=10μm, 2μm) (E, G) Quantification of node number (NaCh positive) in P30(E) and P180(G) Mettl14fl/fl;Olig2-Cre control and mutant corpus callosum. Normalized number = mutant count / control count (=1) (n=3; *p<0.05; **p<0.01, unpaired Student’s t-test). (F, H) Quantification of node (Caspr, NaCh positive) and paranode (Nfasc, Caspr double positive) size in P30 (F) and P180 (H) Mettl14fl/fl;Olig2-Cre control and mutant corpus callosum. Normalized size = mutant size / control size (=1) (control n=2 mutant n=3; *p<0.05; **p<0.01, unpaired Student’s t-test).

Similar articles

Cited by

References

    1. Aaker JD, Elbaz B, Wu Y, Looney TJ, Zhang L, Lahn BT, and Popko B (2016). Transcriptional fingerprint of hypomyelination in zfp191null and shiverer (mbpshi) mice. ASN Neuro 8. - PMC - PubMed
    1. Alarcón CR, Goodarzi H, Lee H, Liu X, Tavazoie S, and Tavazoie SF (2015). HNRNPA2B1 Is a Mediator of m(6)A-Dependent Nuclear RNA Processing Events. Cell 162, 1299–1308. - PMC - PubMed
    1. Batista PJ, Molinie B, Wang J, Qu K, Zhang J, Li L, Bouley DM, Lujan E, Haddad B, Daneshvar K, et al. (2014). m(6)A RNA modification controls cell fate transition in mammalian embryonic stem cells. Cell Stem Cell 15, 707–719. - PMC - PubMed
    1. Benjamini Y, and Yekutieli D (2005). False discovery rate–adjusted multiple confidence intervals for selected parameters. J. Am. Stat. Assoc 100, 71–81.
    1. Bergles DE, and Richardson WD (2015). Oligodendrocyte development and plasticity. Cold Spring Harb. Perspect. Biol 8, a020453. - PMC - PubMed

Publication types

MeSH terms