. 2020 Feb 20;77(4):810-824.e8.
doi: 10.1016/j.molcel.2019.12.003. Epub 2019 Dec 31.

Lipid Droplet-Derived Monounsaturated Fatty Acids Traffic via PLIN5 to Allosterically Activate SIRT1

Affiliations

Lipid Droplet-Derived Monounsaturated Fatty Acids Traffic via PLIN5 to Allosterically Activate SIRT1

Charles P Najt et al. Mol Cell. .

Abstract

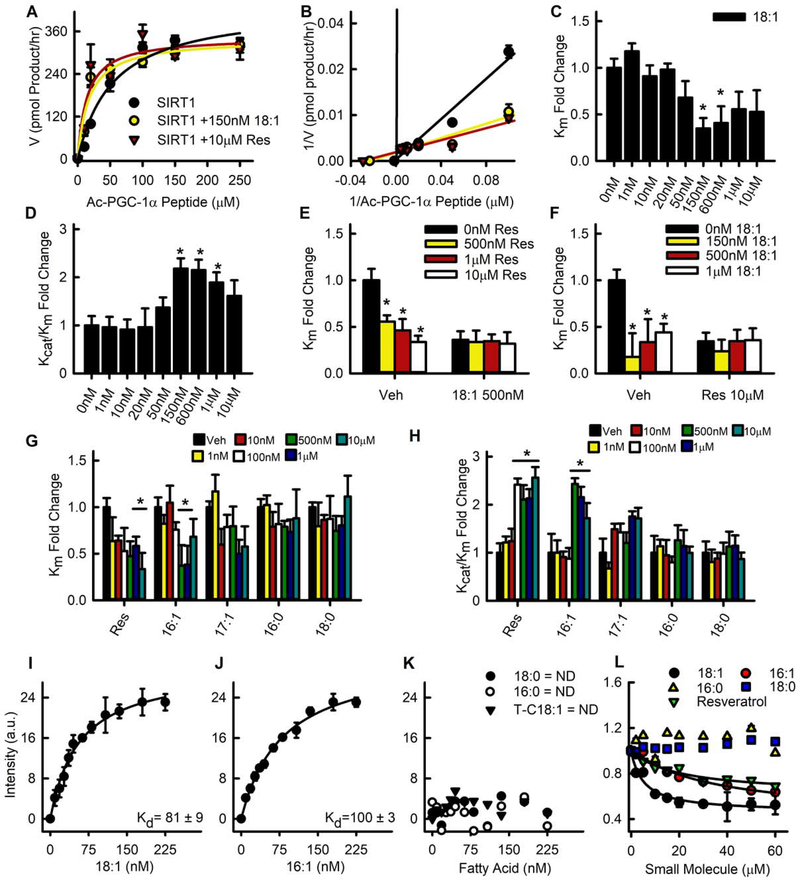
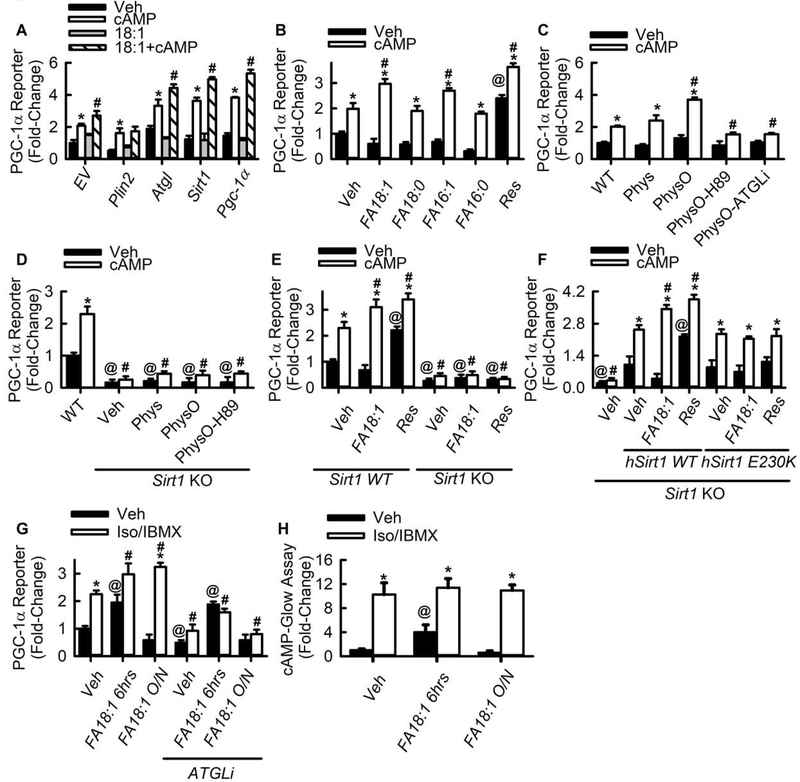
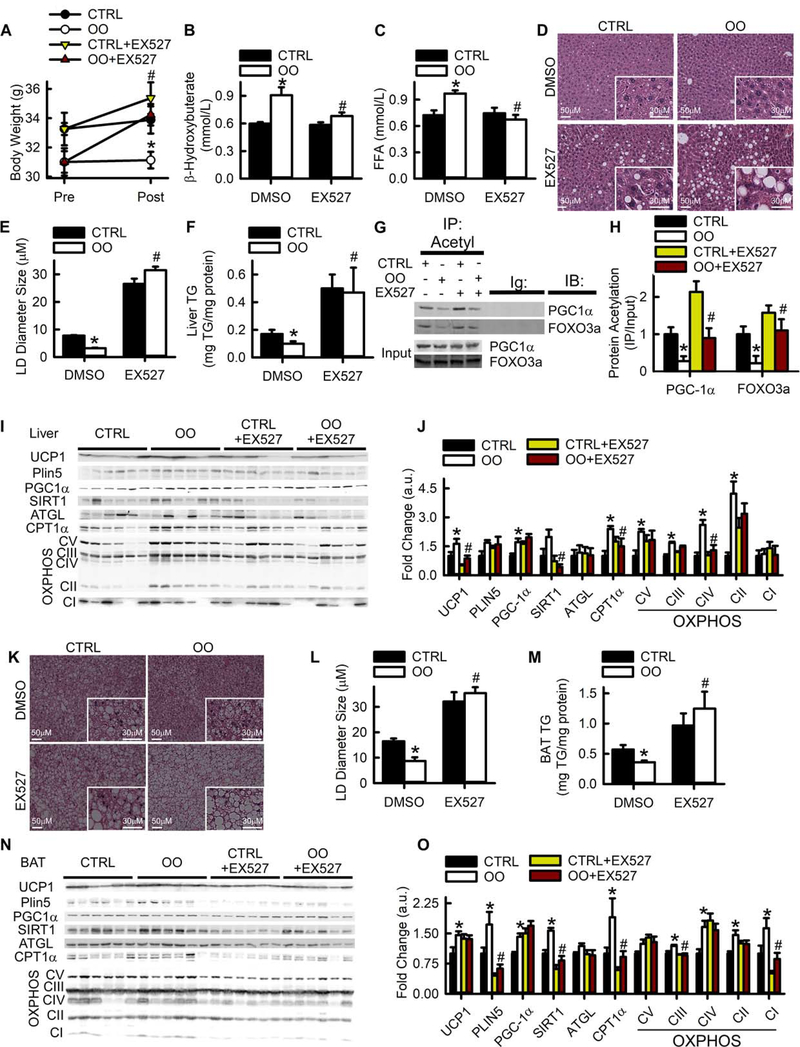
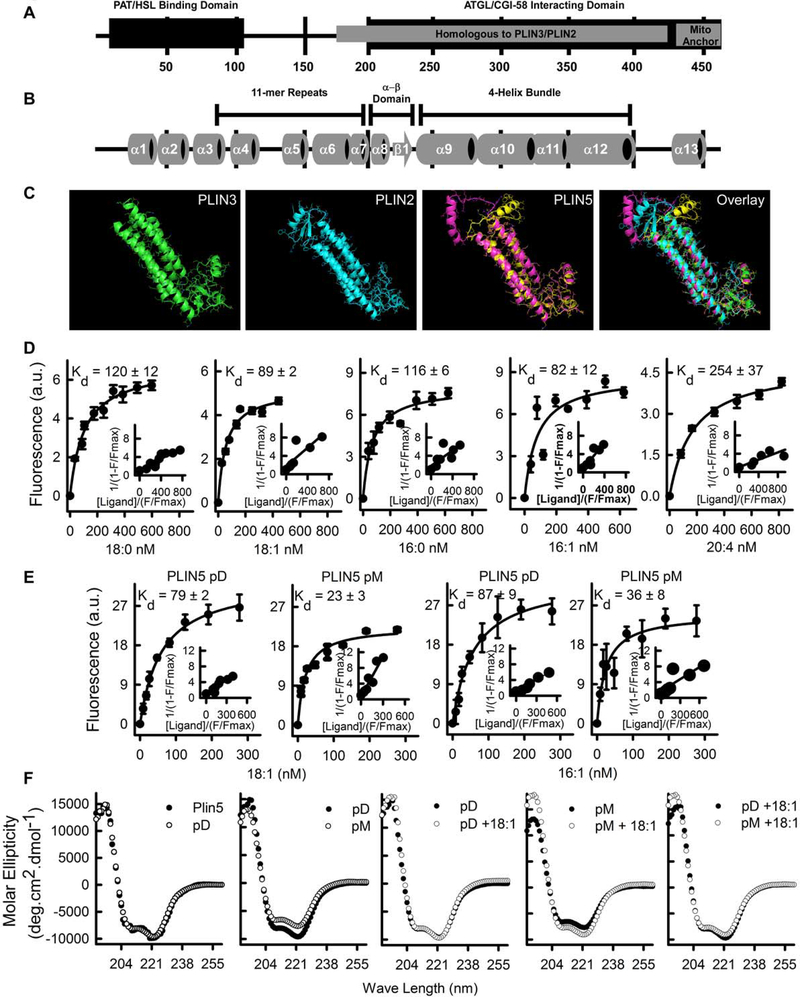
Lipid droplets (LDs) provide a reservoir for triacylglycerol storage and are a central hub for fatty acid trafficking and signaling in cells. Lipolysis promotes mitochondrial biogenesis and oxidative metabolism via a SIRT1/PGC-1α/PPARα-dependent pathway through an unknown mechanism. Herein, we identify that monounsaturated fatty acids (MUFAs) allosterically activate SIRT1 toward select peptide-substrates such as PGC-1α. MUFAs enhance PGC-1α/PPARα signaling and promote oxidative metabolism in cells and animal models in a SIRT1-dependent manner. Moreover, we characterize the LD protein perilipin 5 (PLIN5), which is known to enhance mitochondrial biogenesis and function, to be a fatty-acid-binding protein that preferentially binds LD-derived monounsaturated fatty acids and traffics them to the nucleus following cAMP/PKA-mediated lipolytic stimulation. Thus, these studies identify the first-known endogenous allosteric modulators of SIRT1 and characterize a LD-nuclear signaling axis that underlies the known metabolic benefits of MUFAs and PLIN5.

Keywords: ATGL; MUFA; PGC-1α; PLIN5; SIRT1; fatty acids; lipid droplets; lipolysis; olive oil; oxidative metabolism.


Conflict of interest statement

Declaration of Interests The authors declare no competing interests.

Figures

Fig. 1.
Fig. 1.. The MUFAs 18:1 and 16:1 allosterically activate SIRT1 towards a PGC-1α substrate.
A) Saturation plot of the effect of fatty acids and resveratrol (Res) on human SIRT1 enzyme activity was measured by mass spectrometry (see supplemental methods) using a native peptide sequence of acetylated-PGC-1α. B) Lineweaver-Burk reciprocal plots were generated to determine Km, Vmax, and Kcat. C-D) Km and Kcat/Km fold change for each concentration of 18:1. E-F) Competition assays between 18:1 and resveratrol. G-H) Km and Kcat/Km fold change for each concentration of resveratrol and long chain fatty acids. I-K) SIRT1 binding affinity for fatty acids was determined by tryptophan fluorescence quenching assay (ND=not detected). L) Displacement of 1,8-ANS was used to determine the Ki of SIRT1 for fatty acids and resveratrol.
Fig. 2.
Fig. 2.. MUFAs selectively activate SIRT1.
A) Saturation plot of SIRT1 activity towards FOXO3a and the effects of 18:1 and resveratrol (n=4). B) Lineweaver-Burk reciprocal plots were generated to determine Km, Vmax, and Kcat for the FOXO3a peptide substrate. C-D) Km and Kcat/Km fold change for each concentration of 18:1 on FOXO3a. E) Kcat/Km fold change for resveratrol (Res; 10 μM). F) Saturation plot of SIRT1 activity towards H3 and the effects of 18:1 and resveratrol. G) Lineweaver-Burk reciprocal plots for the H3 peptide substrate. H-I) Km and Kcat/Km fold change for each concentration of 18:1 with H3. J-K) Kcat/Km fold change for each concentration of resveratrol and fatty acids for the H3 peptide substrate. L) Competition assay of SIRT1 activity towards FOXO3A, PGC-1α and H3 acetylated peptide substrates.
Fig. 3.
Fig. 3.. Lipolytically-derived MUFA synergize with cAMP and signal via SIRT1 to activate PGC-1α.
A) PGC-1α luciferase reporter assays in primary hepatocytes transfected with the various overexpression plasmids (n=6–12). *p<0.05 vs. drug veh, #p<0.05 vs. cAMP alone. B) PGC-1α luciferase reporter assays in MEFs loaded with saturated fatty acids, MUFAs, or resveratrol (n=6–12). *p<0.05 vs. drug veh, #p<0.05 vs. lipid veh treated with cAMP. C) PGC-1α luciferase reporter assays in hepatocytes loaded with a physiological mix of fatty acids lacking 18:1 (Phys), or a physiological mix enriched in 18:1 (PhysO). ATGL inhibition was achieved by the addition of 30 μM ATGListatin (ATGLi). PKA inhibition was achieved by addition of 15 μM H89. Both drugs were administered for 1 hr followed by addition of 8-bromoadenosine 3’,5’-cyclic monophosphate (cAMP; 1mM). (n=6–12). *p<0.05 vs. drug veh, #p<0.05 vs. wild-type cells not loaded with lipid treated with cAMP. D) PGC-1α luciferase reporter assays in wild-type or Sirt1 knockout MEFs preloaded with as physiological mix of fatty acid and subsequently treated with inhibitors (n=6–12). *p<0.05 vs. drug veh, @P<0.05 vs wild-type, # p<0.05 vs. wild-type cells treated with cAMP. E) PGC-1α luciferase reporter assays in wild-type or Sirt1 knockout MEFs exposed to fatty acid or resveratrol preloading (n=6–12). *p<0.05 vs. wild-type treated with drug veh, @P<0.05 vs. lipid veh wild-type, #p<0.05 vs. lipid veh wild-type cells treated with cAMP. F) PGC-1α reporter assays from Sirt1 knockout cells transfected with human Sirt1 or human Sirt1 E230K mutant (n=8–12). *p<0.05 vs. drug veh, @P<0.05 vs. lipid veh treated hSirt1 expressing cells, #p<0.05 vs. lipid veh treated hSirt1 expressing cells treated with cAMP. G) PGC-1α reporter assays in MEFs loaded with 500 μM 18:1 acutely (6 hrs) or overnight (O/N - 16hrs). Lipolytic activation was achieved by the addition of 20 μM isoproterenol and 500 μM IBMX. ATGL inhibition was achieved by the addition of 30 μM ATGListatin (ATGLi) (n=6–12). *p<0.05 vs. drug veh, @P<0.05 vs. lipid veh, #p<0.05 vs. lipid veh treated with Iso/IBMX. H) Cellular cAMP levels were measured in MEF cells loaded acutely overnight with 500 μM 18:1 (n=12–16). Lipolytic activation was achieved by the addition of 20 μM isoproterenol and 500 μM IBMX.*p<0.05 vs. drug veh, @P<0.05 vs. lipid veh without Iso/IBMX, #p<0.05 vs. lipid veh treated with Iso/IBMX.
Fig. 4.
Fig. 4.. MUFAs increases oxidative metabolism in vivo through SIRT1 activation.
A) Body weight of mice fed a control diet (CTRL) or a diet enriched in olive oil (OO). Three days prior to sacrifice mice were injected with 10mg/kg of EX527. Body weights were determined before and after EX527 treatment. B-C) Serum β-hydroxybutyrate and free fatty acid levels in C57Bl/6 mice were fed diets low in MUFAs (CTRL; black bars) or enriched in 18:1 (OO; white bars). A subset of mice were injected with 10 mg/kg daily of the SIRT1 inhibitor EX527 for 3 days prior to sacrifice. D-E) H&E staining of liver tissues from CTRL and OO fed mice. LD size was determined using 3–4 images from 2–3 mice per group. F) Quantification of TAG in liver samples was determined using 3–4 mice per group. G) Western blots of total and acetylated-PGC-1α and FOXO3a in livers from 3–4 mice. H) Quantification of immunoprecipitated acetylated-PGC-1α and FOXO3a. I-J) Relative protein expression levels of UCP1, PLIN5, PGC-1α, SIRT1, ATGL, CPT1α, and OXPHOS complex CI-V in liver were determined by Western blotting and quantified by densitometric analysis. K-L) H&E staining of brown adipose tissue (BAT) from CTRL and OO fed mice. LD size was determined using 3–4 images from 2–3 mice per group. M) Quantification of TAG in BAT samples was determined using 3–4 mice per group. N-O) Relative protein expression levels of UCP1, PLIN5, PGC-1α, SIRT1, ATGL, CPT1α, and OXPHOS complex CI-V in BAT were determined by Western blotting and quantified by densitometric analysis. *p<0.05 vs. CTRL diet, #p<0.05 vs. DMSO.
Fig. 5.
Fig. 5.. ATGL-mediated activation of PGC-1α requires PLIN5.
A) PGC-1α luciferase reporter assays in wild-type or Plin5 knockout mouse L-cells transduced with control (Gfp) or Atgl adenoviruses. Rescue experiments were performed with overexpression of a plasmid harboring mCherry-Plin5. ATGL inhibition was achieved by the addition of 30 μM ATGListatin (ATGLi) (n=6). *p<0.05 vs. veh, #p<0.05 vs. wild-type, @p<0.05 vs. within treatment vehicle. B) PGC-1α luciferase reporters in primary hepatocytes transfected with control (Ctrl) or Plin5 ASOs. Treatment with EX527 (30 μM) was used to inhibit SIRT1 (n=6–12). *p<0.05 vs. veh, #p<0.05 vs Ctrl ASO, @p<0.05 vs within treatment vehicle. C) PGC-1α/PPAR α target gene expression in livers of mice treated with control or Plin5 ASOs and adenoviruses harboring Gfp or Atgl (n=6–8). *p<0.05 vs. GFP, #p<0.05 vs. Con ASO. D) PGC-1α luciferase reporters in wild-type or Plin5 knockout mouse L-cells transfected with an empty mCherry-vector (EV), mCherry-Plin5, mCherry-Plin5-pD, or mCherry-Plin5-pM (n=6). *p<0.05 vs veh, #p<0.05 vs. wild-type, @ p<0.05 vs. veh. treated Plin5-pM cells. E) Confocal imaging of mCherry-Plin5 transfected cells pretreated with vehicle or the PKA inhibitor H89 (15 μM) for 1 hr followed by addition of 8-bromoadenosine 3’,5’-cyclic monophosphate (cAMP; 1mM) for an additional hour. Cells were also transduced with control or shRNA adenoviruses (repeated with 3 individual hepatocyte isolations). F) Livers from 4 and 16 hr fasted mice were harvested and subjected to histological sectioning and immunostaining to detect PLIN5 (n=3).
Fig. 6.
Fig. 6.. PLIN5 is a fatty acid binding protein.
A) PLIN5 contains several domains of interest including the PAT/HSL binding domain, an ATGL/CGI-58 binding domain, a mitochondria anchor, and a region homologous to PLIN3/PLIN2. B) Based on prediction software (SABLE2, SAM and PsiPRED) and the known X-ray crystal structure of the homologous PLIN3 protein, the predicted secondary structure of PLIN5 contains 13 α-helices and 1 small β strand interconnected by random coils and unordered structure. C) The X-ray crystal structure of PLIN3 was used to homology model the C-terminal region of PLIN5. The crystal structure of PLIN3 is shown on the farthest left panel (residues 191–437, PDB entry 1SZI). PLIN2 homology model from (Najt et al., 2014) is shown in the second to the left panel, while the PLIN5 models are shown second from the right. Two structures, yellow and pink, were generated by the homology modeler Phyre2 each having a high-probability score. The region that differed between the two PLIN5 models was an α-helix connected to the 4-helix bundle by unordered structure. The structure contains a 4-helix bundle, which together with an α-β domain form the cleft, that when overlaid with the PLIN2 model aligns with the lipid binding pocket outlined in (Najt et al., 2014). D) The PLIN5 binding affinity for fatty acids was determined when recombinant protein was tittered with increasing amounts of ligand using a quenching of tryptophan fluorescence assay (n=4). E) PLIN5-pD (S155A) and PLIN5-pM (S155E) binding affinities for MUFAs were determined in a similar manner as PLIN5 (n=4). F) Circular dichroic analysis of PLIN5-pD and PLIN5-pM. Far ultraviolet (UV) circular dichroic (CD) spectra of PLIN5, PLIN5-pD and PLIN5-pM was shown in the presence or absence of ligand. Each spectrum represents an average of ten scans repeated in triplicate.
Fig. 7.
Fig. 7.. Monounsaturated fatty acids traffic via PLIN5 to allosterically activate SIRT1.
A model describing lipid droplet derived monounsaturated fatty acids allosterically modulating SIRT1 via PLIN5.

References

    1. Ahmadian M, Duncan RE, and Sul HS (2009). The skinny on fat: lipolysis and fatty acid utilization in adipocytes. Trends Endocrin Metab 20, 424–428. - PMC - PubMed
    1. Aldridge GM, Podrebarac DM, Greenough WT, and Weiler IJ (2008). The use of total protein stains as loading controls: An alternative to high-abundance single-protein controls in semi-quantitative immunoblotting. J Neuroscience Methods 172, 250–254. - PMC - PubMed
    1. Atshaves BP, Petrescu AD, Starodub O, Roths JB, Kier AB, and Schroeder F (1999). Expression and intracellular processing of the 58 KDa SCP-x/3-oxoacyl-CoA thiolase in transfected mouse L cells. J Lipid Res 40, 610–622. - PubMed
    1. Atshaves BP, Storey SM, Petrescu AD, Greenberg C, Lyuksyutova OI, Smith R III, and Schroeder F (2002). Expression of Fatty Acid Binding Proteins Inhibits Lipid Accumulation and Alters Toxicity in L-cell Fibroblasts. Am J Phys 283, C688–C703. - PubMed
    1. Balasubramanian P, Howell PR, and Anderson RM (2017). Aging and Caloric Restriction Research: A Biological Perspective With Translational Potential. EBioMedicine 21, 37–44. - PMC - PubMed

Publication types