. 2020 Feb:30:101417.
doi: 10.1016/j.redox.2019.101417. Epub 2019 Dec 30.

Peroxiredoxin-1 regulates lipid peroxidation in corneal endothelial cells

Affiliations

Peroxiredoxin-1 regulates lipid peroxidation in corneal endothelial cells

Matthew Lovatt et al. Redox Biol. 2020 Feb.

Abstract

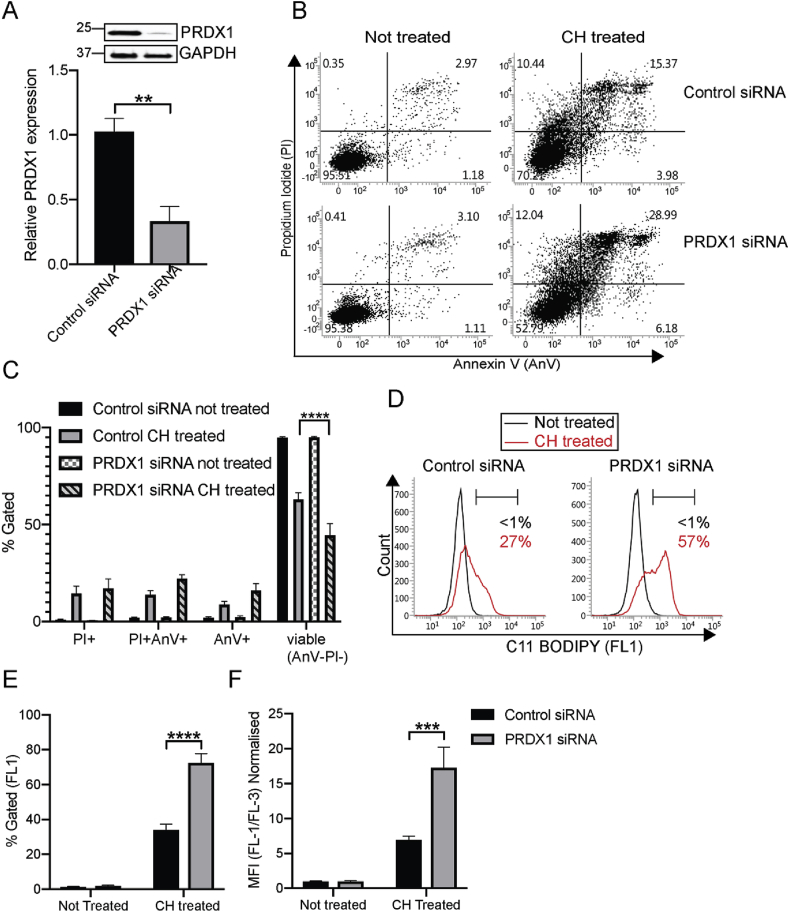
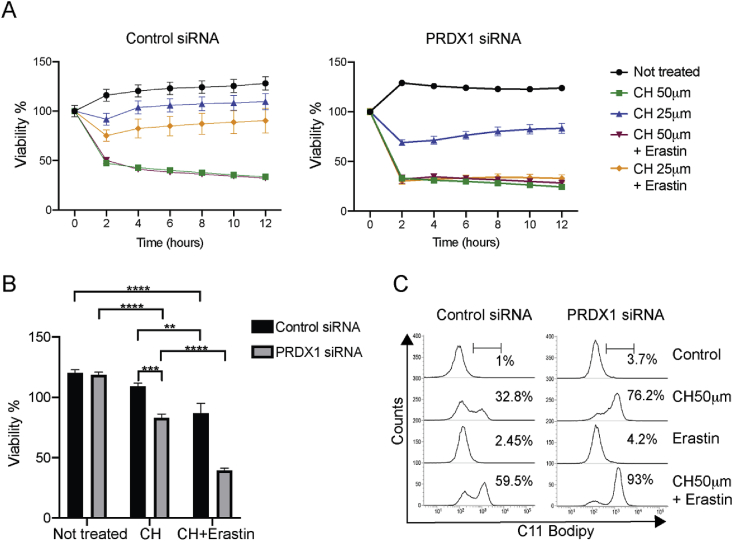
Corneal transparency is maintained by a monolayer of corneal endothelial cells. Defects in corneal endothelial cells (CEnCs) can be rectified surgically through transplantation. Fuchs' endothelial corneal dystrophy (FECD) is the foremost cause of endothelial dysfunction and the leading indication for transplantation. Increased sensitivity of CEnCs to oxidative stress is thought to contribute to the pathogenesis of FECD through increased apoptosis. In part, this is thought to be due to loss of NRF2 expression: a global regulator of oxidative stress. We demonstrate that expression of the redox sensor, peroxiredoxin 1 (PRDX1) is selectively lost from CEnCs in FECD patient samples. We reveal that expression of PRDX1 is necessary to control the response of CEnCs to agents that cause lipid peroxidation. Iron-dependent lipid peroxidation drives non-apoptotic cell death termed ferroptosis. We establish that the inhibitor of ferroptosis, ferrostatin-1 rescues lipid peroxidation and cell death in CEnCs. Furthermore, we provide evidence that the transcription factor NRF2 similarly regulates lipid peroxidation in CEnCs.

Keywords: Corneal endothelial cells; Ferroptosis; Fuchs' endothelial corneal dystrophy; Lipid peroxidation; PRDX1.


Conflict of interest statement

Declaration of competing interest The authors declare no competing interests.

Figures

Image 1
Graphical abstract
Fig. 1
Fig. 1
PRDX expression in Fuchs’ endothelial corneal dystrophy (FECD), and normal CEnCs.Western blot analysis of PRDX expression from FECD patient CEnCs; isolated during endothelial keratoplasty surgery, compared to age matched controls. Three independent experiments are presented for comparison (A,B & C). PRDX protein levels are shown relative to GAPDH, (A&B) or, expression levels of the indicated proteins are shown relative to control CEnC (C). (D) Western blot of PRDX1-6 expression in donor derived cultures of human CEnCs (N=3) or B4G12-CEnCs treated with 100mm CH for 4 hours.
Fig. 2
Fig. 2
Phenotypic analysis of B4G12-CEnCs after depletion of PRDX1 with siRNA. (A) Knockdown efficiency of PRDX1 using siRNA. Bar charts represent mean ± SEM, of PRDX1 protein levels normalised to GAPDH and relative to negative control siRNA (N = 4. **p =  < 0.01, two-tailed t-test). (B) B4G12-CEnC cells were transfected with negative control or PRDX1 siRNA. B4G12-CEnC were left untreated or treated with 100 μm CH for 3 h at 37 °C. Harvested cells were stained with Annexin V and propidium iodide (PI). Representative FACS plots of viable (AnV-/PI-), early (AnV+/PI-) or late apoptotic (AnV+/PI+) and necrotic (AnV-/PI+) is shown. (C) Bar graphs represent percentage of AnV/PI subpopulations. Two-way ANOVA with Bonferroni's post-test was performed to find statistical significance (Data presented as mean ± SEM from technical and biological replicates from three independent experiments. ****p = 0.0001). (D) Lipid ROS was determined after 2-h treatment with 100 μm CH using C11 BODIPY. (E) Percentage of cells gated positive for C11 BODIPY relative to untreated controls. (F) Mean fluorescence intensity (MFI) of C11 BODIPY (green: FL-1 channel) normalised to C11 BODIPY (red: FL-3 channel), relative to not treated controls. Data (N = 5) expressed as mean ± SEM. ****p=<0.0001, ***p = 0.009 (Two-way ANOVA with Bonferroni's post-tests). (For interpretation of the references to colour in this figure legend, the reader is referred to the Web version of this article.)
Fig. 3
Fig. 3
B4G12-CEnC are resistant to erastin mediated cell death. (A) Knockdown efficiency of GPX4 and PRDX1 using siRNA. Bar charts mean ± SEM, of PRDX1 and GPX4 protein levels normalised to GAPDH, relative to negative control siRNA (N = 3). (B) Lipid peroxidation was calculated as mean fluorescence intensity (MFI) of C11 BODIPY (FL-1) normalised to C11 BODIPY (FL-3 channel), relative to controls. Data representative of N = 3, *p=<0.05, two-way ANOVA with Bonferroni's post-tests. (C) HT1080 and B4G12-CEnC cells were transfected with control or GPX4 siRNA for 48 h. Cells were harvested and seeded on xCELLigence plates for 24 h s before exposure to 10 μm erastin. Cellular viability was assessed for an additional 24 h. Data represents mean ± SEM from triplicate samples (D). Viability of HT1080 or B4G12 was calculated from impedance readings of at hourly time points. Percent viability was calculated relative to time 0 (24hr time point prior to addition of compounds). Data represents mean ± SEM from three independent experiments (Two-way ANOVA with Bonferroni's post-tests). **p < 0.005, ****p=<0.0001.
Fig. 4
Fig. 4
Erastin potentiates CH mediated lipid peroxidation. (A) B4G12-CEnCs were transfected with respective siRNA for 48 h. Cells were harvested and seeded on xCELLigence plates for 24 h before exposure to indicated concentrations of CH ± 10 μm erastin. Cellular viability was calculated from impedance readings of B4G12-CEnCs at hourly time points. Percent viability was calculated relative to time 0 (24-h time point prior to addition of compounds) from triplicate samples. (B) Data from three independent experiments at 6-h post treatment with 25 μm CH ± 10 μm erastin was used to generate the bar chart figure. Data represents mean ± SEM (Two-way ANOVA with Bonferroni's post-tests). **p = 0.003, ***p = 0.005, ****p=<0.0001. (C) Representative FACS plot (N = 3) of C11 Bodipy fluorescence from B4G12-CEnCs treated with CH, erastin or CH + erastin.
Fig. 5
Fig. 5
Ferrostatin-1 restores viability of corneal endothelial cells. (A) Ferrostatin-1 (Fer-1, 2 μm) was added to cultures at the same time as CH and lipid peroxidation analysed by the addition of C11-BODIPY. Representative (N = 3) FACS plots are shown. (B) Cell viability of siRNA transfected B4G12-CEnCs or untouched (C) B4G12-CEnCs were treated with CH at 50 μm or 25 μm or H2O2 (100 μm) in the presence or absence of Fer-1 and analysed as in Fig. 3. Data represents cell viability calculated 6-h post treatment from 4 independent experiments (mean ± SEM, two-way ANOVA with Bonferroni's post-tests; ****p < 0.0001). (D) Primary human CEnCs isolated from 6 independent donors were treated with 50 μm CH ± 10 μm erastin or 2 μm Fer-1 for 4 h. Data represents mean ± SEM, Two-way ANOVA with Bonferroni's post-tests; ****p < 0.0001). (E) Primary human CEnCs were treated with indicated reagents for 4 h. RIPA lysates were analysed for protein expression with anti-PRDX1 antibodies by Western blot. Relative PRDX1 expression was calculated by densitometry, relative to GAPDH expression. Data represents three independent experiments using three different, donor derived human CEnCs. Data represents mean ± SEM (ordinary one-way ANOVA with Bonferroni's post-tests, *p < 0.05).
Fig. 6
Fig. 6
Knockdown of NRF2 increases lipid ROS in B4G12-CEnC cells.B4G12-CEnCs were depleted of PRDX1 or NRF2 by siRNA and left untreated or treated with 50mm CH for 6 hours. Quantitative PCR analysis of (A) PRDX1, (B) NRF2 and (C) SLC7A11 was performed to determine their mRNA levels. Data represents relative mRNA levels (fold change) normalised to GAPDH, relative to untreated control. (A) Targeted depletion of NRF2 resulted in a significant decrease in PRDX1 mRNA in untreated samples. Data (N=3) represents mean ± SEM (Two-way ANOVA with Bonferroni's post-tests, **p=0.002), ns= not significant. (B) Knockdown of NRF2 does not impact PRDX1 mRNA levels. (C) Significant reduction of SLC7A11 mRNA following NRF2 knockdown. (D) Western blot analysis of nuclear extracts from B4G12-CEnCs transfected with negative control or siRNA targeting NRF2. (E) Nuclear NRF2 expression was determined relative to lamin A/C. Data represents mean ± SEM, (N=3), **p=0.0067, two-tailed t-test. Lipid ROS was determined as in Fig. 2. (F) Percentage of cells gated positive for C11 BODIPY relative to untreated controls. (G) Mean fluorescence intensity (MFI) of C11 BODIPY (green: FL-1 channel) normalised to C11.

References

    1. Bourne W.M. Biology of the corneal endothelium in health and disease. Eye. 2003;17:912–918. - PubMed
    1. Peh G.S.L., Beuerman R.W., Colman A., Tan D.T., Mehta J.S. Human corneal endothelial cell expansion for corneal endothelium transplantation: an overview. Transplantation. 2011;91:811–819. - PubMed
    1. Vedana G., Villarreal G., Jun A.S. Fuchs endothelial corneal dystrophy: current perspectives. Clin. Ophthalmol. 2016;10:321–330. - PMC - PubMed
    1. Kocaba V., Katikireddy K.R., Gipson I., Price M.O., Price F.W., Jurkunas U.V. Association of the gutta-induced microenvironment with corneal endothelial cell behavior and demise in fuchs endothelial corneal dystrophy. JAMA Ophthalmol. 2018 - PMC - PubMed
    1. Jurkunas U.V., Bitar M.S., Funaki T., Azizi B. Evidence of oxidative stress in the pathogenesis of fuchs endothelial corneal dystrophy. Am. J. Pathol. 2010;177:2278–2289. - PMC - PubMed

MeSH terms