Review
. 2020 Mar;77(5):835-851.
doi: 10.1007/s00018-019-03423-8. Epub 2020 Jan 4.

The role of lipocalin-2 in age-related macular degeneration (AMD)

Affiliations
Review

The role of lipocalin-2 in age-related macular degeneration (AMD)

Sayan Ghosh et al. Cell Mol Life Sci. 2020 Mar.

Abstract

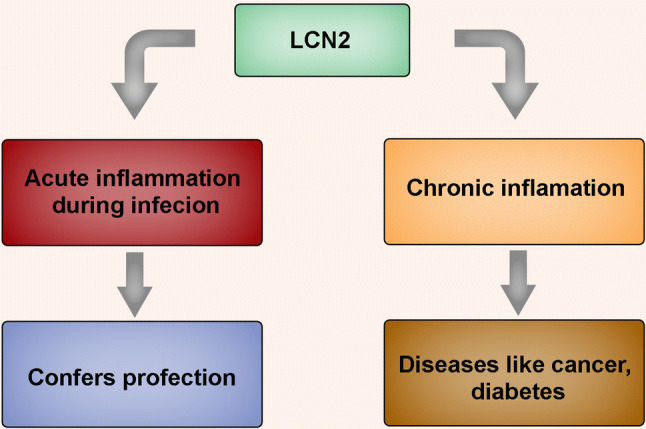
Lipocalins are a family of secreted adipokines which play important roles in various biological processes. Lipocalin-2 (LCN-2) has been shown to be involved in acute and chronic inflammation. This particular protein is critical in the pathogenesis of several diseases including cancer, diabetes, obesity, and multiple sclerosis. Herein, we discuss the general molecular basis for the involvement of LCN-2 in acute infections and chronic disease progression and also ascertain the probable role of LCN-2 in ocular diseases, particularly in age-related macular degeneration (AMD). We elaborate on the signaling cascades which trigger LCN-2 upregulation in AMD and suggest therapeutic strategies for targeting such pathways.

Keywords: AKT2 signaling; Age-related macular degeneration (AMD); Inflammation; Lipocalin-2 (LCN-2); Retinal degeneration.


Figures

Fig. 1
Fig. 1
Phylogenetic trees derived from maximum-likelihood analyses of the individual clades of lipocalins. Local bootstrap probability (LBP) values are indicated in each node. Polytomies reflect nodes with LBP values below 50%. The scale bar represents branch length (number of amino acid substitutions/100 residues). Reproduced with permission from Ganfornina et al. [5]
Fig. 2
Fig. 2
Structure of the lipocalin fold. a Characteristic features of the lipocalin fold. An unwound view of the lipocalin fold orthogonal to the axis of the barrel. The nine β-strands of the antiparallel β-sheet are shown as arrows and labelled A–I. The N-terminal 310-like helix and C-terminal α-helix (labelled A1) are also marked. The hydrogen-bonded connection of two strands is indicated by a pair of dotted lines between them. Connecting loops are shown as solid lines and labelled L1–L7. The two ends of the β-barrel are topologically distinct. One end has four β-hairpins (L1, L3, L5, and L7); the opening of the internal ligand-binding site is here and so is called the open end of the molecule. The other has three β-hairpin loops (L2, L4, and L6); the N-terminal polypeptide chain crosses this end of the barrel to enter strand A via a conserved 310 helix affecting closure of this end of the barrel: the closed end of the molecule. Those parts which form the three main structurally conserved regions (SCRs) of the fold, SCR1, SCR2, and SCR3, are marked as boxes. Three sequence motifs which correspond to these SCRs are shown (MOTIF 1, MOTIF 2, and MOTIF 3). The first three sequences are from kernel lipocalins and the second three from outlier lipocalins. Note that MOTIF 1 is well conserved in all sequences, whereas the other two, particularly MOTIF 2, are only well conserved in kernel lipocalin sequences. b The lipocalin β-barrel in cross-section β-strands is shown as triangles. Triangles pointing downwards indicate a strand direction into the plane of the paper and those pointing upwards indicate a strand direction out of the plane of the paper. The view shown, down the axis of the barrel, is orthogonal to that in a. Connecting loops are shown as continuous lines. Labelling and features shown are as in a. The closure of the sheet to form the lipocalin β-barrel breaks the symmetry of its elliptical cross-section, distinguishing between its two foci and suggesting a sidedness to the barrel also apparent in the location of the marked SCRs. Reproduced with permission from Flower et al. (1996) [2]
Fig. 3
Fig. 3
LCN-2 expression in different organs in humans. The expression profile showing maximum increase in the LCN-2 protein level in bone marrow, cervix, and uterine. Reproduced from The Human Protein Atlas Database, https://www.proteinatlas.org/ENSG00000148346-LCN2/tissue
Fig. 4
Fig. 4
Role of LCN-2 in acute and chronic inflammation. LCN-2 protects cells during bacterial and viral infections and triggers acute inflammation thereby conferring protection. However, heightened expression of the protein is also known to drive chronic inflammation, which is associated with the pathogenesis of several diseases
Fig. 5
Fig. 5
DAB2 interacts with LCN-2. Human proteome array showing binding partners of LCN-2 including DAB2 (red box) probed on HuProtTM arrays at 1 μg/ml. Represented as Z-score (hit for each probe), with a cut-off of 6 and values ranging from 28 to 65. n = 3. Reproduced with permission from Ghosh et al. [96]
Fig. 6
Fig. 6
Increased LCN-2 in human AMD and binding of NF-κB to the LCN-2 promoter. a In human samples, data from immunoblots show a significant increase in LCN-2 expression in early AMD (MGS2) compared to age-matched controls (MGS1), which persisted in the later stages of the disease (n = 5 control donors/and n = 3 donors/disease stage). b Immunofluorescence demonstrates LCN-2 expressing infiltrating cells (neutrophils stained with anti-neutrophil elastase) in the sub-macular choroid and retina of an early AMD patient (arrows). In age-matched control samples, many fewer neutrophils are detected (asterisk) and they are not positive for LCN-2. Bars = 50 μm. GCL ganglion cell layer, INL inner nuclear layer, ONL outer nuclear layer. c ChIP analysis of LCN-2 promoter-binding activity for NF-κB p65 subunit in retinal cells from Cryba1 KO mice (+/− LPS) showing association of NF-κB in the promoter region (− 3171) of the LCN-2 gene, but not in floxed controls. d Reverse ChIP analysis followed by western blotting indicated association between NF-κB and STAT1 in the same region as described in c. e Immunoblot shows significantly higher nuclear expression of NF-κB-p65 and p50 subunits in Cryba1 KO + LPS retinal cells, as compared to floxed control. Reproduced with permission from Ghosh et al. [92]
Fig. 7
Fig. 7
Evidence of LCN2-mediated inflammation in RPE of cKO mice. Western analysis shows significant upregulation of lipocalin-2 protein in older cKO mice compared to age-matched controls. No significant change was found in younger animals. Adapted with permission from Valapala et al. [91]
Fig. 8
Fig. 8
Heatmap of Z-scores of 78 protein hits identified for all triplicates (Rep1/2/3) from 14,693 human proteins on the microarray. The hits were sorted by their mean value of Z-scores. Reproduced with permission from Shang et al. 2017 [95]
Fig. 9
Fig. 9
AKT2-NF-κB-LCN-2 signaling in AMD. In AMD, AKT2-dependent NF-κB and STAT1 nuclear translocation drives lcn2 gene expression in the retinal pigment epithelium (RPE) cells (right panel), which is not observed in the control RPE cells (left panel). These upstream regulators of LCN-2 could be used as potential targets for lowering LCN-2 mRNA expression in AMD
Fig. 10
Fig. 10
IFNλ triggers neutrophil homing into the eye in vivo. Ribbon scanning confocal microscopy (RSCM) was used to image neutrophil infiltration into whole cleared eyes from NOD-SCID mice intravenously injected with; untreated WT and LCN-2−/− neutrophils or IFNλ-exposed (200 U/ml), WT or LCN-2−/− neutrophils, tagged with red CMTPX. a 3D volumetric and d orthogonal projections from whole eyes obtained from mice injected with, WT neutrophils, did not show neutrophil homing b into the retina or c in through the aqueous humor drainage route (Schlemm’s canal, a channel at the limbus and forms the joining point between the cornea and sclera, encircling the cornea). Mice injected with LCN-2−/− neutrophils showed h prevalence of neutrophils in the eye (arrow), but no infiltration was noticed into the e, f retina or e, g Schlemm’s canal. Mice injected with IFNλ-treated WT neutrophils showed noticeable infiltration of neutrophils into the i, l eye (arrows), particularly in the j retina (arrow) and k Schlemm’s canal (arrow), relative to untreated WT neutrophils. NOD-SCID mice injected with IFNλ-exposed LCN-2−/− neutrophils showed relatively lower numbers of neutrophils in the eye (arrow) (m, p), with respect to IFNλ-treated WT neutrophils, especially in the n retina (arrow). There was no visible neutrophil infiltration into o Schlemm’s canal. n = 1. Scale bar, 300 μm. Reproduced with permission from Ghosh et al. [96]
Fig. 11
Fig. 11
LCN-2 is responsible for neutrophil sequestration into the eye. a Orthogonal projections from all three dimensions of a whole eye from a mouse injected with WT neutrophils + IFNλ. Cells within the retina and Schlemm’s canal were extracted as spot counts in Imaris software. Cells are depicted as green spheres b with and c without the orthogonal projection. d Counts extracted from all groups demonstrated an increase in neutrophil number (cell count) in the NOD-SCID mice injected (intravenous) with IFNλ-treated WT neutrophils compared to untreated controls, whereas loss of LCN-2 in neutrophils (LCN-2−/−) showed reduced infiltration even after IFNλ exposure. n = 1. Scale bar, 500 μm. Reproduced with permission from Ghosh et al. [96]
Fig. 12
Fig. 12
LCN-2 laden neutrophils promote AMD-like pathology. Representative spectral-OCT images of retinas from NOD-SCID mice injected sub-retinally with a vehicle (HBSS) or b WT neutrophils revealed normal retinal structure. In contrast, mice injected with; WT neutrophils pre-treated with either c recombinant IFNλ (200 U/ml), d conditioned media from IFNλ overexpressing mouse RPE cells (1:1 diluted), or e recombinant LCN-2 (10 pg/ml), show apparent changes in the ONL and INL layers (asterisks), concomitant with severe loss of RPE and IS + OS layer (yellow arrow heads). These alterations were not observed in mice injected with; f untreated neutrophils from LCN-2−/− mice or g, h IFNλ-exposed LCN-2−/− neutrophils. i Representative spider plot showing the thickness of the IS/OS + RPE layers using the OCT images among the experimental groups. n = 10. *P < 0.05 (one-way ANOVA and Tukey’s post hoc test). Hematoxylin–eosin staining showed no noticeable alterations in; j vehicle treated or mice injected with untreated k WT or lq LCN-2−/− neutrophils (±) IFNλ. However, significant alterations were observed in the INL or ONL (blue asterisks) and RPE/IS + OS (blue arrow heads), in NOD-SCID mice sub-retinally injected with; l, m IFNλ-exposed WT neutrophils or n recombinant LCN-2. r Representative spider plot from all of the experimental groups showing the thickness of the IS/OS + RPE layers using the H&E images. n = 5. *P < 0.05 (one-way ANOVA and Tukey’s post hoc test), Scale Bar, 20 μm. Reproduced with permission from Ghosh et al. [96]
Fig. 13
Fig. 13
Activation of LCN-2 through the AKT2/NF-κB axis. a Immunoblot and summary of densitometry showing increased expression of both NF-κB-p65 subunit and LCN-2 in the retinas from 1 year old Cryba1 cKO mice. After intravitreal injections of Triciribine in Cryba1 cKO mice, the activation of both NF-κB and LCN-2 was significantly reduced. b Immunoblot data showing significant increase in expression of pAKT2 (S474) and NF-κB-p65 subunit in retinas of early AMD subjects compared to age-matched controls, which increased with disease severity (n = 3 donors/stage). Error bars indicate s.d.; *P < 0.05. **P < 0.01 relative to Cryba1fl/fl. Adapted with permission from Ghosh et al. [92]
Fig. 14
Fig. 14
An AKT2 inhibitor (CCT128930) reduces inflammation in aged Cryba1 cKO mouse retina. a Immunoblot and summary of densitometry showing a significant increase in the phosphorylation of AKT2 (p-AKT2S474) in retinas from 1 year old Cryba1 cKO mice. The levels of p-AKT2S474 in the Cryba1 cKO RPE decreased significantly following treatment with inhibitor (CCT128930, at a dose of 500 μM). Vehicle alone (2.5% DMSO in PBS) had little effect. Additionally, levels of total AKT did not change in the samples. n = 3. *P < 0.05 with respect to floxed control and ##P < 0.01 with respect to vehicle-treated Cryba1 cKO. b, c ELISA assays show reduced levels (pg/ml) of CXCL1 and IFNλ respectively, in the RPE choroid of AKT2 inhibitor-treated Cryba1 cKO mice, as compared to age-matched vehicle and untreated Cryba1 cKO animals. n = 3. *P < 0.05 with respect to floxed control and ##P < 0.01 with respect to vehicle-treated Cryba1 cKO. Reproduced with permission from Ghosh et al. [96]
Fig. 15
Fig. 15
Inhibiting AKT2 phosphorylation blocks neutrophil infiltration into the retina and rescues early RPE changes in Cryba1 cKO mice. a Flow cytometry dot plots denoting monocytes, macrophages, and neutrophils from mouse retina (as explained in Fig. 1a) [96]. The neutrophil population (%CD45highCD11b+Ly6ChighLy6G+ cells, red gated) significantly increased in the 12 month Cryba1 cKO mouse retina ± intravitreal vehicle treatment, compared to age-matched Cryba1fl/fl (control). Intravitreal treatment with the AKT2 inhibitor (CCT128930) significantly reduced neutrophils in cKO retina. Graphs denote % CD45highCD11b+Ly6ChighLy6G+ cells. n = 4. **P < 0.01 and #P < 0.05 (one-way ANOVA and post hoc test). bd Representative histological sections (H&E) of retina from 1 year old Cryba1fl/fl mouse, showing normal structure (b). Age-matched Cryba1 cKO mouse (c) intravitreally injected with vehicle (2.5% DMSO in PBS) shows RPE and photoreceptor lesions with pigmentation changes (arrows). Inset in c shows higher magnification of RPE lesions indicating possible debris accumulation between Bruch’s membrane and RPE and separation of photoreceptors from RPE (arrows). In contrast, inhibitor (CCT128930, inhibits AKT2 activation) treated Cryba1 cKO mice (d), exhibited normal structure after 4 weeks. e Bar graph showing decrease in number of sub-retinal drusen-like deposits after AKT2 inhibitor treatment compared to vehicle-treated cKO mice. n = 4. Scale bars, 100 and 50 μm (inset). *P < 0.05 (one-way ANOVA and post hoc test). f Retina sections from 12-month-old Cryba1fl/fl or Cryba1 cKO mice stained with glial fibrillary acidic protein (GFAP, red) and cellular retinaldehyde-binding protein (CRALBP, green). Sections from cKO mice ± intravitreal vehicle showed extensive staining of the Müller glial processes (cells staining for both CRALBP and GFAP, yellow indicating activation, arrows). This was significantly reduced after inhibitor treatment (asterisk). n = 4. Scale bar, 50 μm. Adapted with permission from Ghosh et al. [96]

References

    1. Flower DR. The lipocalin protein family: a role in cell regulation. FEBS Lett. 1994;354:7–11. - PubMed
    1. Flower DR. The lipocalin protein family: structure and function. Biochem J. 1996;318:1–14. - PMC - PubMed
    1. Flower DR, North AC, Attwood TK. Structure and sequence relationships in the lipocalins and related proteins. Protein Sci. 1993;2:753–761. - PMC - PubMed
    1. Flower DR, North AC, Sansom CE. The lipocalin protein family: structural and sequence overview. Biochim Biophys Acta. 2000;1482:9–24. - PubMed
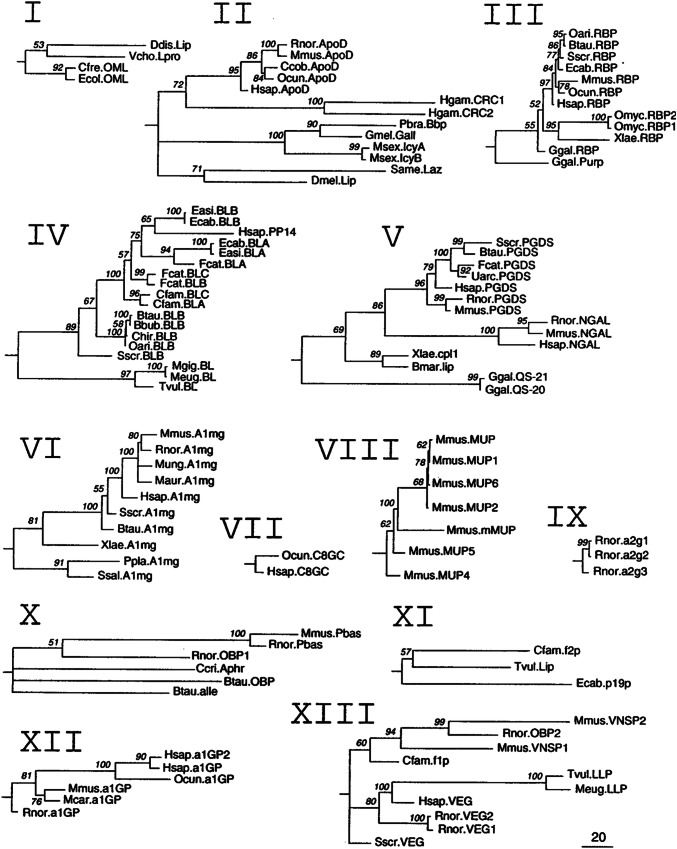
    1. Ganfornina MD, Gutierrez G, Bastiani M, Sanchez D. A phylogenetic analysis of the lipocalin protein family. Mol Biol Evol. 2000;17:114–126. - PubMed