

Micronutrient deficiencies in African soils and the human nutritional nexus: opportunities with staple crops
- PMID: 31902042
- PMCID: PMC7429550
- DOI: 10.1007/s10653-019-00499-w
Micronutrient deficiencies in African soils and the human nutritional nexus: opportunities with staple crops
Abstract
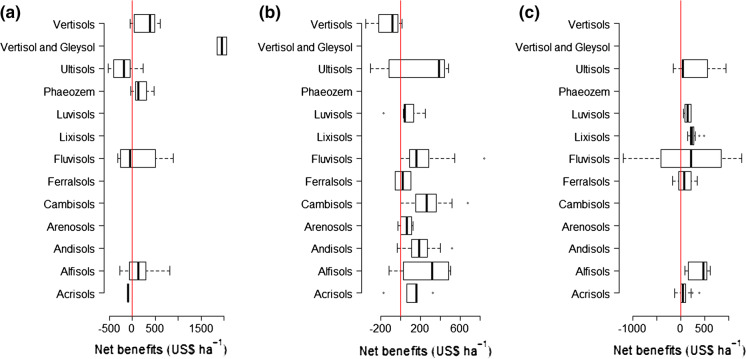
A synthesis of available agronomic datasets and peer-reviewed scientific literature was conducted to: (1) assess the status of micronutrients in sub-Saharan Africa (SSA) arable soils, (2) improve the understanding of the relations between soil quality/management and crop nutritional quality and (3) evaluate the potential profitability of application of secondary and micronutrients to key food crops in SSA, namely maize (Zea mays L.), beans (Phaseolus spp. and Vicia faba L.), wheat (Triticum aestivum L.) and rice (Oryza sativa L.). We found that there is evidence of widespread but varying micronutrient deficiencies in SSA arable soils and that simultaneous deficiencies of multiple elements (co-occurrence) are prevalent. Zinc (Zn) predominates the list of micronutrients that are deficient in SSA arable soils. Boron (B), iron (Fe), molybdenum (Mo) and copper (Cu) deficiencies are also common. Micronutrient fertilization/agronomic biofortification increases micronutrient concentrations in edible plant organs, and it was profitable to apply fertilizers containing micronutrient elements in 60-80% of the cases. However, both the plant nutritional quality and profit had large variations. Possible causes of this variation may be differences in crop species and cultivars, fertilizer type and application methods, climate and initial soil conditions, and soil chemistry effects on nutrient availability for crop uptake. Therefore, micronutrient use efficiency can be improved by adapting the rates and types of fertilizers to site-specific soil and management conditions. To make region-wide nutritional changes using agronomic biofortification, major policy interventions are needed.
Keywords: Biofortification; Fertilization; Human nutrition; Micronutrients; Profitability; Soil fertility management; Sub-Saharan Africa.
Conflict of interest statement
The authors declare that they have no conflict of interest.
Figures
Similar articles
-
Biofortification-A Frontier Novel Approach to Enrich Micronutrients in Field Crops to Encounter the Nutritional Security.Molecules. 2022 Feb 16;27(4):1340. doi: 10.3390/molecules27041340. Molecules. 2022. PMID: 35209127 Free PMC article. Review.
-
Soil factors associated with zinc deficiency in crops and humans.Environ Geochem Health. 2009 Oct;31(5):537-48. doi: 10.1007/s10653-009-9255-4. Environ Geochem Health. 2009. PMID: 19291414 Review.
-
Improving human micronutrient nutrition through biofortification in the soil-plant system: China as a case study.Environ Geochem Health. 2007 Oct;29(5):413-28. doi: 10.1007/s10653-007-9086-0. Epub 2007 Mar 24. Environ Geochem Health. 2007. PMID: 17385049
-
Agronomic biofortification of maize and beans in Kenya through selenium fertilization.Environ Geochem Health. 2019 Dec;41(6):2577-2591. doi: 10.1007/s10653-019-00309-3. Epub 2019 May 8. Environ Geochem Health. 2019. PMID: 31069598
-
Enrichment of fertilizers with zinc: An excellent investment for humanity and crop production in India.J Trace Elem Med Biol. 2009;23(4):281-9. doi: 10.1016/j.jtemb.2009.05.002. Epub 2009 Jun 12. J Trace Elem Med Biol. 2009. PMID: 19747624 Review.
Cited by
-
Increasing zinc concentration in maize grown under contrasting soil types in Malawi through agronomic biofortification: Trial protocol for a field experiment to detect small effect sizes.Plant Direct. 2020 Oct 22;4(10):e00277. doi: 10.1002/pld3.277. eCollection 2020 Oct. Plant Direct. 2020. PMID: 33103047 Free PMC article.
-
Regional estimates of nitrogen budgets for agricultural systems in the East African Community over the last five decades.Agron Sustain Dev. 2023;43(2):27. doi: 10.1007/s13593-023-00881-0. Epub 2023 Mar 8. Agron Sustain Dev. 2023. PMID: 36909277 Free PMC article.
-
Conservation Agriculture Affects Grain and Nutrient Yields of Maize (Zea Mays L.) and Can Impact Food and Nutrition Security in Sub-Saharan Africa.Front Nutr. 2022 Jan 26;8:804663. doi: 10.3389/fnut.2021.804663. eCollection 2021. Front Nutr. 2022. PMID: 35155522 Free PMC article.
-
Selenium Status of Southern Africa.Nutrients. 2024 Mar 27;16(7):975. doi: 10.3390/nu16070975. Nutrients. 2024. PMID: 38613007 Free PMC article. Review.
-
Biofortification of mungbean (Vigna radiata L. (Wilczek)) with boron, zinc and iron alters its grain yield and nutrition.Sci Rep. 2023 Mar 2;13(1):3506. doi: 10.1038/s41598-023-30539-6. Sci Rep. 2023. PMID: 36864063 Free PMC article.
References
-
- Abe SS, Buri MM, Issaka RN, Kiepe P, Wakatsuki T. Soil fertility potential for rice production in West African lowlands. Japan Agricultural Research. 2010;44:343–355.
-
- Adeoye GO, Agboola AA. Critical levels for soil pH, available P, K, Zn and Mn and maize ear-leaf content of P, Cu and Mn in sedimentary soils of South-Western Nigeria. Fertilizer Research. 1985;6:65–71.
-
- Alam F, Kim TY, Kim SY, Alam SS, Pramanik P, Kim PJ, Lee YB. Effect of molybdenum on nodulation, plant yield and nitrogen uptake in hairy vetch (Vicia villosa Roth) Soil Science and Plant Nutrition. 2015;61(4):664–675.
-
- Alfthan G, Eurola M, Ekholm P, Venäläinen ER, Root T, Korkalainen K, Aro A. Effects of nationwide addition of selenium to fertilizers on foods, and animal and human health in Finland: From deficiency to optimal selenium status of the population. Journal of Trace Elements in Medicine and Biology. 2015;31:142–147. - PubMed
-
- Berkhout E, Malan M, Kram T. Micronutrients for agricultural intensification. Is sub-Saharan Africa at risk? The Hague: PBL Netherlands Environmental Assessment Agency; 2017.
Publication types
MeSH terms
Substances
LinkOut - more resources
Full Text Sources
Research Materials
Miscellaneous
