. 2020 Jan:51:102547.
doi: 10.1016/j.ebiom.2019.11.008. Epub 2020 Jan 3.

Dysregulation of the splicing machinery is directly associated to aggressiveness of prostate cancer

Affiliations

Dysregulation of the splicing machinery is directly associated to aggressiveness of prostate cancer

Juan M Jiménez-Vacas et al. EBioMedicine. 2020 Jan.

Abstract

Background: Dysregulation of splicing variants (SVs) expression has recently emerged as a novel cancer hallmark. Although the generation of aberrant SVs (e.g. AR-v7/sst5TMD4/etc.) is associated to prostate-cancer (PCa) aggressiveness and/or castration-resistant PCa (CRPC) development, whether the molecular reason behind such phenomena might be linked to a dysregulation of the cellular machinery responsible for the splicing process [spliceosome-components (SCs) and splicing-factors (SFs)] has not been yet explored.

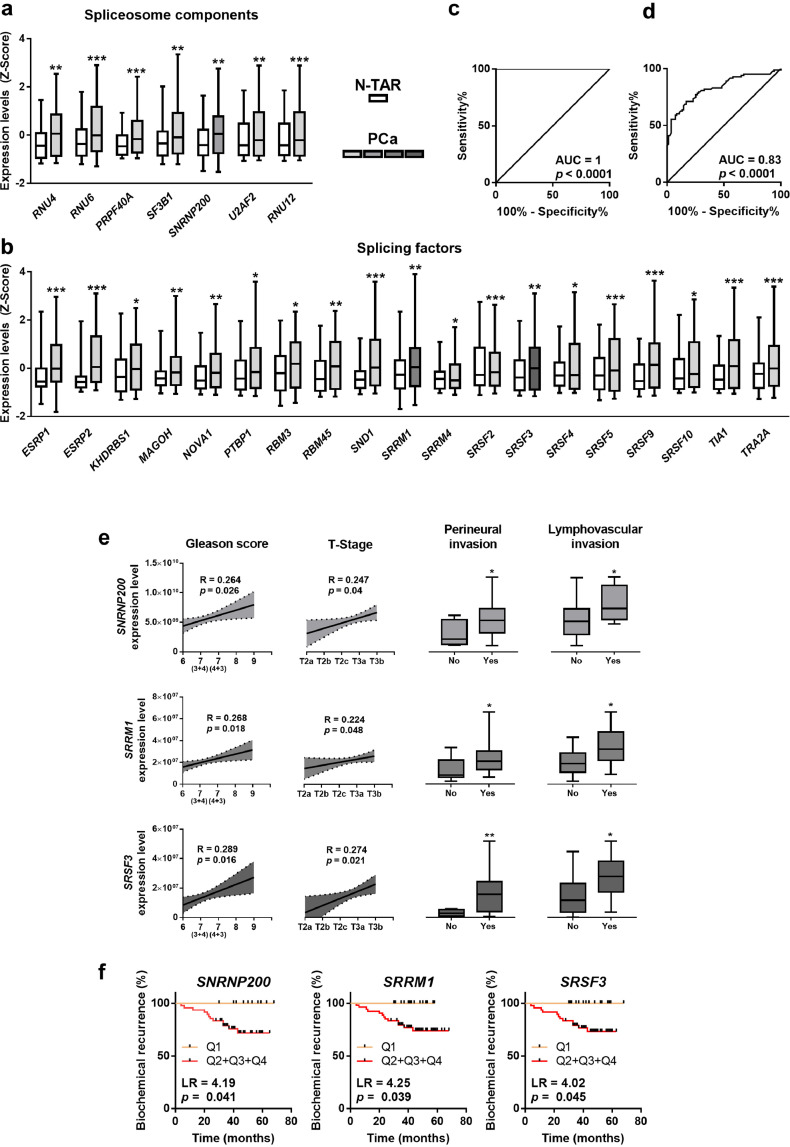
Methods: Expression levels of 43 key SCs and SFs were measured in two cohorts of PCa-samples: 1) Clinically-localized formalin-fixed paraffin-embedded PCa-samples (n = 84), and 2) highly-aggressive freshly-obtained PCa-samples (n = 42).

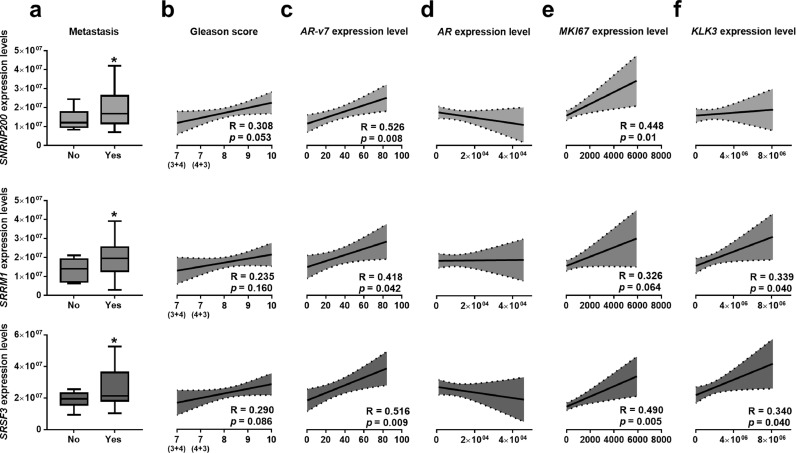
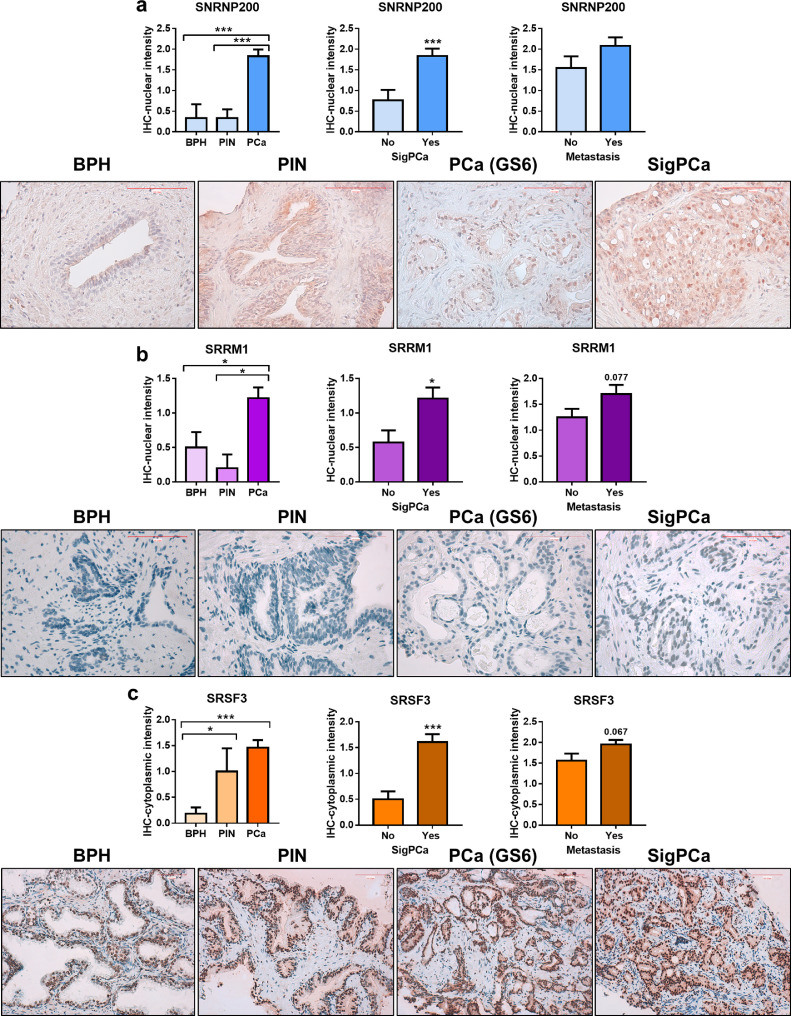
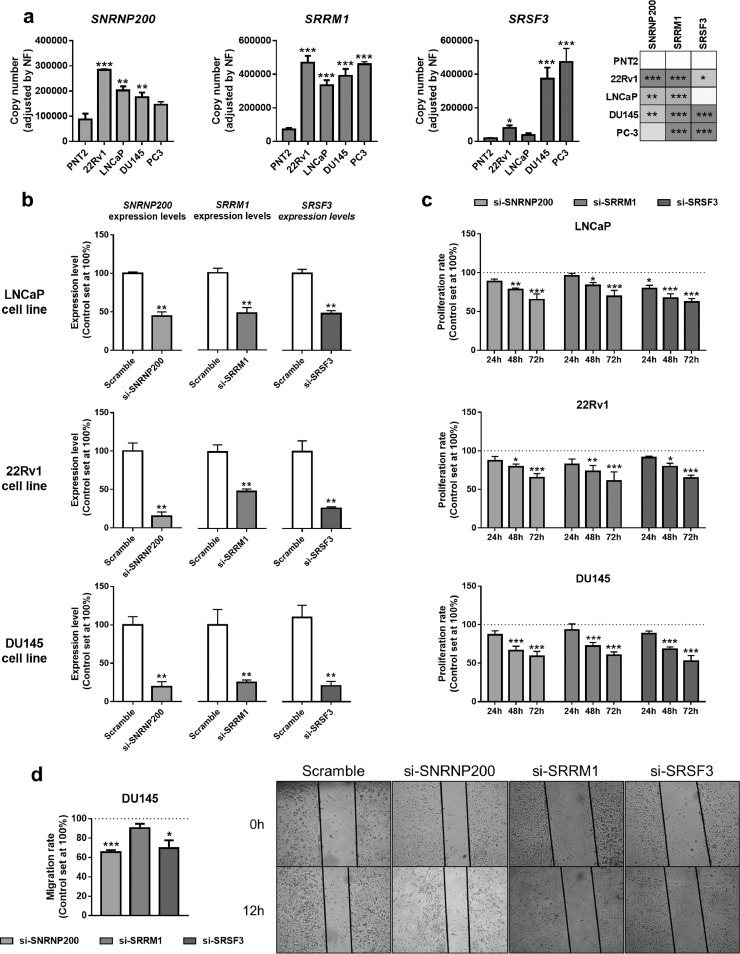
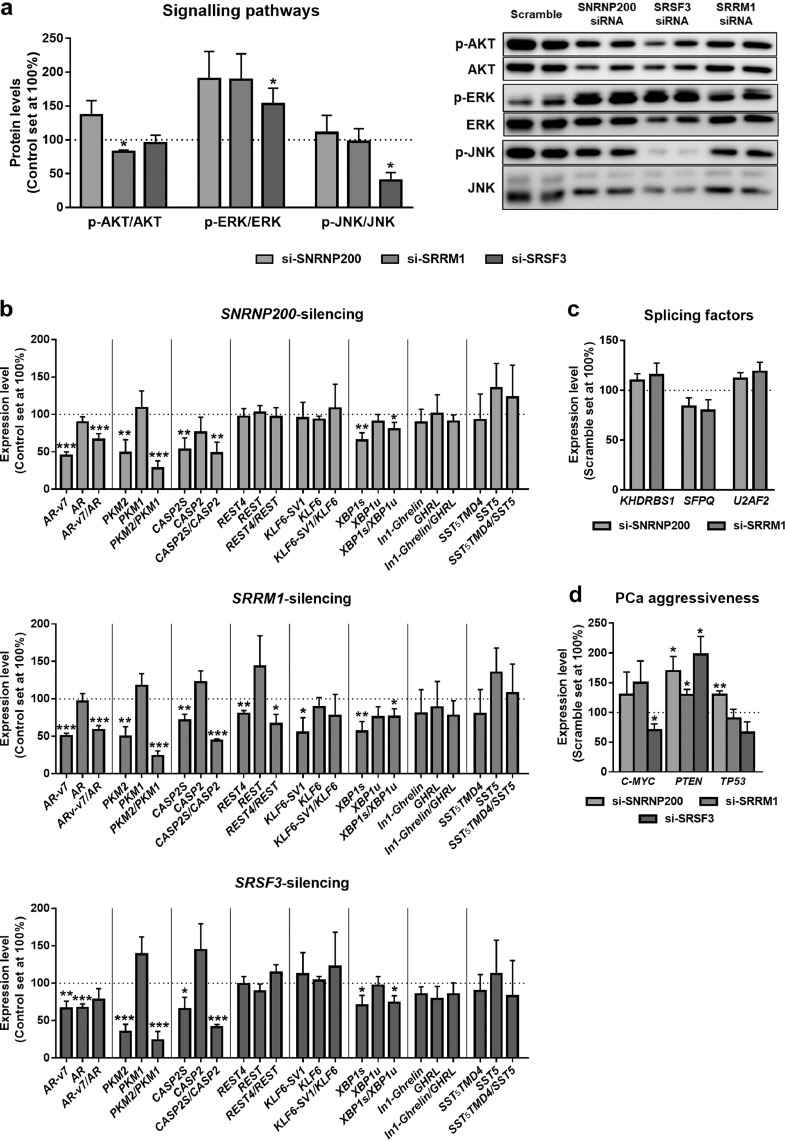
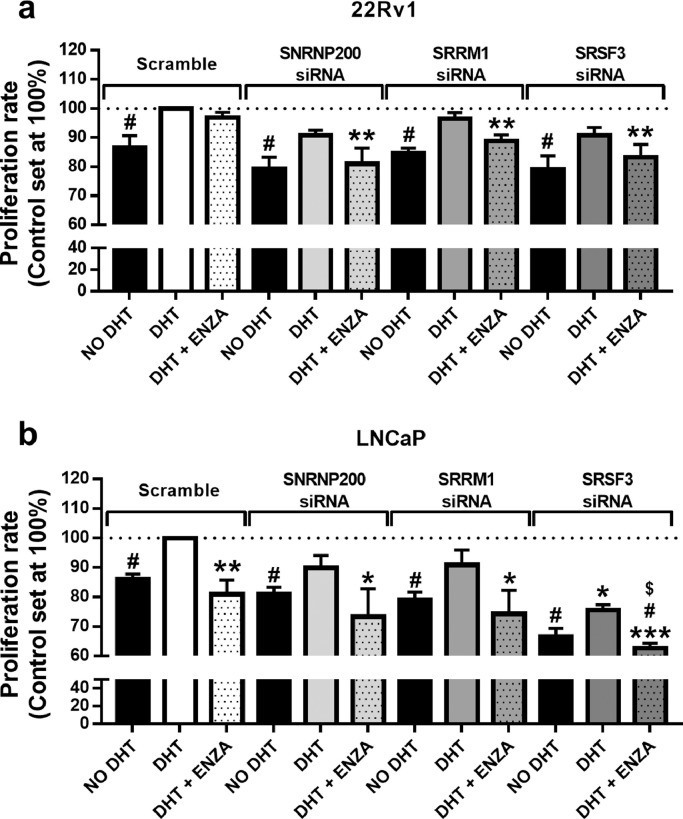
Findings: A profound dysregulation in the expression of multiple components of the splicing machinery (i.e. 7 SCs/19 SFs) were found in PCa compared to their non-tumor adjacent-regions. Notably, overexpression of SNRNP200, SRSF3 and SRRM1 (mRNA and/or protein) were associated with relevant clinical (e.g. Gleason score, T-Stage, metastasis, biochemical recurrence, etc.) and molecular (e.g. AR-v7 expression) parameters of aggressiveness in PCa-samples. Functional (cell-proliferation/migration) and mechanistic [gene-expression (qPCR) and protein-levels (western-blot)] assays were performed in normal prostate cells (PNT2) and PCa-cells (LNCaP/22Rv1/PC-3/DU145 cell-lines) in response to SNRNP200, SRSF3 and/or SRRM1 silencing (using specific siRNAs) revealed an overall decrease in proliferation/migration-rate in PCa-cells through the modulation of key oncogenic SVs expression levels (e.g. AR-v7/PKM2/XBP1s) and alteration of oncogenic signaling pathways (e.g. p-AKT/p-JNK).

Interpretation: These results demonstrate that the spliceosome is drastically altered in PCa wherein SNRNP200, SRSF3 and SRRM1 could represent attractive novel diagnostic/prognostic and therapeutic targets for PCa and CRPC.

Keywords: Prostate cancer; SNRNP200; SRRM1; SRSF3; Spliceosome; Splicing; Therapeutic target.


Conflict of interest statement

Declaration of Competing Interest The authors declare that they have no conflict of interest.

Figures

Fig. 1
Fig. 1
Expression of spliceosome components and splicing factors in prostate cancer (PCa) samples. (a–b) Comparison of mRNA levels of spliceosome components (a) and splicing factors (b) between formalin-fixed paraffin embedded (FFPE) samples from PCa samples and non-tumor adjacent regions (N-TAR) (n = 84) determined by a microfluidic-based qPCR array. Data represent the mean ± SEM of mRNA expression levels adjusted by normalization factor (calculated from ACTB and GAPDH expression levels) and standardized by Z-score. c-d) ROC curves of a subset of spliceosome components and splicing factors generated by Random Forest computational algorithm (c) followed by cross validation analysis (d) to distinguish between tumor and N-TAR samples. e) Association between the expression levels of selected spliceosome components and splicing factors (SNRNP200, SRRM1 and SRSF3) and clinical parameters (Gleason score, T-Stage, perineural and lymphovascular invasion) in the same cohort of FFPE samples (n = 84). Correlations are represented by mean (connecting line) and error bands (pointed line) of expression levels. Data of associations represent the mean ± SEM of mRNA expression levels adjusted by normalization factor (calculated from ACTB and GAPDH expression levels). f) Association between SNRNP200, SRRM1 and SRSF3 expression levels and biochemical PCa recurrence in 67 samples from FFPE cohort (samples from patients who underwent adjuvant radiotherapy were not included), calculated by Log Rank analysis (LR). mRNA levels were determined by a microfluidic-based qPCR array and adjusted by normalization factor calculated from ACTB and GAPDH expression levels. Asterisks (* p < 0.05; ** p < 0.01; *** p < 0.001) indicate statistically significant differences between groups.
Fig. 2
Fig. 2
Expression of SNRNP200, SRRM1 and SRSF3 in a highly aggressive cohort of prostate cancer (PCa) samples. (a) SNRNP200, SRRM1 and SRSF3 expression levels in a battery of highly-aggressive PCa samples, with or without the presence of metastasis (n = 42). represent the mean ± SEM of mRNA expression levels. b-f) Correlation between SNRNP200, SRRM1 and SRSF3 expression levels and Gleason score (b), expression levels of AR-v7 (c), AR (d) MKI67 (e) and KLK3 (f). mRNA levels were determined by a microfluidic-based qPCR array and adjusted by normalization factor calculated from ACTB and GAPDH expression levels. Asterisk (* p < 0.05) indicates statistically significant differences between groups.
Fig. 3
Fig. 3
Immunohistochemical analysis of SNRNP200,SRRM1 and SRSF3 in prostate cancer (PCa) samples. a) Comparison of SNRNP200,SRRM1 (b) and SRSF3 (c) protein levels by immunohistochemistry (IHC) between a representative set of PCa samples (n = 47), prostatic intraepithelial neoplasia (PIN; n = 6) and benign prostatic hyperplasia (BPH; n = 7). Association of protein levels with clinically significant PCa (SigPCa; defined as Gleason score higher than 7) and the presence of metastasis at diagnosis (central panel and right panel, respectively). Representative images of BPH, PIN, PCa with Gleason score = 6 and SigPCa stained with SNRNP200 (400× magnification), SRRM1 (400× magnification) and SRSF3 (200× magnification) antibodies are showed below a, b and c panels, respectively. Scale bar indicates 100 µm. Data are expressed as mean ± SEM of IHC staining scaled from low [1] to high [3] intensity. Asterisks (* p < 0.05; ** p < 0.01; *** p < 0.001) indicate statistically significant differences between groups.
Fig. 4
Fig. 4
Functional consequences of SNRNP200, SRRM1 and SRSF3 silencing in prostate-derived cell lines. a) Comparison of SNRNP200, SRRM1 and SRSF3 expression levels between a non-tumor prostate cell line (PNT2) and PCa cell lines LNCaP, 22Rv1, DU145 and PC-3 (n = 5). mRNA levels were determined by qPCR and adjusted by normalization factor calculated from ACTB and GAPDH expression levels. b) Validation by qPCR of SNRNP200, SRRM1 and SRSF3 silencing (si-SNRNP200, si-SRRM1 and si-SRSF3, respectively). mRNA levels were determined by qPCR and adjusted by normalization factor calculated from ACTB and GAPDH expression levels. Data were represented as percent of scramble cells (mean ± SEM). c) Proliferation rate of LNCaP (upper panel), 22Rv1 (middlepanel) and DU145 (bottom panel) cell lines after 24-, 48- and 72 h of SNRNP200-, SRRM1- and SRSF3-silencing (n = 4). d) Effect of SNRNP200-, SRRM1- and SRSF3-silencing on the migration rate of DU145 cell line was determined by wound-healing assay (12 h; n ≥ 3). Representative images are depicted in right panel. Data were represented as percent of scramble cells (mean ± SEM). Asterisks (* p < 0.05; ** p < 0.01; *** p < 0.001) indicate statistically significant differences between groups.
Fig. 5
Fig. 5
Molecular consequences of SNRNP200, SRRM1 and SRSF3 silencing in 22Rv1 cell line. a) Basal phospho-AKT, phospho-ERK1/2 and phospho-JNK levels in SNRNP200-, SRRM1- and SRSF3 silenced 22Rv1 cells (si-SNRNP200, si-SRRM1 and si-SRSF3, respectively; 24 h; n ≥ 3). Protein levels were normalized by total AKT, ERK and JNK protein levels. Representative images are shown in right panel. Protein data were represented as percent of scramble cells. b) Expression levels of selected transcripts in response to SNRNP200 (upper panel), SRRM1 (central panel) and SRSF3 (bottom panel) silencing (24 h) in 22Rv1 cells. Ratio between the expression of splicing variants is shown in bars with dotted pattern. c) Expression levels of KHDRBS1, SFPQ and U2AF2 in response to SNRNP200- and SRRM1-silencing in 22Rv1 cells. d) Expression levels of C-MYC, PTEN and TP53 in response to SNRNP200-, SRRM1- and SRSF3-silencing in 22Rv1 cells. mRNA levels were determined by qPCR and adjusted by normalization factor calculated from ACTB and GAPDH expression levels. Data were represented as percent of scramble-treated control cells (mean ± SEM). Asterisks (* p < 0.05; ** p < 0.01; *** p < 0.001) indicate statistically significant differences between groups.
Fig. 6
Fig. 6
Cell proliferation assay in response to enzalutamide treatment combined with SNRNP200, SRRM1 and SRSF3 silencing. Proliferation rate of 22Rv1 (a) and LNCaP (b) cell line was measured after 24 h of SNRNP200-, SRRM1- and SRSF3-silencing in the presence (DHT) or absence (no DHT) of 5α-dihydrotestosterone with or without enzalutamide (ENZA; n = 4). Results were expressed as percentage referred to scramble vehicle-treated control with DHT (mean ± SEM). Asterisks (* p < 0.05; ** p < 0.01), dash (#p < 0.05) and dollar sign ($p < 0.05) indicate statistically significant differences compared to DHT of scramble, DHT of each condition and DHT+ENZA of scramble, respectively.

References

    1. Matera A.G., Wang Z. A day in the life of the spliceosome. Nat Rev Mol Cell Biol. 2014;15(2):108–121. - PMC - PubMed
    1. Scotti M.M., Swanson M.S. RNA mis-splicing in disease. Nat Rev Genet. 2016;17(1):19–32. - PMC - PubMed
    1. Bray F., Ferlay J., Soerjomataram I., Siegel R.L., Torre L.A., Jemal A. Global cancer statistics 2018: GLOBOCAN estimates of incidence and mortality worldwide for 36 cancers in 185 countries. CA Cancer J Clin. 2018;68(6):394–424. - PubMed
    1. Hormaechea-Agulla D., Jimenez-Vacas J.M., Gomez-Gomez E., F L.L., Carrasco-Valiente J., Valero-Rosa J. The oncogenic role of the spliced somatostatin receptor sst5TMD4 variant in prostate cancer. Faseb J. 2017;31(11):4682–4696. - PubMed
    1. Wong N., Yan J., Ojo D., De Melo J., Cutz J.C., Tang D. Changes in PKM2 associate with prostate cancer progression. Cancer Invest. 2014;32(7):330–338. - PubMed

MeSH terms