. 2020 Feb 3;30(3):442-454.e7.
doi: 10.1016/j.cub.2019.11.076. Epub 2020 Jan 2.

Mechanotransduction-Dependent Control of Stereocilia Dimensions and Row Identity in Inner Hair Cells

Affiliations

Mechanotransduction-Dependent Control of Stereocilia Dimensions and Row Identity in Inner Hair Cells

Jocelyn F Krey et al. Curr Biol. .

Abstract

Actin-rich structures, like stereocilia and microvilli, are assembled with precise control of length, diameter, and relative spacing. By quantifying actin-core dimensions of stereocilia from phalloidin-labeled mouse cochleas, we demonstrated that inner hair cell stereocilia developed in specific stages, where a widening phase is sandwiched between two lengthening phases. Moreover, widening of the second-tallest stereocilia rank (row 2) occurred simultaneously with the appearance of mechanotransduction. Correspondingly, Tmc1KO/KO;Tmc2KO/KO or TmieKO/KO hair cells, which lack transduction, have significantly altered stereocilia lengths and diameters, including a narrowed row 2. EPS8 and the short splice isoform of MYO15A, identity markers for mature row 1 (the tallest row), lost their row exclusivity in transduction mutants. GNAI3, another member of the mature row 1 complex, accumulated at mutant row 1 tips at considerably lower levels than in wild-type bundles. Alterations in stereocilia dimensions and in EPS8 distribution seen in transduction mutants were mimicked by block of transduction channels of cochlear explants in culture. In addition, proteins normally concentrated at mature row 2 tips were also distributed differently in transduction mutants; the heterodimeric capping protein subunit CAPZB and its partner TWF2 never concentrated at row 2 tips like they do in wild-type bundles. The altered distribution of marker proteins in transduction mutants was accompanied by increased variability in stereocilia length. Transduction channels thus specify and maintain row identity, control addition of new actin filaments to increase stereocilia diameter, and coordinate stereocilia height within rows.

Keywords: Airyscan; actin; development; hair bundle; hair cells; mechanotransduction; myosin; stereocilia.


Conflict of interest statement

Declaration of Interests The authors declare no competing interests.

Figures

Figure 1.
Figure 1.. Length and width of stereocilia during development.
(A) Examples of C57BL/6J stereocilia during development. Each panel is a x-z reslice taken from a phalloidin-stained IHC at the indicated age. Panel widths are 4 μm. (B) Scanning electron microscopy images of hair bundles from apical cochlea at P0.5, P3.5, and P7.5. Asterisk indicates the bare zone at P0.5. Panel widths are 5.2 μm. (C) Apparent actin core length for row 1 (blue) and row 2 (gray) during apical IHC development. Logistic-equation fit with midpoints of 12.5 (row 1) and 6.4 (row 2) days. Data points indicate mean ± SD. (D) Apparent actin core width for rows 1 and 2 of apical IHCs during development. Logistic fits with midpoints of 4.4 (row 1) and 1.2 (row 2) days. Logistic fit to previously published data [20] for apical IHC transduction (midpoint of 2.9 days) was superimposed on both C and D. See also Figure S1.
Figure 2.
Figure 2.. Tmc DKO and Tmie KO apical hair-bundle phenotypes.
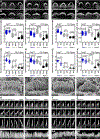
(A-D, O-R) Phalloidin-stained images of bundles at P7.5 from Tmc1KO/KO;Tmc2KO/+ (A-B), Tmc1KO/KO;Tmc2KO/KO (C-D), TmieKO/+ (O-P), and TmieKO/KO (Q-R) OHCs and IHCs. Panel widths are 25 μm. (E-H, S-V) Stereocilia actin core length (E, G, S, U) and width (F, H, T, V) of Tmc (E-H) and Tmie (S-V) genotypes in IHC bundles measured at P7.5 and P21.5. Pairwise comparisons used t-tests. (I-J, W-X) Scanning electron micrographs of Tmc (I-J) and Tmie (W-X) genotypes in P8.5 IHCs. Panel widths are 5.2 μm. (K-L, Y-Z) Reslice images (x-z) from IHC bundles at the indicated ages from Tmc (K-L) and Tmie (Y-Z) genotypes. Each set shows different stereocilia ranks from a single bundle at that age. Panel widths are 4 μm. (M-N, AA-BB) IHC bundle en-face maximum projections of Tmc (M-N) and Tmie (AA-BB) genotypes at P21.5. Panels widths are 25 μm. See also Figures S2 and S3.
Figure 3.
Figure 3.. Proteins specific for mature row 1 of apical IHCs during development.
(A) Proteins specific for mature row 1 stereocilia tips in x-z reslices of C57BL/6J hair bundles during postnatal development. Brightness for antibody signal (green) and phalloidin for actin (magenta) was adjusted to represent the range in each image; intensities should not be compared between panels, even for the same protein (see Figure S3C for examples with fixed antibody brightness). Panel widths are 4 μm. In some cases, images were expanded with black background to fill the panel (in subsequent figures as well). Asterisks indicate bare-zone labeling for GNAI3; arrowheads indicate WHRN at ankle links. (B) Quantitation of mature row 1 proteins in bundles during development. Top panels, average signal for row 1 and 2 tips combined. Immunoreactivity for all row 1 and 2 tips for each bundle were plotted as percentage of the peak time point. Bottom panels, ratio of immunoreactivity in individual row 1 or row 2 tips to the average immunoreactivity for both rows. Solid bars signify average; ****, p<0.0001; ns, not significant. (C) EPS8 labeling at row 2 tips (arrows) at P2.5. (D) Whirlin ankle-link labeling (arrowheads) at P7.5. Upper left, horizontal slice at the level of the ankle links; panel is 9 μm wide. Lower left, en face view; panel width is 9 μm. Right, x-z reslice; panel width is 2.5 μm. (E) Distribution of MYO15A-S (arrowheads) and EPS8 at stereocilia tips. MYO15A-S puncta are smaller than the EPS8 cap. See also Figure S3.
Figure 4.
Figure 4.. Proteins specific for mature row 1 in apical IHCs of transduction mutants.
(A-H) Row 1 tip proteins at P7.5 in Tmc DKO and Tmie KO mice. Left images, antibody and antibody-actin merge for controls; right images, same for DKO or KO mice. Arrows indicate labeling at rows 1–3 stereocilia tips of mutant hair bundles. Panel widths are 9 μm. (I-P) Row 1 complex proteins at P22.5 in Tmc DKO and P21.5 in Tmie KO mice. En face views (panel widths of 15 μm) are on left, and x-z reslices (panel widths of 4 μm) are on right (identical scale). Arrowheads in I and M indicate decreased GNAI3; arrows in panels I-P indicate staining at tips of row 1 (control IHCs) or tips of rows 1–3 (transduction mutants). Each pair of control and DKO or KO panels was from littermates. During image acquisition, the gain setting for the antibody signal was adjusted to reveal the staining pattern in the control sample; the corresponding DKO or KO sample used the same gain setting. For display, brightness settings for the panels were kept constant between control and mutant. See also Figure S4.
Figure 5.
Figure 5.. Quantitation of mature row 1 proteins in apical IHCs of transduction mutants.
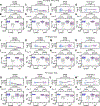
Top panels for each condition plot average fluorescence for row 1 and 2 tips from each hair bundle, normalized to average control fluorescence for the experiment. Pairwise control vs. mutant comparisons used t-tests (p values indicated). Bottom panels for each condition plot row 1/average and row 2/average, with the ratio of row 1 tip/average to row 2 tip/average indicated above (mean ± SEM). (A-H) P7.5 Tmc control and DKO distribution. (I-P) P7.5 Tmie control and KO distribution. (Q-T) P21.5 Tmie control and KO distribution.
Figure 6.
Figure 6.. Blockade of transduction channel alters stereocilia dimensions and protein distribution.
(A-B) Assessment of transduction using FM1–43 loading in cochleas treated with control and 100 μM tubocurarine (TUBO) solutions. Images in (A) have panel widths are 80 μm. Quantitation of OHC and IHC signal in (B) indicates that the dye signal was significantly reduced (p<0.0001 by t-test). (C-J) Phalloidin staining for actin in IHCs. Cochlea dissected at P4.5 and stained acutely (C), cochlea dissected at P6.5 and stained acutely (D), cochleas dissected at P4.5 and cultured for two days in vitro (DIV) with control (E, G) or 100 μM tubocurarine solutions (F, H), and cochleas dissected at P5.5 and cultured for two days in vitro (DIV) with control (I) or 100 μM tubocurarine solutions (J). Panel widths: C-F, G-H, 17.5 and 4.5 pm; I-J, 9 μm. (K-T) Immunocytochemistry of cochleas dissected at P4.5 and cultured for two days in vitro (DIV) with control (K, M, O, Q, S) or 100 μM tubocurarine solutions (L, N, P, R, T). Panel widths: K-T, 17.5 and 4.5 μm. (U-DD) Quantitation as described in Figure 5.
Figure 7.
Figure 7.. Proteins localizing to mature row 2 during apical IHC development and in mutants.
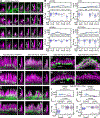
(A) Row 2 proteins during postnatal development of C57BL/6J stereocilia; panel widths are 4 μm. (B) Quantitation of row 2 proteins during development as described in Figure 3B. TWF2 was not measured at P7.5 (ND) as ankle-link and tip staining often overlapped in x-y sections. (C-F) Row 2 proteins at P21.5 in Tmie control (left) and Tmie KO (right) samples. Control and KO panels were matched as described earlier. Left panels are en face views and right panels are x-z reslices (same scale). Arrowheads—staining at row 2 and 3 tips. TWF2 panel asterisk—signal is reduced compared to control. Panel widths are 10 μm and 4 μm. (G-H) Horizontal slices at the level of row 2 tips for CAPZB (G) and TWF2 (H) in P21.5 Tmie KO. Panel widths are 7 μm. (I-L) Quantitation as described in Figure 5. See also Figures S5, S6, and S7.

Comment in

References

    1. Fettiplace R, and Kim KX (2014). The physiology of mechanoelectrical transduction channels in hearing. Physiol Rev. 94, 951–986. - PMC - PubMed
    1. Barr-Gillespie PG (2015). Assembly of hair bundles, an amazing problem for cell biology. Mol Biol Cell. 26, 2727–2732. - PMC - PubMed
    1. Tilney LG, Tilney MS, and DeRosier DJ (1992). Actin filaments, stereocilia, and hair cells: how cells count and measure. Ann. Rev. Cell Biol 8, 257–274. - PubMed
    1. Kaltenbach JA, Falzarano PR, and Simpson TH (1994). Postnatal development of the hamster cochlea. II. Growth and differentiation of stereocilia bundles. J Comp Neurol. 350, 187–198. - PubMed
    1. Denman-Johnson K, and Forge A (1999). Establishment of hair bundle polarity and orientation in the developing vestibular system of the mouse. J Neurocytol. 28, 821–835. - PubMed

Publication types