. 2020 Jan 5;12(1):571-592.
doi: 10.18632/aging.102641. Epub 2020 Jan 5.

STARD1 and NPC1 expression as pathological markers associated with astrogliosis in post-mortem brains from patients with Alzheimer's disease and Down syndrome

Affiliations

STARD1 and NPC1 expression as pathological markers associated with astrogliosis in post-mortem brains from patients with Alzheimer's disease and Down syndrome

Fabian Arenas et al. Aging (Albany NY). .

Abstract

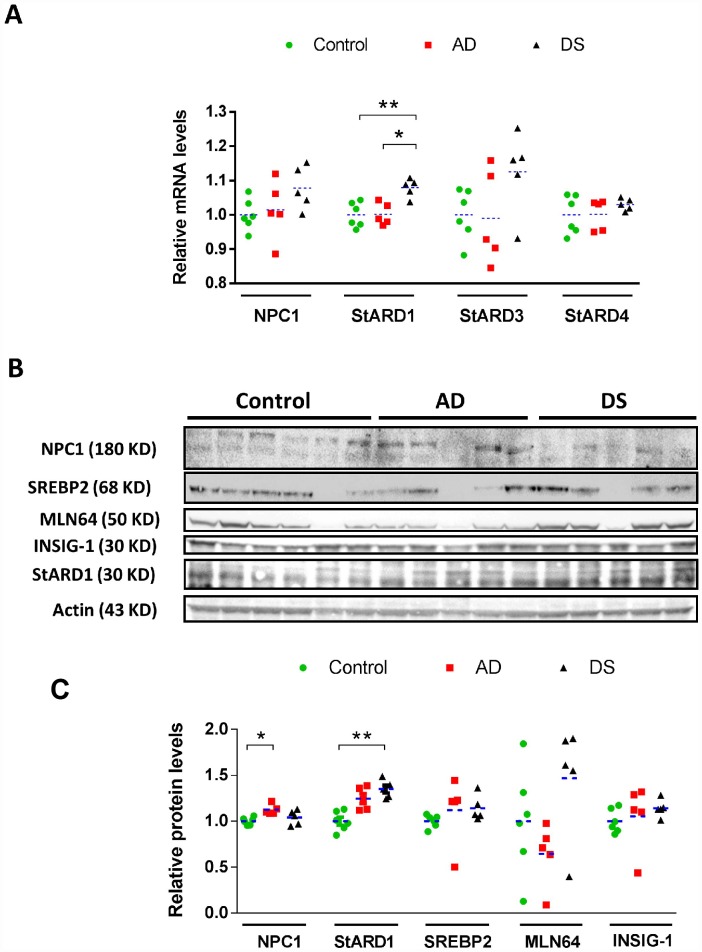
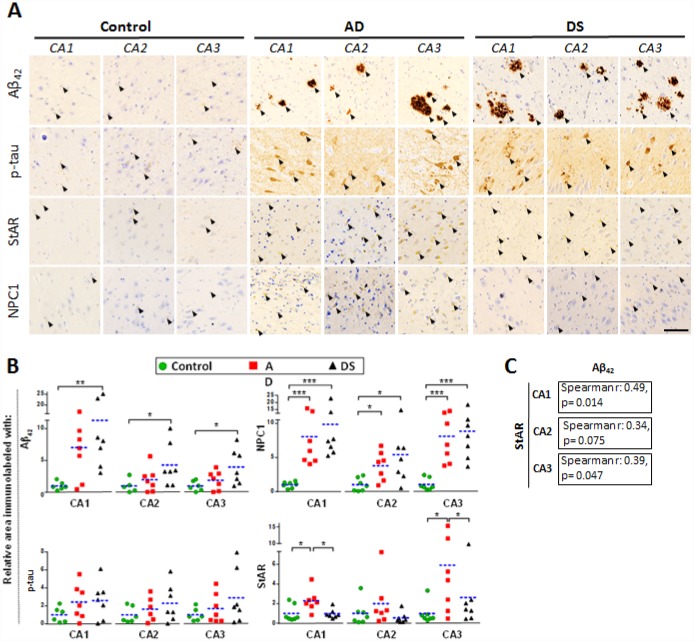
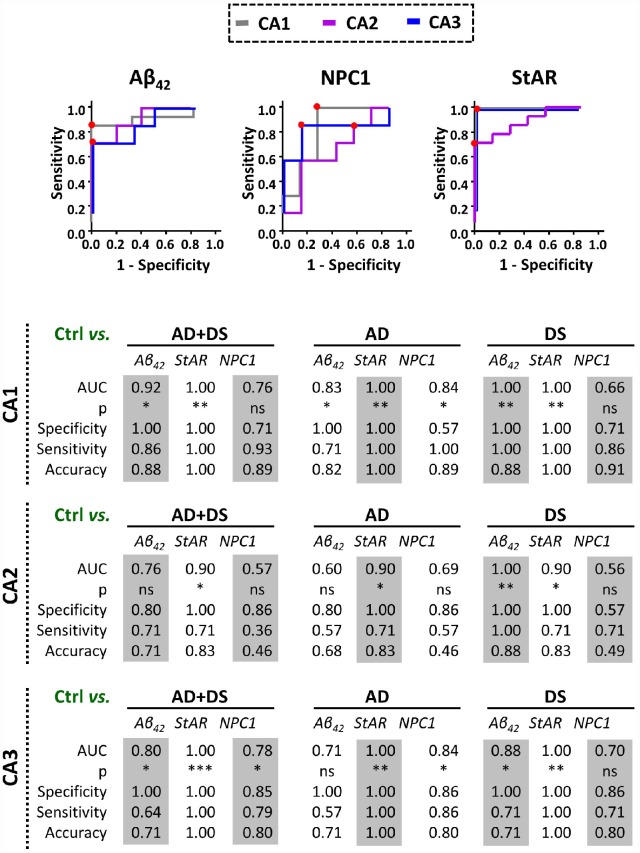
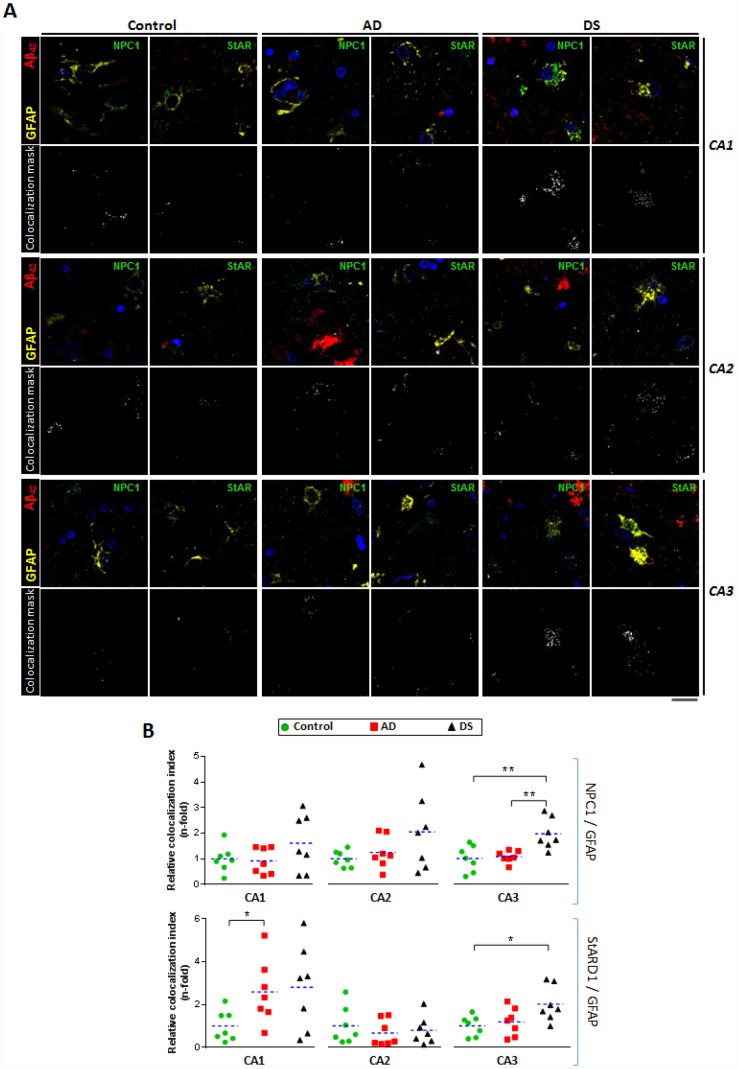
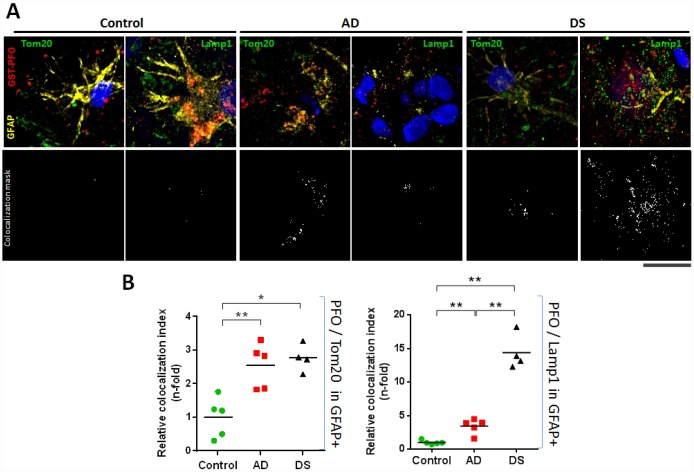
Alzheimer´s disease (AD) is a progressive neurodegenerative disorder of complex etiology, while Down syndrome (DS) is considered a genetically determined form of AD. Alterations in cholesterol homeostasis have been linked to AD although the role in this association is not well understood. Increased expression of STARD1 and NPC1, which are involved in intracellular cholesterol trafficking, has been reported in experimental AD models but not in patients with AD. Here we analyzed endolysosomal/mitochondrial cholesterol homeostasis, expression of NPC1 and STARD1 and correlation with pathological markers of AD in cortex and hippocampus from post-mortem brains from patients with AD and DS. NPC1 expression was observed in hippocampus from patients with AD and DS. Moreover, STARD1 expression increased in hippocampus and cortex from patients with AD and DS, respectively, and its immunoreactivity discriminated controls from AD or DS with a better accuracy than Aβ42. Hippocampal areas stained with the recombinant GST-PFO probe showed increased mitochondrial cholesterol within astrocytes of brains from patients with AD and DS-brains compared to controls. Lysosomal cholesterol accumulation within hippocampal astrocytes was higher in DS than in AD. These data revealed increased intracellular cholesterol loading in hippocampus from patient with AD and DS and suggest that STARD1 could be a potential pre-clinical marker associated with early stages of AD pathology.

Keywords: NPC1; StARD1; cholesterol; lysosomes; mitochondria.


Conflict of interest statement

CONFLICTS OF INTEREST: The authors declare there are no conflicts of interest.

Figures

Figure 1
Figure 1
Cortical expression profile of intracellular cholesterol carriers and sensors/regulators. (A) Relative mRNA levels of NPC1, StARD3, StARD4, and StARD1 in human cortex from AD (n=5), DS (n=5), and control (n=6) subjects. Transcripts levels were normalized with respect to controls using β-actin. (*) p<0.05; (**) p<0.01. (B) Immunoblotting of NPC1, StARD1, StARD3/MLN64, mSREBP2 and INSIG-1 of total protein extracts (90 μg/lane) from human cortex from AD (n=5), DS (n=5), and control (n=6) donors. (C) Protein levels quantified by densitometry and normalized using β-actin as housekeeping followed by normalization with control group. (*) p<0.05; (**) p<0.01.
Figure 2
Figure 2
Hippocampal expression of AD biomarkers and lysosomal/mitochondrial cholesterol carriers. (A) Representative images of immunohistochemistry of paraffin sections (5 μm) against Aβ42, p-tau, StARD1 and NPC1 for CA1, CA2 and CA3 hippocampal regions from AD (n=7), DS (n=7), and control (n=7) subjects. Positive immunoreactivity is shown by black arrows. Scale bar: 100 μm. (B) Quantitation of IHC shown in A using Image J software as described in Supplementary methods. For each hippocampal region, the % of immunolabeled area was normalized to control group. (*) p<0.05; (**) p<0.01; (***) p<0.001. (C) Spearman’s correlation values between IHC-immunolabeling for Aβ42 and StARD1 in each hippocampal region.
Figure 3
Figure 3
Discrimination capacity of amyloid accumulation and lysosomal/mitochondrial cholesterol carriers. ROC curves of immunolabel for Aβ42, NPC1, and StARD1 in each hippocampal region with the significantly highest AUC resulted in the comparison between control and AD, DS, or AD+DS groups (Lower panel). Red dots show the cutoff for the corresponding IHC-immunolabel that better discriminate AD and/or DS condition from normal controls in each hippocampal region. (*) p<0.05; (**) p<0.01; (***) p<0.001.
Figure 4
Figure 4
Astrocytes-expressing lysosomal and mitochondrial cholesterol carriers in hippocampal regions. (A) Representative confocal images of paraffined hippocampal regions (5 μm) from AD (n=7), DS (n=7), and control (n=7) subjects immunolabeled against Aβ42 (red), GFAP (yellow), and NPC1 or StARD1 (both green). Nuclei are stained with Hoechst 33342 (blue). Lower panels show the colocalization mask between GFAP and NPC1 or StARD1 (white) highlighted in the squared areas. Scale bar: 10 μm. (B) Astrocyte colocalization with NPC1 (lysosomal) and StARD1 (mitochondrial) cholesterol carriers into hippocampal regions from AD, DS, and control subjects. 10 images per hippocampal region and per sample were analysed with Image J to assess the index of astrocyte (GFAP+) colocalization with NPC1 or StARD1. (*) p<0.05; (**) p<0.01; (***) p<0.001.
Figure 5
Figure 5
Lysosomal and mitochondrial cholesterol homeostasis in hippocampal astrocytes. (A) Representative confocal representative images of 4 μm thin-stacked cryopreserved hippocampus from AD (n=5), DS (n=4), and control (n=5) subjects immunolabeled with GST-PFO (red), GFAP (yellow), and Tom20 or Lamp1 (both green). Nuclei are stained with Dapi (blue). Lower panels show colocalization mask (white) between GST-PFO and Tom20 or Lamp1, respectively, highlighted in the squared areas. Scale bar: 10 μm. (B) Cholesterol (PFO+) colocalization with mitochondria (Tom20+) or lysosome (Lamp1+) into hippocampal astrocytes (GFAP+) from AD, DS, and control donors. 10 images per sample were analysed with Image J to assess the index of astrocytic cholesterol colocalization with Tom20 or Lamp1. Values are relativized with control to show differences as n-fold. (*) p<0.05; (**) p<0.01.

References

    1. Bharadwaj P, Solomon T, Malajczuk CJ, Mancera RL, Howard M, Arrigan DW, Newsholme P, Martins RN. Role of the cell membrane interface in modulating production and uptake of Alzheimer’s beta amyloid protein. Biochim Biophys Acta Biomembr. 2018. [Epub ahead of print]. 10.1016/j.bbamem.2018.03.015 - DOI - PubMed
    1. Arenas F, Garcia-Ruiz C, Fernandez-Checa JC. Intracellular Cholesterol Trafficking and Impact in Neurodegeneration. Front Mol Neurosci. 2017; 10:382. 10.3389/fnmol.2017.00382 - DOI - PMC - PubMed
    1. Kågedal K, Kim WS, Appelqvist H, Chan S, Cheng D, Agholme L, Barnham K, McCann H, Halliday G, Garner B. Increased expression of the lysosomal cholesterol transporter NPC1 in Alzheimer’s disease. Biochim Biophys Acta. 2010; 1801:831–38. 10.1016/j.bbalip.2010.05.005 - DOI - PubMed
    1. Elustondo P, Martin LA, Karten B. Mitochondrial cholesterol import. Biochim Biophys Acta Mol Cell Biol Lipids. 2017; 1862:90–101. 10.1016/j.bbalip.2016.08.012 - DOI - PubMed
    1. Webber KM, Stocco DM, Casadesus G, Bowen RL, Atwood CS, Previll LA, Harris PL, Zhu X, Perry G, Smith MA. Steroidogenic acute regulatory protein (StAR): evidence of gonadotropin-induced steroidogenesis in Alzheimer disease. Mol Neurodegener. 2006; 1:14. 10.1186/1750-1326-1-14 - DOI - PMC - PubMed

Publication types

MeSH terms