. 2020 Jan 1;10(1):17-35.
doi: 10.7150/thno.36930. eCollection 2020.

Macrophage MSR1 promotes BMSC osteogenic differentiation and M2-like polarization by activating PI3K/AKT/GSK3β/β-catenin pathway

Affiliations

Macrophage MSR1 promotes BMSC osteogenic differentiation and M2-like polarization by activating PI3K/AKT/GSK3β/β-catenin pathway

Shu-Jie Zhao et al. Theranostics. .

Abstract

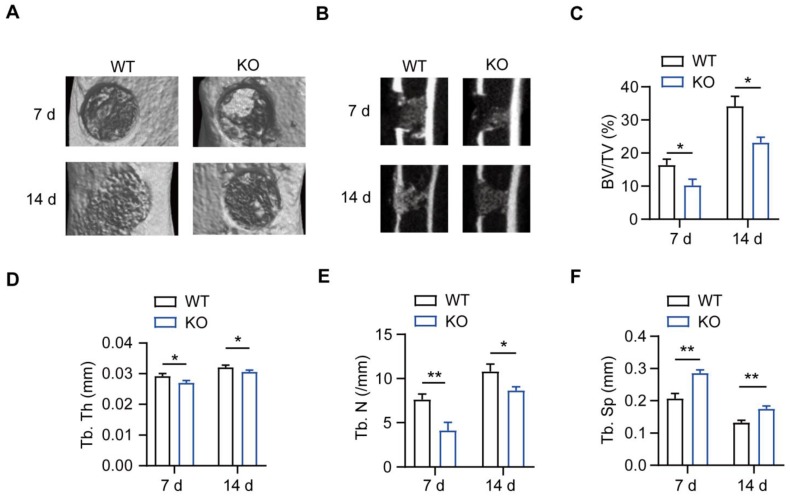
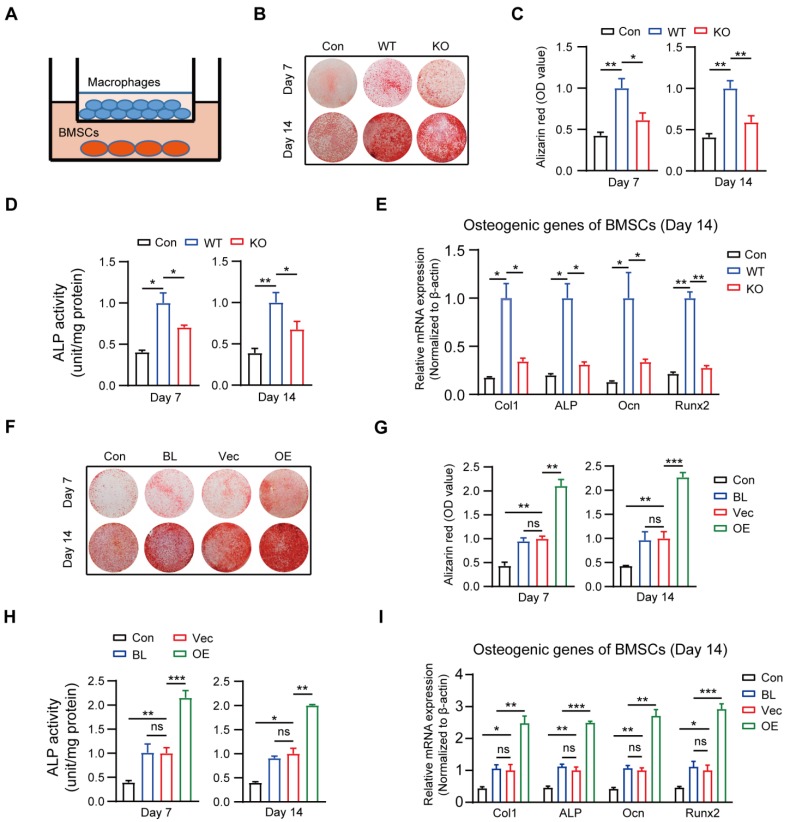
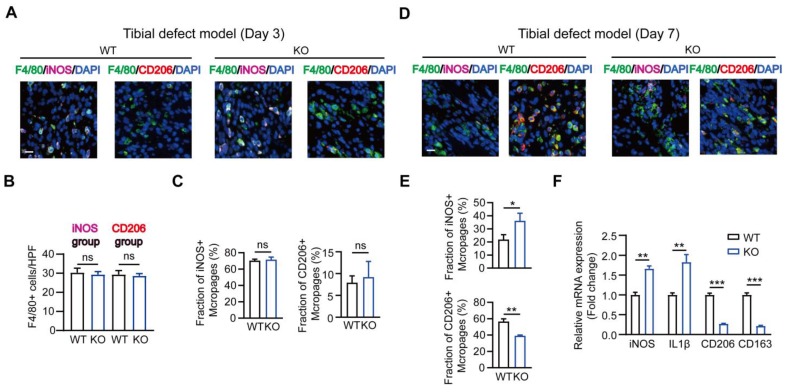
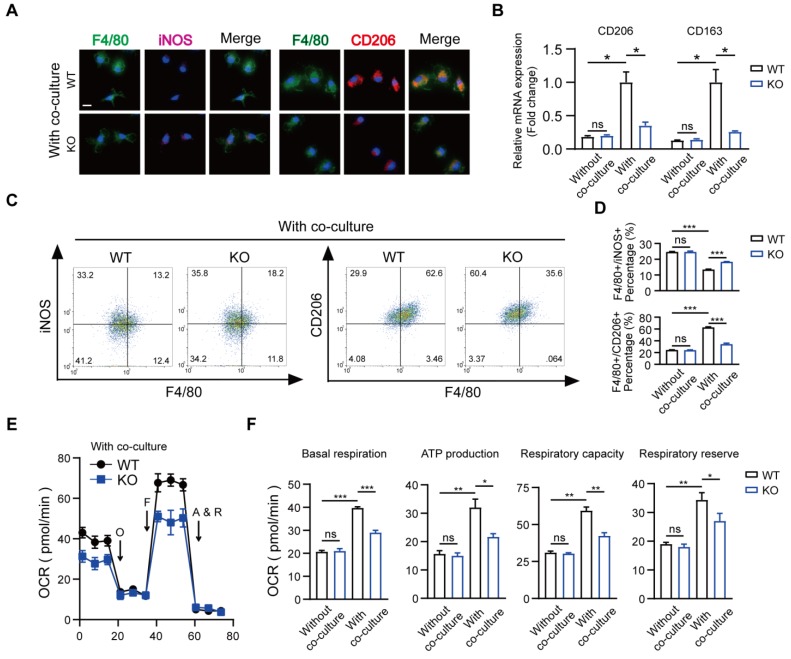
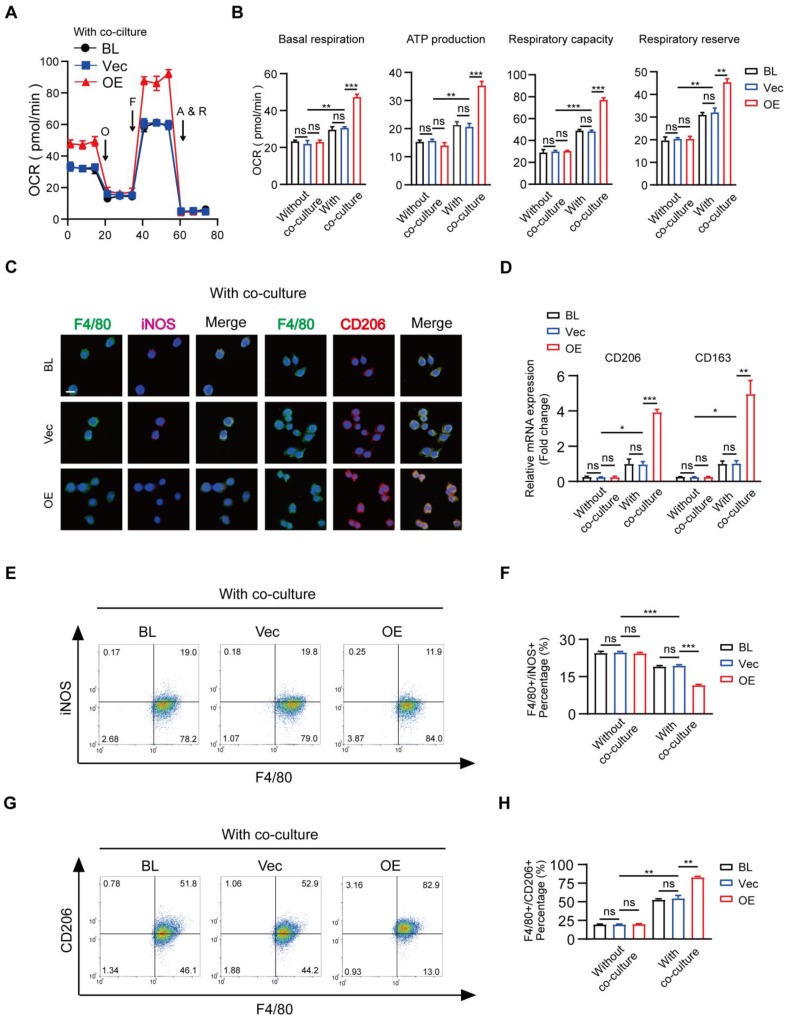
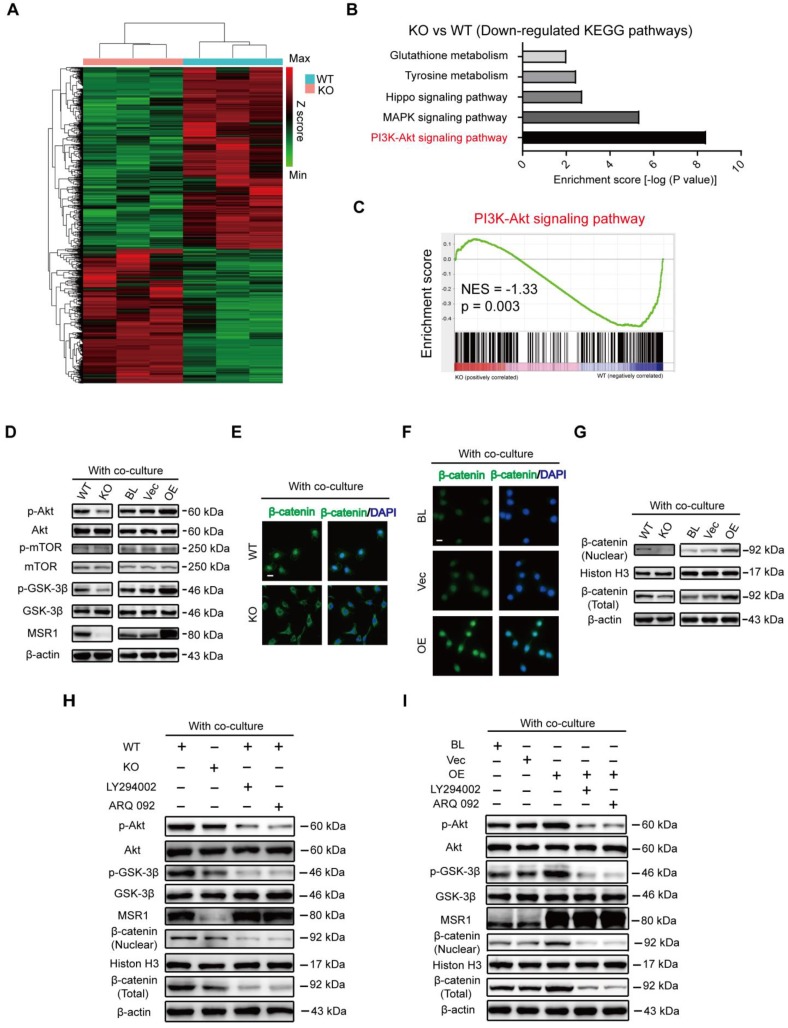
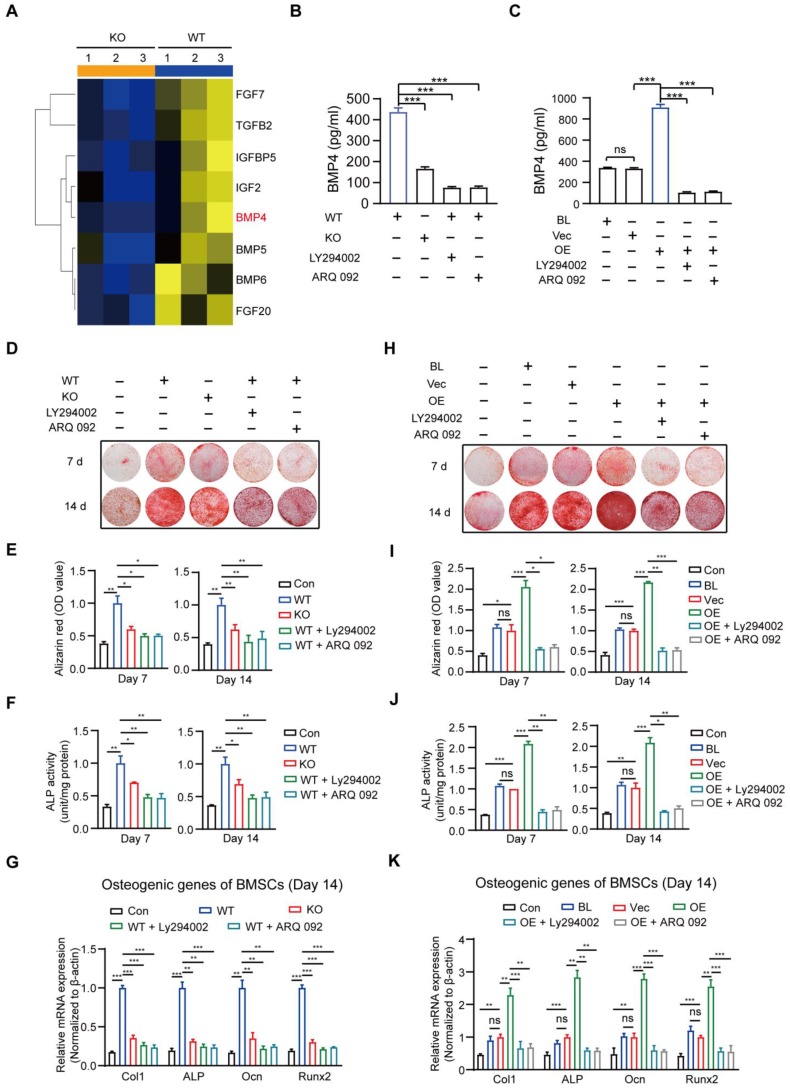
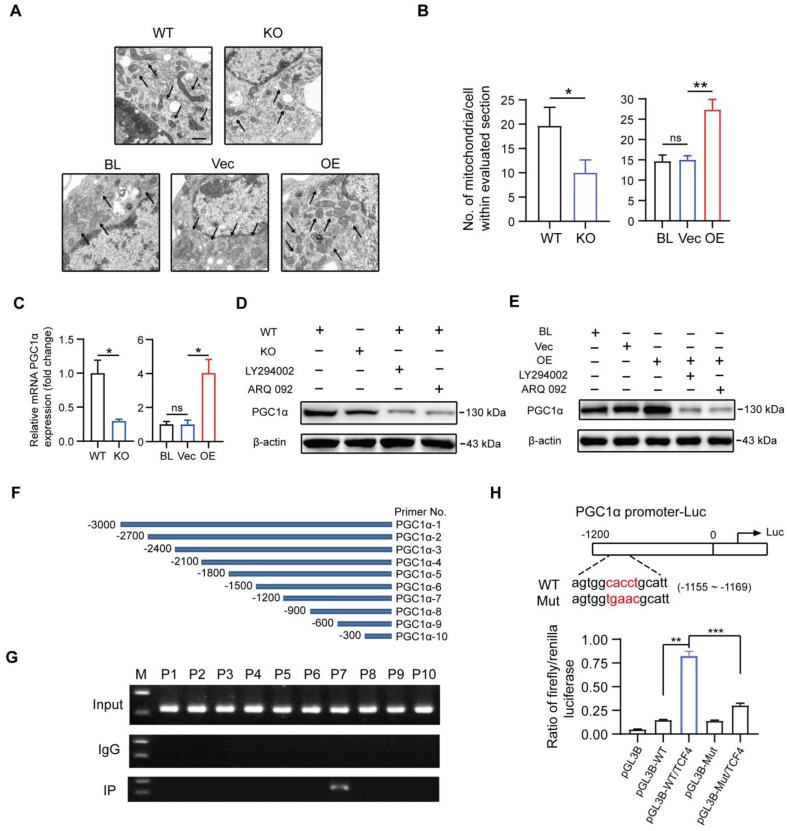
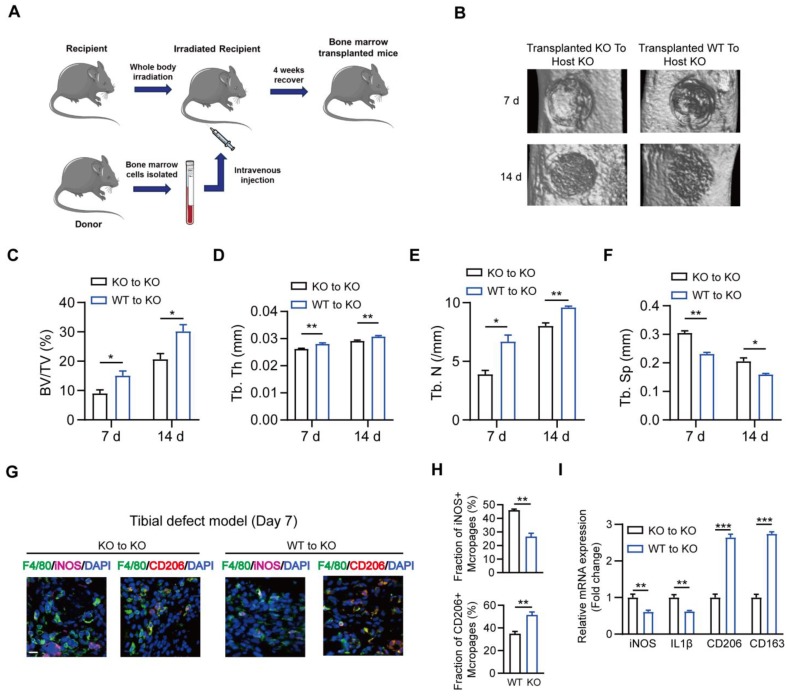
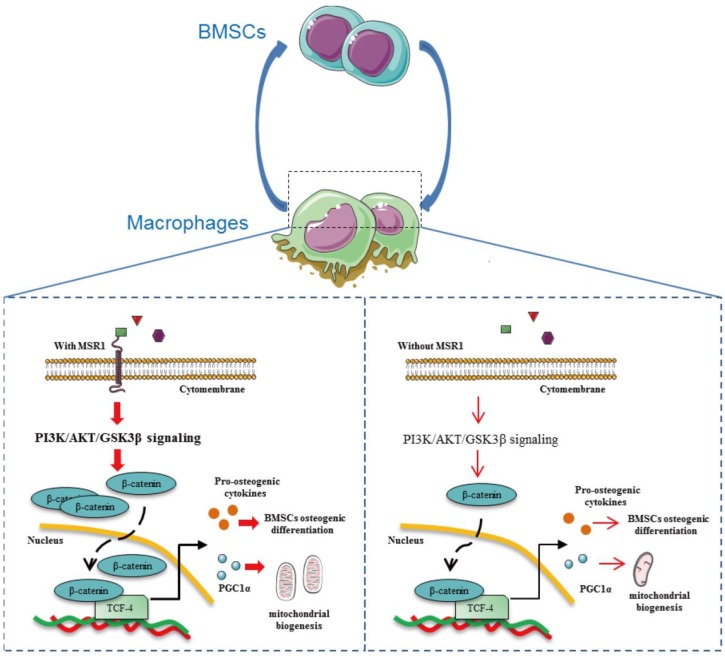
Approximately 10% of bone fractures do not heal satisfactorily, leading to significant clinical and socioeconomic implications. Recently, the role of macrophages in regulating bone marrow stem cell (BMSC) differentiation through the osteogenic pathway during fracture healing has attracted much attention. Methods: The tibial monocortical defect model was employed to determine the critical role of macrophage scavenger receptor 1 (MSR1) during intramembranous ossification (IO) in vivo. The potential functions and mechanisms of MSR1 were explored in a co-culture system of bone marrow-derived macrophages (BMDMs), RAW264.7 cells, and BMSCs using qPCR, Western blotting, immunofluorescence, and RNA sequencing. Results: In this study, using the tibial monocortical defect model, we observed delayed IO in MSR1 knockout (KO) mice compared to MSR1 wild-type (WT) mice. Furthermore, macrophage MSR1 mediated PI3K/AKT/GSK3β/β-catenin signaling increased ability to promote osteogenic differentiation of BMSCs in the co-culture system. We also identified proliferator-activated receptor gamma coactivator 1-alpha (PGC1α) as the target gene for macrophage MSR1-activated PI3K/AKT/GSK3β/β-catenin pathway in the co-culture system that facilitated M2-like polarization by enhancing mitochondrial oxidative phosphorylation. Conclusion: Our findings revealed a previously unrecognized function of MSR1 in macrophages during fracture repair. Targeting MSR1 might, therefore, be a new therapeutic strategy for fracture repair.

Keywords: Bone marrow stem cells; Macrophage scavenger receptor 1; Osteogenic differentiation; Oxidative phosphorylation; PI3K/AKT/GSK3β/β-catenin pathway.


Conflict of interest statement

Competing Interests: The authors have declared that no competing interest exists.

Figures

Figure 1
Figure 1
Impaired intramembranous ossification (IO) in MSR1 KO mice. (A) Representative 3D images of the injured tibiae by micro-CT on day 7 or 14 post-surgery. (B) Representative 2D coronal images of the injured tibiae from MSR1 WT and KO groups on day 7 or 14 post-surgery. (C-F) 3D structural parameters of bone volume (BV)/tissue volume (TV) (%) (C), trabecular thickness (Tb. Th) (D), trabecular number (Tb. N) (E) and trabecular separation (Tb. Sp) (F) for the defect region on day 7 and 14 post-surgery were further analyzed (values are mean ± SD, *p < 0.05, **p < 0.01).
Figure 2
Figure 2
Macrophage MSR1 exhibits pro-osteogenic differentiation effect of BMSC in a co-culture system. (A) BMSCs were seeded in the lower chamber, and macrophages were cultured in the upper chamber. (B) In a co-culture system for 7 or 14 days, MSR1 KO BMDMs reduced the ability to promote osteogenic differentiation of BMSCs as indicated by AR staining. BMSCs without co-culture were set as the control (Con) group. (C and D) Quantitative evaluation of AR staining results (C) and ALP activities (D) on day 7 and 14 was performed (Values are expressed as mean ± SD, *p < 0.05, **p < 0.01). (E) mRNA expression levels of osteogenic marker genes (Runx2, Ocn, ALP, and Col1) in osteogenic differentiation of BMSCs on day 14 were detected by qPCR in different groups. β-actin was used as an internal control (Values are mean ± SD, *p < 0.05, **p < 0.01). (F) In the co-culture system, MSR1-overexpressing RAW264.7 cells enhanced osteogenic differentiation of BMSCs on day 7 and 14 as revealed by AR staining. BMSCs cultured alone were set as the Con group and RAW264.7 cells without MSR1-plasmid transfection were defined as the blank (BL) group. Vec: vector group, OE: overexpression group. (G and H) Quantitative analyses of AR staining results (G) and ALP activities (H) of osteogenic differentiation of BMSCs on day 7 and 14 were performed. Values are expressed as mean ± SD, *p < 0.05, **p < 0.01, ***p < 0.001, ns indicates no significance. (I) mRNA expression levels of Col1, ALP, Ocn and Runx2 in osteogenic differentiation of BMSCs on day 14 by qPCR in different groups. β-actin was used as an internal control (Values are expressed as mean ± SD, *p < 0.05, **p < 0.01, ***p < 0.001, ns indicates no significance).
Figure 3
Figure 3
MSR1-depletion reduced the fraction of M2-like macrophages on day 7 post-surgery in the tibial monocortical defect model. (A) Immunofluorescence (IF) staining of the total macrophage biomarker, F4/80 (green), and M1-like macrophage biomarker, iNOS (purple) and M2-like macrophage biomarker, CD206 (red), in facture tissues on day 3 post-surgery in the tibial monocortical defect model. Nuclei were counterstained with DAPI (blue). Bar = 200 μm. (B and C) The infiltration of F4/80+ macrophages (B) and the fraction of iNOS+ F4/80+ and CD206+ F4/80+ macrophages (C) were determined on day 3 post-surgery in the tibial monocortical defect model from MSR1 WT and KO mice (Values are expressed as mean ± SD, ns indicates no significance). iNOS group indicates the samples stained with anti-F4/80 and anti-iNOS; the slides stained with anti-F4/80, and anti-CD206 denote the CD206 group. (D) Representative IF images of total macrophages (F4/80+), M1-like macrophages (iNOS+ F4/80+), and M2-like macrophages (CD206+ F4/80+) in facture tissues on day 7 post-surgery of the tibial monocortical defect model. Nuclei were counterstained with DAPI (blue). Bar = 200 μm. (E) The iNOS+ and CD206+ macrophage fractions were determined by the percentages of iNOS+ and CD206+ macrophages within F4/80+ macrophage populations in the MSR1 WT or KO fracture tissues on day 7 post-surgery in the tibial monocortical defect model (Values are expressed as mean ± SD, *p < 0.05, **p < 0.01). (F) mRNA expression levels of macrophage marker genes (M1-like: iNOS and IL-1b, M2-like: CD206 and CD163) in the fracture tissues from MSR1 WT or MSR1 KO mice on day 7 in the tibial monocortical defect model (L) (*p < 0.05, **p < 0.01, ***p < 0.001).
Figure 4
Figure 4
Depletion of MSR1 in BMDMs reduced M2-like macrophages and mitochondrial OXPHOS in the co-culture system. (A) IF staining results of MSR1 WT and KO macrophages in the co-culture system for an M1-like marker (iNOS) and M2-like marker (CD206). Bar = 50 μm. (B) mRNA expression levels of M2-like marker genes (CD206 and CD163) in MSR1 WT and KO macrophages with or without co-culture by qPCR. Values are mean ± SD, *p < 0.05, ns indicates no significance. (C) Flow cytometry analysis of MSR1 WT or KO macrophages after co-culturing with BMSCs. Dot plots represent F4/80 and iNOS staining (left panel) and F4/80 and CD206 staining of macrophages (right panel). (D) Percentages of F4/80+ iNOS+ and F4/80+ CD206+ macrophages with or without co-culture were determined. Values are mean ± SD, ***p < 0.001, ns indicates no significance. (E) OCR of BMDMs in MSR1 WT or KO group after co-culture was detected using a Seahorse Bioscience XFp analyzer. O: Oligomycin, F: FCCP, A&R: antimycin A/rotenone. (F) Mitochondrial activities such as basal respiration, ATP production, respiratory capacity, and respiratory reserve were determined in indicated groups. Values are mean ± SD, *p < 0.05, **p < 0.01, ***p < 0.001, ns indicates no significance.
Figure 5
Figure 5
Overexpression of MSR1 in RAW264.7 cells promotes mitochondrial OXPHOS and M2-like polarization in the co-culture system. (A) OCR of blank (BL), vector (Vec), and MSR1-overexpressed (OE) RAW264.7 cells after co-culture were evaluated using a Seahorse Bioscience XFp analyzer. (B) Basal respiration, ATP production, respiratory capacity, and respiratory reserve were determined in BL, Vec, and MSR1 OE RAW264.7 cells with or without co-culture. Values are expressed as mean ± SD, **p < 0.01, ***p < 0.001, ns indicates no significance. (C) IF staining of BL, Vec, and OE RAW264.7 cells after co-culture for the M1-like biomarker (iNOS) and M2-like biomarker (CD206). Bar = 50 μm. (D) mRNA expression levels of M2-like macrophage marker genes (CD206 and CD163) in indicated groups were analyzed by qPCR. Values are expressed as mean ± SD, *p < 0.05, **p < 0.01, ***p < 0.001, ns indicates no significance. (E and G) Flow cytometry analysis of RAW264.7 cells from different groups after co-culture with BMSCs. Dot plots represent F4/80 and iNOS staining of (E) and F4/80 and CD206 staining of RAW264.7 cells (G). (F and H) percentages of F4/80+ iNOS+ (F) and F4/80+ CD206+ (H) in RAW264.7 cells in different groups were calculated. Values are expressed as mean ± SD, *p < 0.05, **p < 0.01, ***p < 0.001, ns indicates no significance.
Figure 6
Figure 6
MSR1 activates macrophage PI3K/AKT/GSK3β/β-catenin signaling in the co-culture system (A) Heat map of DEGs of MSR1 KO or WT BMDMs after co-culturing with BMSCs. Green and red colors represent low and high expression values, respectively. (B) Representative down-regulated KEGG pathway categories affected by MSR1 depletion in macrophages. (C) Gene set enrichment analysis (GSEA) was used to identify the distribution of genes in the PI3K/AKT pathway gene set of MSR1 KO and WT groups. NES, normalized enrichment score. (D) Immunoblot images showing the effect of MSR1 KO or overexpression on the expression of p-AKT/AKT, p-mTOR/mTOR, and p-GSK3β/GSK3β after co-culturing with BMSCs. (E and F) Distribution of β-catenin (green) in MSR1 WT and MSR1 KO macrophages (E), and MSR1 BL, Vec, and overexpressing RAW264.7 cells (F) were analyzed by IF staining. The cell nuclei were stained with DAPI (blue fluorescence), Scale bars: 50 μm. (G) Immunoblot images showing the role of MSR1 KO or OE on the expression of β-catenin from nuclear and whole-cell lysates. (H) Altered protein expression levels of p-AKT/AKT, p-GSK3β/GSK3β, β-catenin (nuclear), and β-catenin (total) were detected using Western blotting in MSR1 KO and WT macrophages in the co-culture system, or in MSR1 WT macrophages treated with LY294002 (an inhibitor of PI3K), ARQ 092 (an inhibitor of AKT) before co-culture. (I) Protein expression levels of p-AKT/AKT, p-GSK3β/GSK3β, β-catenin (nuclear), and β-catenin (total) were detected using Western blotting in MSR1 BL, Vec and OE RAW264.7 cells in the co-culture system, or MSR1 OE RAW264.7 cells treated with LY294002 (an inhibitor of PI3K), ARQ 092 (an inhibitor of AKT) before co-culture.
Figure 7
Figure 7
MSR1-activated macrophage PI3K/AKT/GSK3β/β-catenin signaling promotes osteogenic differentiation of BMSCs. (A) Heat map of several genes encoding molecules involved in BMSC osteogenic differentiation was performed based on the results of RNA sequencing (MSR1 KO vs. WT). Blue and yellow colors represent low and high expression values, respectively.(B) The amount of secreted BMP4 in 24-h in the serum-free medium by MSR1 WT and MSR1 KO macrophages after co-culture, or MSR1 WT macrophages treated with LY294002 or ARQ 092 before co-culture was assessed by ELISA. Values are expressed as mean ± SD, ***p < 0.001. (C) The amount of secreted BMP4 in 24-h serum-free MSR1 BL, Vec, and OE RAW264.7 cells after co-culture, or MSR1 OE RAW264.7 cells treated with LY294002, ARQ 092 before co-culture was determined by ELISA. Values are expressed as mean ± SD, ***p < 0.001. (D-F) In the co-culture system, knockout of MSR1 or inhibition of PI3K/AKT/GSK3β/β-catenin signaling in macrophages impaired pro-osteogenic differentiation of BMSCs as observed by AR staining (D). Quantitative evaluation of AR staining results (E) and ALP activities (F) on day 7 and 14 was performed. BMSC without co-culture was used as the Con group. Values are expressed as mean ± SD, *p < 0.05, **p < 0.01. (G) mRNA expression levels of osteogenic biomarkers (Col1, ALP, Ocn and Runx2) in osteogenic differentiated BMSCs on day 14 were detected by qPCR in different groups. β-actin was used as an internal control. Values are expressed as mean ± SD, **p < 0.01, ***p < 0.001. (H-J) Inhibition of PI3K/AKT/GSK3β/β-catenin signaling in MSR1 OE RAW264.7 cells in the co-culture system decreased osteogenic differentiation of BMSCs as observed by AR staining (H). Quantitative evaluation of AR staining results (I) and ALP activities (J) on day 7 and 14 was performed. Values are expressed as mean ± SD, *p < 0.05, **p < 0.01, ***p < 0.001, ns indicates no significance. (K) mRNA expression levels of Col1, ALP, Ocn and Runx2 in osteogenic differentiated BMSCs on day 14 detected by qPCR in the indicated groups. β-actin was used as an internal control. Values are expressed as mean ± SD, **p < 0. 01, ***p < 0.001, ns indicates no significance.
Figure 8
Figure 8
Macrophage MSR1 regulates the expression of PGC1α in the co-culture system. (A) The number of mitochondria per cell in different groups was evaluated by transmission electron microscopy. Black arrows indicate mitochondria. Scale bars: 500 nm. (B) Quantification of the number of mitochondria per cell in the imaged section. Values are mean ± SD, *p < 0.05, **p < 0.01, ns indicates no significance. (C) mRNA expression levels of PGC1α in MSR1 WT and MSR1 KO macrophages, and MSR1 BL, Vec, and MSR1 OE RAW264.7 cells were determined by qPCR. Values are mean ± SD, *p < 0.05, ns indicates no significance. (D) Altered protein expression level of PGC1α was detected by Western blotting in MSR1 KO macrophages in the co-culture system, or MSR1 WT macrophages treated with LY294002, ARQ 092 before co-culture. (E) Immunoblot images of the protein expression level of PGC1α in MSR1 BL and Vec RAW264.7 cells in the co-culture system, or MSR1 OE RAW264.7 cells treated with LY294002, ARQ 092 before co-culture. (F) Diagram depicting 10 pairs of primers in the promoter region of PGC1α. (G) ChIP assay was performed to confirm the potential TCF-binding site in the PGC1α promoter region in macrophages. Immunoprecipitated DNA was amplified with a series of primers covering the 3000 bp sequence upstream from PGC1α transcription start site. (H) Luciferase reporter assay was performed using macrophages after transfecting the wild-type and mutant PGC1α promoter (mutation site: red). Values are mean ± SD, **p < 0.01, ***p < 0.001.
Figure 9
Figure 9
Substitution of MSR1 KO bone marrow with MSR1 WT bone marrow promotes intramembranous bone healing. (A) Schematic representation of the main steps of the bone marrow transplant. (B) Representation of 3D images of injured tibiae from different transplanted mice (KO to KO vs. WT to KO) by micro-CT on day 7 or 14 post-surgery. (C-F) Quantification of BV/TV (%) (C), Tb. Th (mm) (D), Tb. N (/mm) (E) and Tb. Sp (mm) (F) in the defect region on day 7 and 14 post-surgery for different transplanted mice (KO to KO vs. WT to KO) (Values are expressed as mean ± SD, *p < 0.05). (G) Representative IF images of total macrophages (F4/80+), M1-like macrophages (iNOS+ F4/80+) and M2-like macrophages (CD206+ F4/80+) in facture tissues from the bone marrow of transplanted mice (transplanted MSR1 KO bone marrow to host KO mice and transplanted MSR1 WT bone marrow to host KO mice) on day 7 post-surgery in the tibial monocortical defect model. Nuclei were counterstained with DAPI (blue). Bar = 100 μm. (H) The iNOS+ and CD206+ macrophage fractions were determined from different transplanted mice (KO to KO vs. WT to KO) on day 7 post-surgery of the tibial monocortical defect model (Values are expressed as mean ± SD, *p < 0.05, **p < 0.01). (I) mRNA expression levels of macrophage marker genes (M1-like: iNOS and IL-1b, M2-like: CD206 and CD163) in fracture tissues from different transplanted mice on day 7 in the tibial monocortical defect model (K) (*p < 0.05, **p < 0.01, ***p < 0.001).
Figure 10
Figure 10
Macrophage MSR1 is essential for maintaining M2-like activation and promoting BMSC osteogenic differentiation. In the communication between macrophages and BMSCs, MSR1 plays a crucial role in maintaining M2-like polarization and facilitating BMSC osteogenic differentiation. MSR1-mediated activation of PI3K/AKT/GSK3β/β-catenin signaling promotes BMSC osteogenic differentiation. Notably, PGC1α is regulated by MSR1-mediated PI3K/AKT/GSK3β/β-catenin signaling in the macrophages. Increased PGC1α promotes oxidative phosphorylation by enhancing mitochondrial biogenesis to maintain M2-like activation in macrophages.

Similar articles

Cited by

References

    1. Hak DJ, Fitzpatrick D, Bishop JA, Marsh JL, Tilp S, Schnettler R. et al. Delayed union and nonunions: epidemiology, clinical issues, and financial aspects. Injury. 2014;45(Suppl 2):S3–7. - PubMed
    1. Gerstenfeld LC, Cullinane DM, Barnes GL, Graves DT, Einhorn TA. Fracture healing as a post-natal developmental process: molecular, spatial, and temporal aspects of its regulation. J Cell Biochem. 2003;88:873–84. - PubMed
    1. Schindeler A, McDonald MM, Bokko P, Little DG. Bone remodeling during fracture repair: The cellular picture. Semin Cell Dev Biol. 2008;19:459–66. - PubMed
    1. Thompson Z, Miclau T, Hu D, Helms JA. A model for intramembranous ossification during fracture healing. J Orthop Res. 2002;20:1091–8. - PubMed
    1. Phillips AM. Overview of the fracture healing cascade. Injury. 2005;36(Suppl 3):S5–7. - PubMed

Publication types