. 2020 Jan 1;10(1):74-90.
doi: 10.7150/thno.35841. eCollection 2020.

Microglia exacerbate white matter injury via complement C3/C3aR pathway after hypoperfusion

Affiliations

Microglia exacerbate white matter injury via complement C3/C3aR pathway after hypoperfusion

Lin-Yuan Zhang et al. Theranostics. .

Abstract

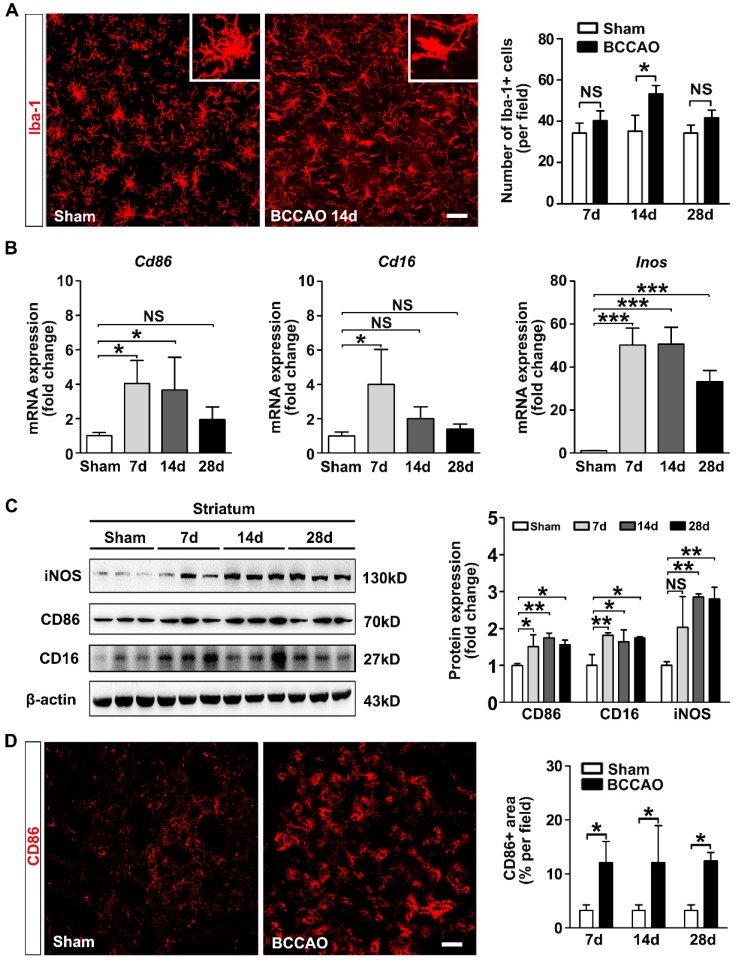
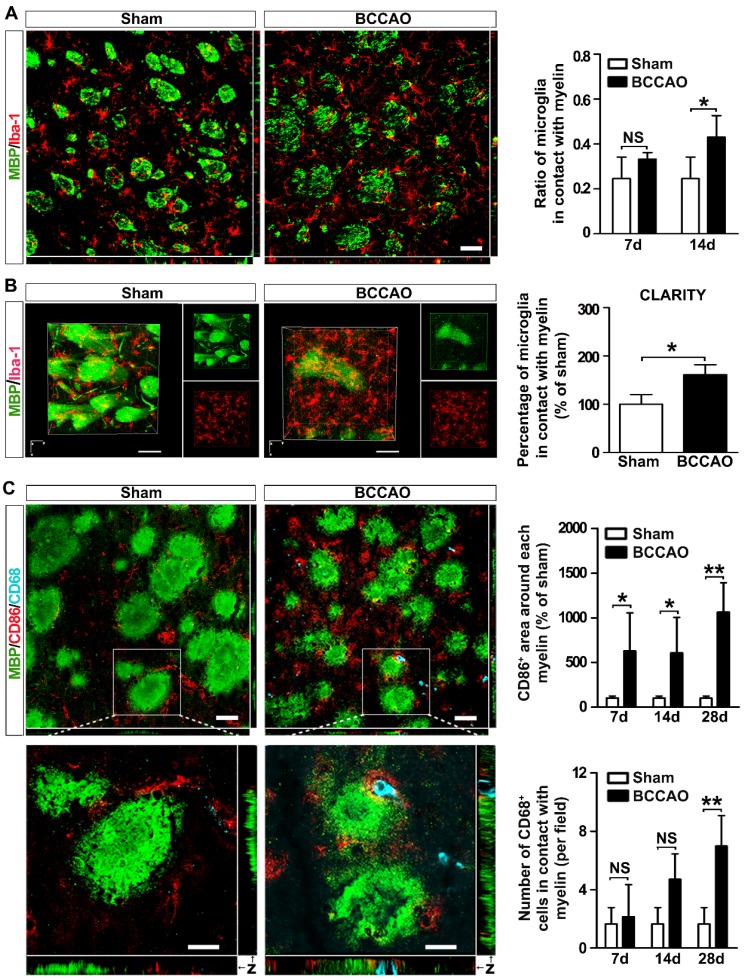
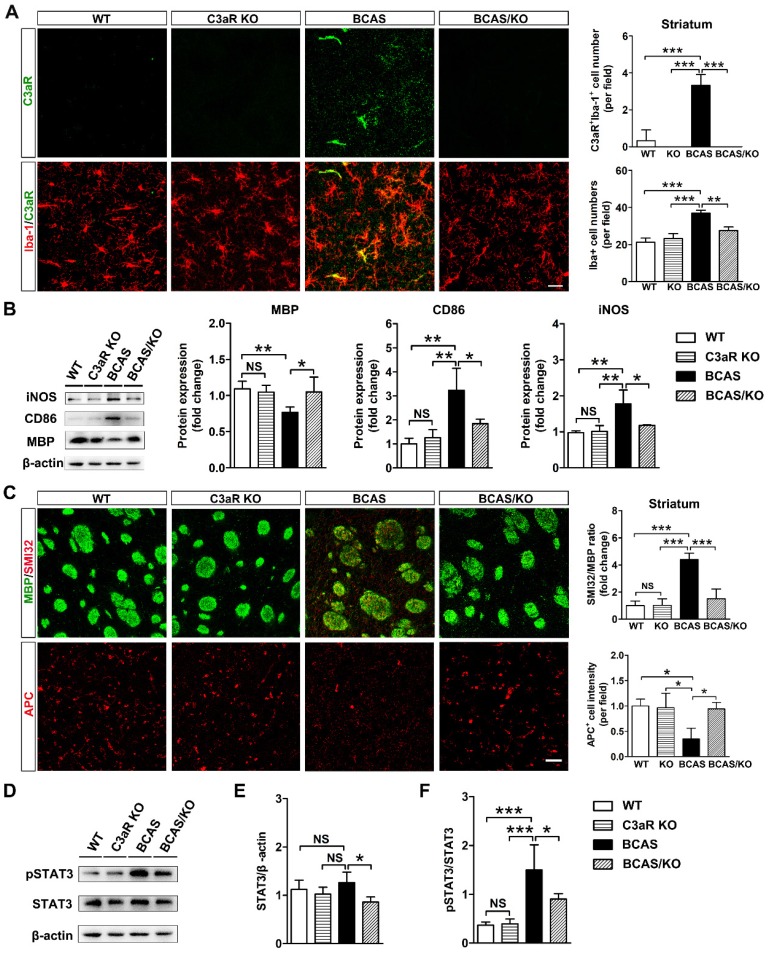
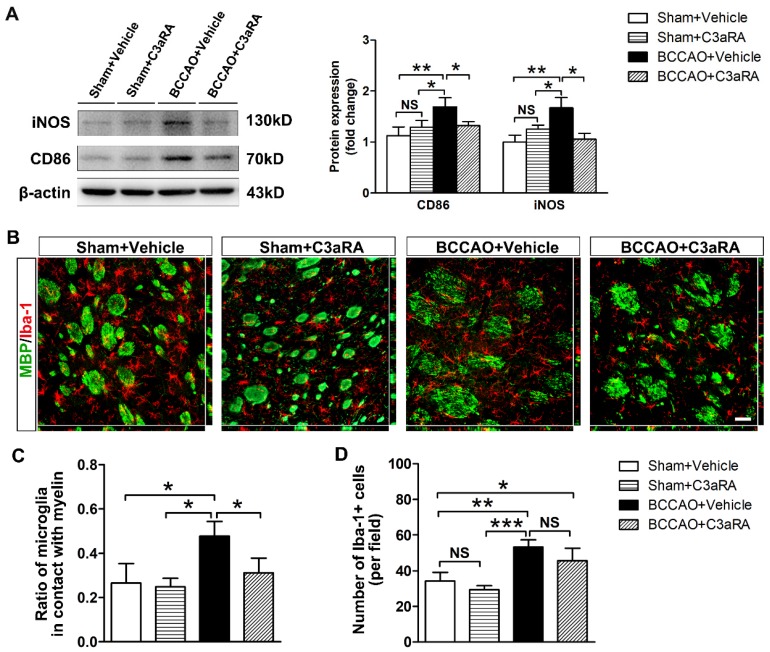
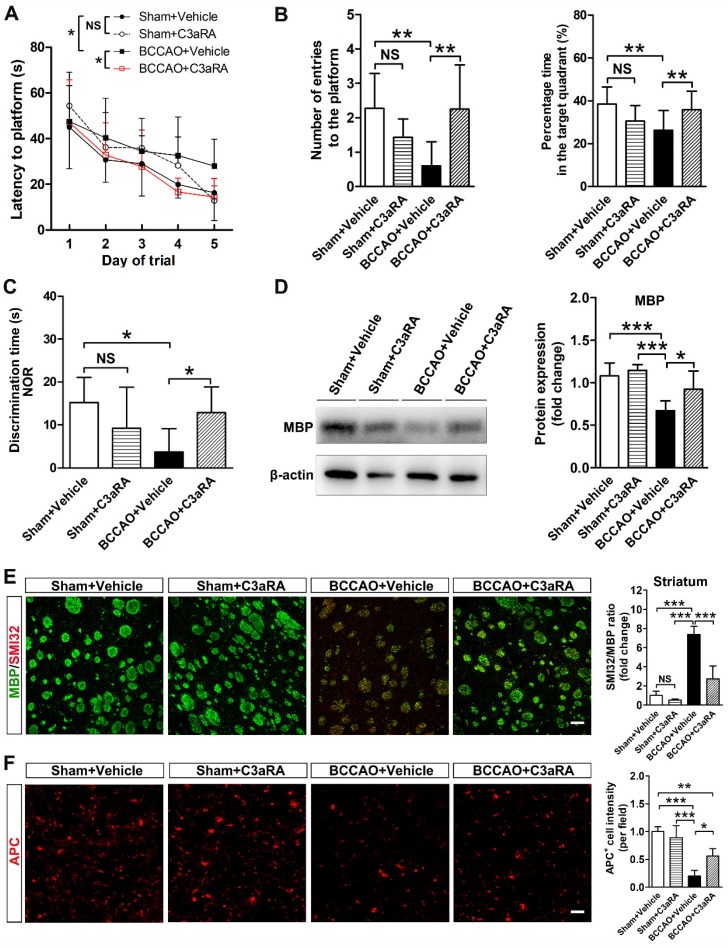
Microglial activation participates in white matter injury after cerebral hypoperfusion. However, the underlying mechanism is unclear. Here, we explore whether activated microglia aggravate white matter injury via complement C3-C3aR pathway after chronic cerebral hypoperfusion. Methods: Adult male Sprague-Dawley rats (n = 80) underwent bilateral common carotid artery occlusion for 7, 14, and 28 days. Cerebral vessel density and blood flow were examined by synchrotron radiation angiography and three-dimensional arterial spin labeling. Neurobehavioral assessments, CLARITY imaging, and immunohistochemistry were performed to evaluate activation of microglia and C3-C3aR pathway. Furthermore, C3aR knockout mice were used to establish the causal relationship of C3-C3aR signaling on microglia activation and white matter injury after hypoperfusion. Results: Cerebral vessel density and blood flow were reduced after hypoperfusion (p<0.05). Spatial learning and memory deficits and white matter injury were shown (p<0.05). These impairments were correlated with aberrant microglia activation and an increase in the number of reactive microglia adhering to and phagocytosed myelin in the hypoperfusion group (p<0.05), which were accompanied by the up-regulation of complement C3 and its receptors C3aR (p<0.05). Genetic deletion of C3ar1 significantly inhibited aberrant microglial activation and reversed white matter injury after hypoperfusion (p<0.05). Furthermore, the C3aR antagonist SB290157 decreased the number of microglia adhering to myelin (p<0.05), attenuated white matter injury and cognitive deficits in chronic hypoperfusion rats (p<0.05). Conclusions: Our results demonstrated that aberrant activated microglia aggravate white matter injury via C3-C3aR pathway during chronic hypoperfusion. These findings indicate C3aR plays a critical role in mediating neuroinflammation and white matter injury through aberrant microglia activation, which provides a novel therapeutic target for the small vessel disease and vascular dementia.

Keywords: chronic cerebral hypoperfusion; complement; inflammation; microglia; white matter injury.


Conflict of interest statement

Competing Interests: The authors have declared that no competing interest exists.

Figures

Figure 1
Figure 1
Experimental design and BCCAO-induced cerebral vessel and dynamic cerebral blood flow changes. A Experimental design. BCCAO surgery was performed at day 0, and the animals were sacrificed at day 7, 14, and 28 after BCCAO. B Representative images of SRA in control and BCCAO rats at day 7, 14, and 28 after surgery. n = 6-12 animals in each group. Scale bar=1 mm. C Quantification of arterial diameters and cerebral vascular density in control and BCCAO rats at day 7, 14, and 28 after surgery. D Representative 3D arterial spin labeling images in rats at baseline and day 7, 14, and 28 after BCCAO and dynamic cerebral blood flow changes in the cortex and striatum in BCCAO rats at day 7, 14, and 28 after surgery, relative to baseline levels. n = 7 animals. The data are shown as the mean ± SD. ***, p< 0.001; **, p< 0.01; *, p< 0.05; NS, not significant; the BCCAO group vs. the control group. 3D ASL: 3D arterial spin-labeled imaging; ICA: internal carotid artery; MCA: middle cerebral artery; PCA: posterior cerebral artery.
Figure 2
Figure 2
Aberrant activated microglia increase in BCCAO rats. A Representative images and quantification for the number of Iba-1+ microglia cells (red) in the striatum of control and BCCAO rats at day 7, 14, and 28 after surgery. n = 3-4 animals in each group. Scale bar=50 μm. B Quantitative RT-PCR analysis of the expression of Cd86, Cd16, and Inos in the striatum of control and BCCAO rats at day 7, 14, and 28 after surgery. The values are normalized to those of the control group. n = 3-6 in each group. C Western blots and quantification for CD86, CD16, iNOS, and β-actin in the striatum of BCCAO and control rats at day 7, 14, and 28 after surgery. n = 3 in each group. D Representative images and quantification of reactive microglia (CD86+ cells, red) in the striatum of BCCAO and control rats. n = 3-4 animals in each group. Scale bar=50 μm. The data are shown as the mean ± SD. ***, p< 0.001; **, p< 0.01; *, p< 0.05; NS, not significant; the BCCAO group vs. control group.
Figure 3
Figure 3
Microglia redistribute and phagocytose myelin in the striatum of BCCAO rats. A Representative images and quantification of the proportion of microglia cells (Iba-1+ cells, red) adhered to myelin (MBP+, green) relative to the number of myelin fibers in the striatum of control and BCCAO rats. Scale bar=50 μm. B CLARITY analysis of 500-μm-thick rat brain slice co-stained with Iba-1 and MBP in control and BCCAO rat at day 14 after surgery. The volumes of representative 3D visualization are 309 μm×309 μm×200 μm, with a voxel size of 1.01 μm×1.01 μm×1.00 μm. Scale bar=100 μm. C Triple immunostaining and quantification of reactive (CD86+ cells, red) and phagocytic microglia cells (CD68+ cells, indigo) adhered to myelin (MBP+, green) in the striatum of control and BCCAO rats at day 7, 14, and 28 after surgery. Images at the bottom are magnified views of the areas in the upper of the images. Scale bar=50 μm for images at the top, Scale bar=10 μm for images at the bottom. n = 3-4 animals in each group. The data are shown as the mean ± SD. **, p< 0.01; *, p< 0.05; NS, not significant; the BCCAO group vs. control group.
Figure 4
Figure 4
Activation of complement C3-C3aR/ITGAM pathway in BCCAO rats. A Quantitative RT-PCR analysis of the expression of C1qa, C1qb, C4b, C3, C3ar, and Itgam in the striatum of control and BCCAO rats at day 7, 14, and 28 after BCCAO surgery. The values are normalized to those of the control group. n = 3-7 in each group. B Western blots and quantification for C3, C3aR, ITGAM, and β-actin in the striatum of control and BCCAO rats at day 7, 14, and 28 after surgery. C Representative images and quantification of complement C3 puncta (red) deposition on myelin (MBP+, green) in the striatum of BCCAO and control rats. n = 3-4 animals in each group at day 7, 14, and 28 after surgery. Scale bar=10 μm. The data are shown as the mean ± SD. ***, p< 0.001; **, p< 0.01; *, p< 0.05; NS, not significant; the BCCAO group vs. the control group.
Figure 5
Figure 5
Genetic deletion of C3ar1 attenuates microglia activation and reverses white matter injury in BCAS mice. A Representative images and quantification of C3aR (green) and Iba-1 (red) double-positive cells and microglia cells (Iba-1+ cells, red) in the striatum of WT, C3aR-KO, BCAS, and BCAS/C3aR-KO mice at day 28 after surgery. Scale bar=25 μm. B Western blots and quantification for CD86, iNOS, MBP and β-actin in the striatum of WT, C3aR-KO, BCAS, and BCAS/C3aR-KO mice at day 28 after surgery. C Representative images and quantification of damaged axon (SMI32+, red) relative to myelin (MBP+, green) and mature oligodendrocyte (APC+ cells, red) in the striatum of WT, C3aR-KO, BCAS, and BCAS/C3aR-KO mice at day 28 after surgery. Scale bar=50 μm. D Western blots of total- and phospho-STAT3 (pSTAT3) and β-actin in the striatum of WT, C3aR-KO, BCAS, and BCAS/C3aR-KO mice at day 28 after surgery. E and F Quantification of total STAT3/ β-actin (E) and phospho-STAT3/STAT3 (F) levels in the striatum of WT, C3aR-KO, BCAS, and BCAS/C3aR-KO mice at day 28 after surgery. The data are shown as the mean ± SD. n = 3-4 animals in each genotype group. ***, p< 0.001; **, p< 0.01; *, p< 0.05; NS, not significant.
Figure 6
Figure 6
C3aR inhibition suppresses microglial activation and microglia redistribution to myelin in BCCAO rats. A Western blots and quantification for CD86, iNOS, and β-actin in the striatum of the sham+vehicle, sham+C3aR antagonist, BCCAO+vehicle, and BCCAO+C3aR antagonist groups. n = 3-6 in each group. B Representative images of microglia cells (Iba-1+ cells, red) contacting with myelin (MBP+, green) in the striatum of sham+vehicle, sham+C3aR antagonist, BCCAO+vehicle, and BCCAO+C3aR antagonist groups. Scare bar=50 μm. n= 3-4 in each group. C-D Quantification of the proportion of microglia cells adhered to myelin relative to the number of myelin fibers (C) and the number of microglia cells (D). The data are shown as the mean ± SD. ***, p< 0.001; **, p< 0.01; *, p< 0.05; NS, not significant; the BCCAO group vs. control group. C3aRA: C3aR antagonist.
Figure 7
Figure 7
C3aR inhibition prevents behavioral deficits and white matter injury in BCCAO rats. A Five-day spatial learning performance measured as the latency to reach the platform in the Morris water maze test in sham+vehicle, sham+C3aR antagonist, BCCAO+vehicle, and BCCAO+C3aR antagonist groups. n= 12-15 animals for each group. B Spatial memory performance measured as the number of entries into the platform quadrant and the percentage of time spent in the platform quadrant in the Morris water maze test in the sham+vehicle, sham+C3aR antagonist, BCCAO+vehicle, and BCCAO+C3aR antagonist groups, n = 12-15 animals in each group. C Spatial memory performance measured as discrimination time in the new object recognition test in the sham+vehicle, sham+C3aR antagonist, BCCAO+vehicle, and BCCAO+C3aR antagonist groups. n = 4-6 animals for each group. D Western blots and quantification for myelin basic protein (MBP) and β-actin in the striatum of sham+vehicle, sham+C3aR antagonist, BCCAO+vehicle, and BCCAO+C3aR antagonist groups. E-F Representative images and quantification of damaged axon (SMI32+, red) relative to myelin (MBP+, green) (E) and mature oligodendrocyte (APC+ cells, red) (F) in the striatum of sham+vehicle, sham+C3aR antagonist, BCCAO+vehicle, and BCCAO+C3aR antagonist groups. n = 3-4 animals in each group. Scale bar=50 μm. The data are shown as the mean ± SD. **, p< 0.01; *, p< 0.05; the BCCAO group vs. control group. C3aRA: C3aR antagonist.

References

    1. Gorelick PB, Scuteri A, Black SE, Decarli C, Greenberg SM, Iadecola C. et al. Vascular contributions to cognitive impairment and dementia: a statement for healthcare professionals from the american heart association/american stroke association. Stroke. 2011;42:2672–713. - PMC - PubMed
    1. Iadecola C. The pathobiology of vascular dementia. Neuron. 2013;80:844–66. - PMC - PubMed
    1. O'Sullivan M, Lythgoe DJ, Pereira AC, Summers PE, Jarosz JM, Williams SC. et al. Patterns of cerebral blood flow reduction in patients with ischemic leukoaraiosis. Neurology. 2002;59:321–6. - PubMed
    1. Fernando MS, Simpson JE, Matthews F, Brayne C, Lewis CE, Barber R. et al. White matter lesions in an unselected cohort of the elderly: molecular pathology suggests origin from chronic hypoperfusion injury. Stroke. 2006;37:1391–8. - PubMed
    1. Ihara M, Polvikoski TM, Hall R, Slade JY, Perry RH, Oakley AE. et al. Quantification of myelin loss in frontal lobe white matter in vascular dementia, Alzheimer's disease, and dementia with Lewy bodies. Acta Neuropathol. 2010;119:579–89. - PMC - PubMed

Publication types

MeSH terms

Substances