. 2020 Jan 1;10(2):484-497.
doi: 10.7150/thno.38060. eCollection 2020.

A tumor suppressor enhancing module orchestrated by GATA4 denotes a therapeutic opportunity for GATA4 deficient HCC patients

Affiliations

A tumor suppressor enhancing module orchestrated by GATA4 denotes a therapeutic opportunity for GATA4 deficient HCC patients

Feng Lu et al. Theranostics. .

Abstract

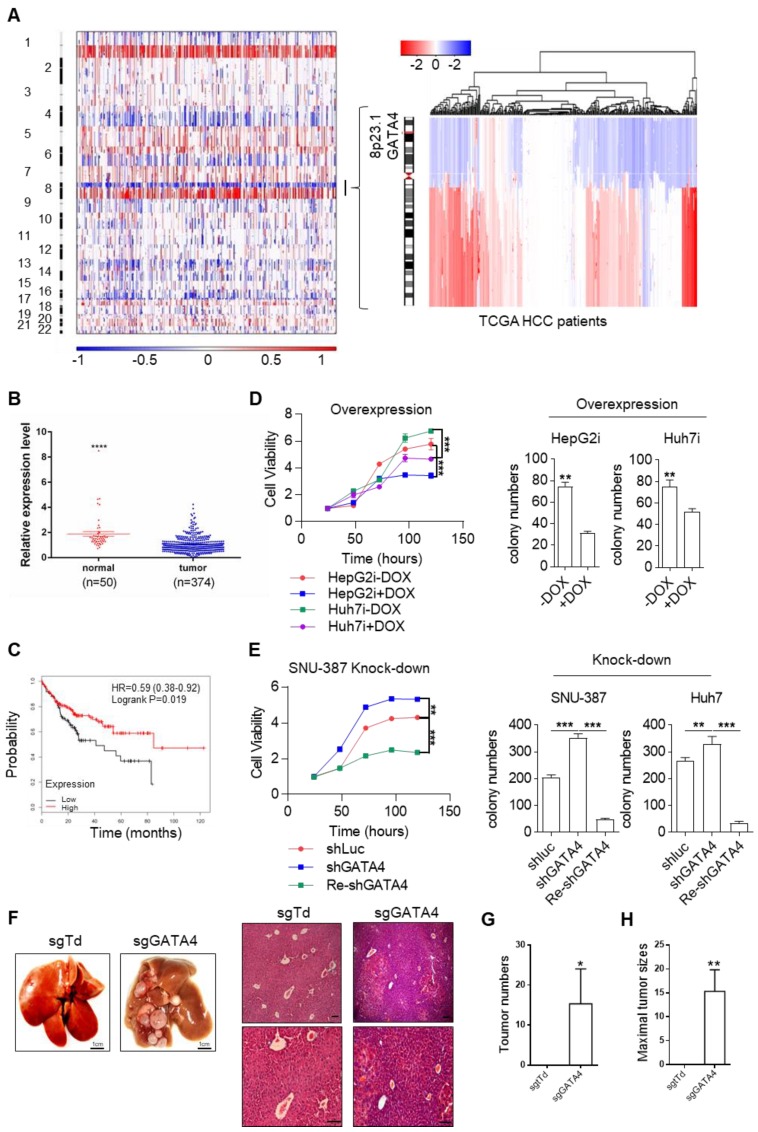
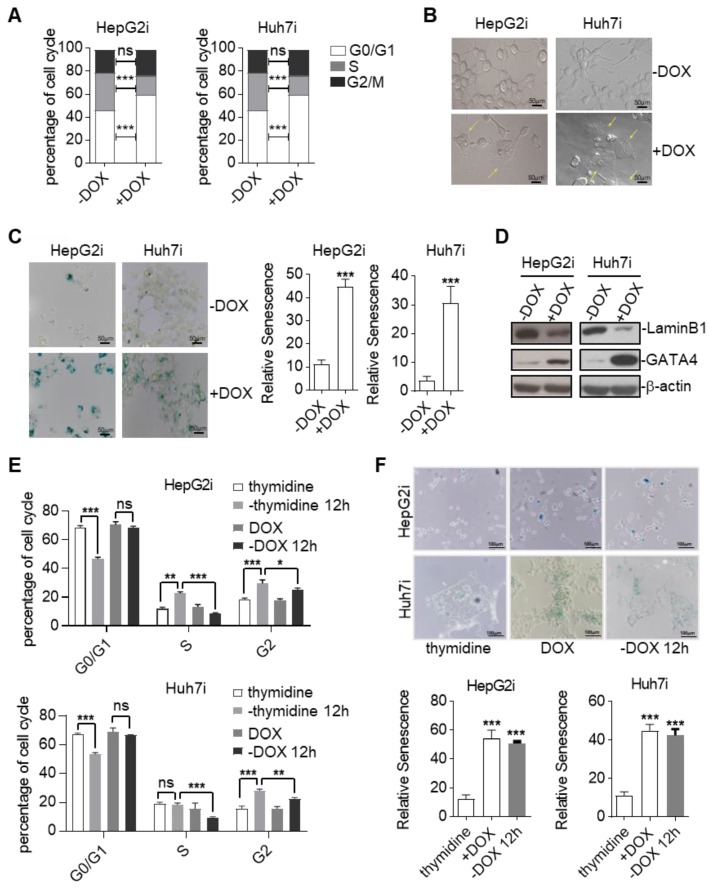
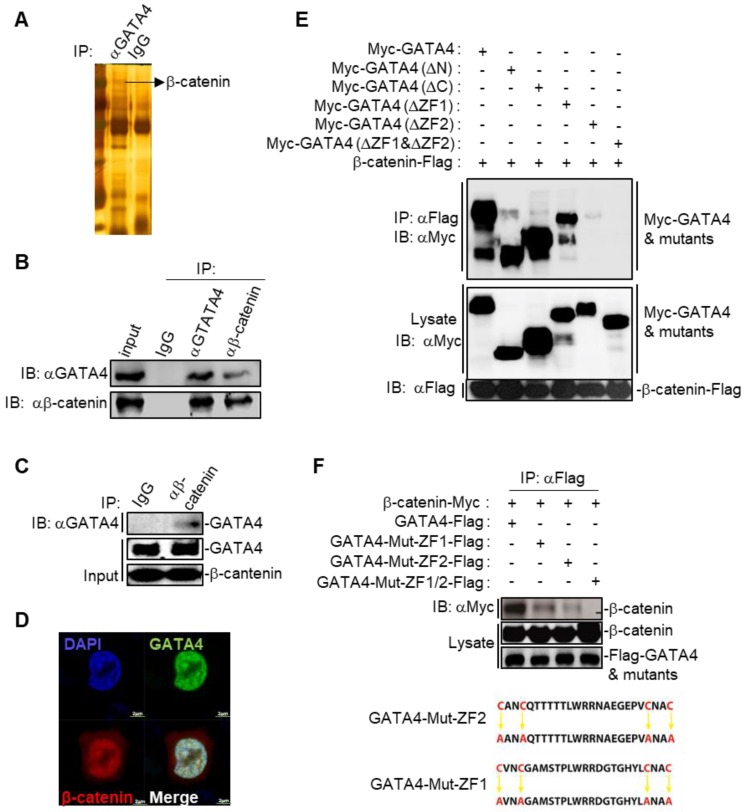
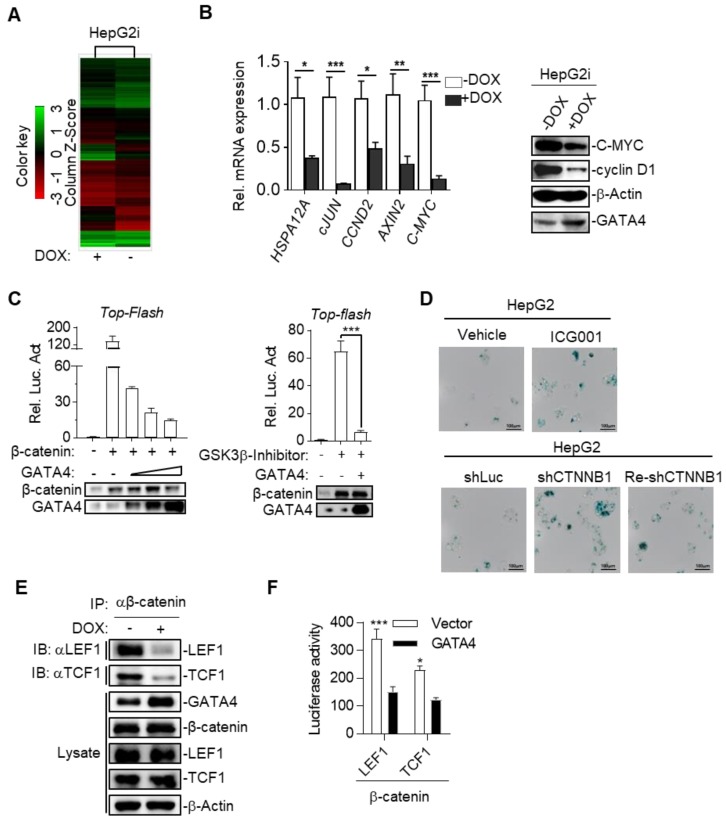
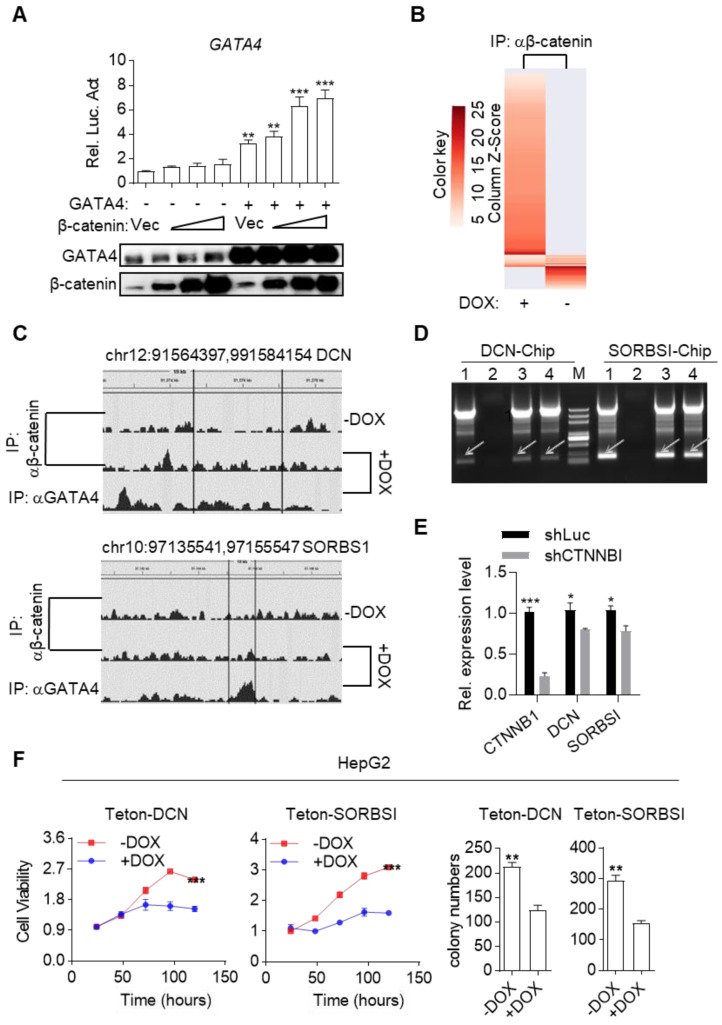
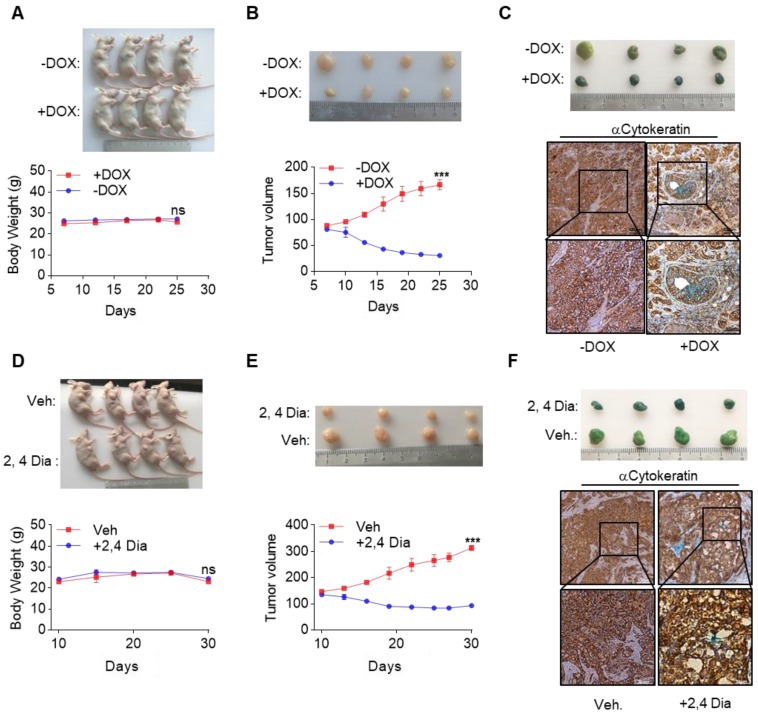
Rationale: Effective targeting therapies are limited in Hepatocellular carcinoma (HCC) clinic. Characterization of tumor suppressor genes (TSGs) and elucidation their signaling cascades could shed light on new strategies for developing targeting therapies for HCC. Methods: We checked genome-wide DNA copy number variation (CNV) of HCC samples, focusing on deleted genes for TSG candidates. Clinical data, in vitro and in vivo data were collected to validate the tumor suppressor functions. Results: Focal deletion of GATA4 gene locus was the most prominent feature across all liver cancer samples. Ectopic expression of GATA4 resulted in senescence of HCC cell lines. Mechanistically, GATA4 exerted tumor suppressive role by orchestrating the assembly of a tumor suppressor enhancing module: GATA4 directly bound and potently inhibited the mRNA transcription activity of β-catenin; meanwhile, β-catenin was recruited by GATA4 to promoter regions and facilitated transcription of GATA4 target genes, which were TSGs per se. Expression of GATA4 was effective to shrink GATA4-deficient HCC tumors in vivo. We also showed that β-catenin inhibitor was capable of shrinking GATA4-deficient tumors. Conclusions: Our study unveiled a previously unnoticed tumor suppressor enhancing module assembled by ectopically expressed GATA4 in HCC cells and denoted a therapeutic opportunity for GATA4 deficient HCC patients. Our study also presented an interesting case that an oncogenic transcription factor conditionally functioned as a tumor suppressor when recruited by a TSG transcription factor.

Keywords: GATA4; Hepatocellular carcinoma; Tumor suppressor gene; targeting therapy.


Conflict of interest statement

Competing Interests: The authors have declared that no competing interest exists.

Figures

Figure 1
Figure 1
GATA4 is a potent and clinically relevant tumor suppressor gene for HCC. (a) Heatmap representation of genomic distribution and frequencies of CNV regions on autosomes in HCC samples. Segmental gains (red) and losses (blue) disturbed alone the chromosomes (Y-axis) was plotted against HCC patients (X-axis). CNV data of 358 HCC patients were retrieved from TCGA (left) Focused analysis of CNV of GATA4 region in chromosome 8 of the same batch of HCC patients (right). (b) GATA4 mRNA expression in liver cancer tissue and paratumoral tissue among the HCC patients from TCGA. (c) K-M survival of liver cancer patient (male, All stage, n=246). (d) Left: GATA4 expression negatively affected cell viability. HCC cell lines engineered for DOX-inducible expression of GATA4 (HepG2i and Huh7i) were treated w/o DOX (1 mg/mL) for 48 hours. Cell viability was assayed at indicated time. Right: GATA4 inhibited colony forming ability of HepG2 (left) and Huh7 (right) cells. (e) Effects of GATA4 knockdown on liver cancer cell lines. Left: Viability of SNU387 cells harboring shLuciferase (shLuc), shGATA4 or SNU387 cells harboring shGTA4 transfected with PC3.1-GATA4 plasmid (Re-shGATA4) were assayed with CCK8 reagents for the indicated time points. Right: Colony formation statistics of SNU387 (left) and Huh7 (right) cells. (f) GATA4 knockout enhanced HCC formation in vivo. Kraslsl-G12D/+ mice were infected with virus for simultaneous expression of Cre and CRISPR targeting GATA4 or TdTomato (serving as negative control) in hepatocytes. Left: Livers of the mice were shown at 6 months after lentivirus infection (scale bar, 1 cm), Right: H&E staining of liver sections of indicated genotypes (scale bars, 100 mm). (g) Quantification of liver surface tumor nodules number in indicated groups. (h) Maximal tumor sizes (diameters) were measure. Data are representative of three independent experiments, and were analyzed by unpaired t-test. Error bars denote SD *P < 0.05; **P < 0.01; ***P < 0.001
Figure 2
Figure 2
Ectopic expression of GATA4 resulted in cellular senescence of HCC cell lines. (a) GATA4 induced cell cycle arrest at G0/G1 in liver cancer cell lines. Representative cell cycle distribution was shown for HepG2i (left) and Huh7i (right) treated with or without DOX (1 mg/mL, 48 hours). (b) Morphology of liver cancer cells expressing GATA4. HepG2i cells and Huh7i cells were treated with or without DOX (1 mg/mL) for 48 hours (scale bars, 50 mm). (c) Senescence-associated β-galactosidase staining. HepG2i cells and Huh7i cells were treated with or without DOX (1 mg/mL) for 48 hours. Left: representative staining, Right: statistics of the positive percentage of senescence cells, (scale bars, 100 mm). (d) GATA4 reduced nuclear LaminB1 expression in liver cancer cell lines. HepG2i cells and Huh7i cells (2×10⁶) were left untreated or treated with DOX for 48 hours. Lysates of the nuclear extracts (LaminB1) or whole cell lysates (GATA4 and b-actin) were analyzed by immunoblots with the indicated antibodies. (e) GATA4 expression led to stable arrest of liver cancer cells at G0/G1 phase. Logarithmic phase cells (2×10⁶) were treated with 2 mM of thymidine or 1 mg/mL of DOX for 48 hours, followed by culturing in drug-free media for another 12 hours. Cell cycle distribution was monitored through FACS analysis. (f) Senescence-associated β-galactosidase staining of cells in E. Upper: representative images. Lower: Statistics of the positive percentage of senescence cells (scale bars, 100 mm). Data are representative of three independent experiments, and were analyzed by unpaired t-test. Error bars denote SD. *P < 0.05; **P < 0.01; ***P < 0.001
Figure 3
Figure 3
GATA4 interacted and colocalized with b-catenin. (a) Silver-staining of SDS-PAGE separated protein samples immunoprecipitated with antibody targeting with GATA4 or control IgG. (b) Endogenous GATA4 interacted with b-catenin in HepG2 cells. Coimmunoprecipitation experiments were performed with anti-GATA4 or anti-b-catenin, and the immunoprecipitates and whole cell lysate (input) were analyzed by immunoblots with indicated antibodies. (c) GATA4 directly bound to b-catenin. In vitro GST pull-down assay indicating a direct interaction between GATA4 and b-catenin. (d) Colocalization of GATA4 and b-catenin. HepG2 cells (1×10⁶) were co-transfected with constructs encoding GATA-GFP and b-catenin-mCherry respectively and analyzed with confocal microscopy 24 hours later (scale bars, 2 mm ). (e & f) Domain mapping of GATA4-b-catenin association. The HEK293 cells (2×10⁶) were transfected with the indicated plasmids (5 mg each). Coimmunoprecipitation and immunoblot were performed with the indicated antibodies. Mutations of ZF domains of human GATA4 were detailed in diagram (lower panel, Figure 3F).
Figure 4
Figure 4
GATA4 inhibited canonical Wnt signaling by blocking β-catenin's recruitment of essential co-transcription factors. (a) Heatmap representation of the mRNA expression level between HepG2i cells treated with or without DOX. (b) GATA4 expression inhibited canonical Wnt signaling pathway. RNA was extracted from HepG2i treated w/o DOX (1 mg/mL) for 48 hours. Expression of the indicated genes was quantified through qPCR (left) or immunoblot analysis (right). (c) GATA4 inhibited transcriptional activity of b-catenin. Left: HEK 293 cells (1×10⁵) were transfected with the Top-Flash reporter plasmid (0.1 mg) and b-catenin expression plasmid(0.1 mg )together with increased amounts of GATA4 expression plasmid (0.05, 0.1, 0.2 mg), followed by monitoring luciferase 24 hours later. Right: HepG2 cells (1×10⁵) were transfected with the Top-Flash reporter plasmid and GATA4 expression plasmid. Cells were then left treated w/o GSK3b-Inhibitor for 12 hours before luciferase assays were performed. (d) Upper: Senescence-associated β-galactosidase staining of ICG001 and Vehicle treated HepG2 cells. HepG2 cells were treated w/o b-catenin inhibitor, ICG001 (0.1 mg/mL) for 48 hours. Lower: Senescence-associated β-galactosidase staining of HepG2 cells which harboring shLuciferase (shLuc), shCTNNB1 or HepG2 cells harboring shCTNNB1 transfected with PC3.1-CTNNB1 plasmid (Re-shCTNNB1), Scale bars:100mm. (e) GATA4 suppressed the interaction between b-catenin and LEF1/TCF1. HepG2i cells (5×10⁷) were treated w/o DOX for 48 hours followed by immunoprecipitation with anti-b-catenin antibody. The immunoprecipitants and whole cell lysate were analyzed by immunoblots with indicated antibodies. (f) Bimolecular fluorescence complementation assay determining the impact of GATA4 on interaction between b-catenin and LEF1 or TCF1. HEK 293 cells (1×10⁵) were transfected with the b-catenin-N-luciferase plasmid (b-catenin, 0.1 mg) and LEF1-C-luciferase (LEF1, 0.1 mg) or TCF1-C-luciferase (TCF1, 0.1 mg). Luciferase assays were performed 24 hours after transfection. Data are representative of three independent experiments, and were analyzed by unpaired t-test. Error bars denote SD. *P < 0.05; **P < 0.01; ***P < 0.001
Figure 5
Figure 5
GATA4 assembled a tumor suppressor enhancing module between itself and β-catenin. (a) b-catenin enhances GATA4 transcriptional activity in a dose-dependent manner. HEK 293 cells (1×10⁵) were transfected with the GATA4 reporter plasmid (0.1 mg) and increased amounts of b-catenin expression plasmid (0.05, 0.1, 0.2 mg) together w/o GATA4 expression plasmid(0.2 mg). Luciferase was monitored 24 hours later. (b) ChIP-seq result of DNA fragments enriched with antibody targeting b-catenin from HepG2i cells cultured w/o DOX. (c) b-catenin was recruited to GATA4 chromosome binding site. HepG2 cells (1.6×10⁸) were treated w/o DOX (1 mg/mL) treatment. ChIP-Seq was conducted on DNA samples enriched with indicated antibodies from indicated cells. (d) b-catenin bound promoter region of DCN and SORSBI genes in the presence of GATA4. 1: input, 2: b- catenin enriched DNA elements in HepG2i cells in absence of DOX, 3: b-catenin enriched DNA elements in HepG2i cells in the presence of DOX, 4: GATA4 enriched DNA elements in HepG2i cells in the presence of DOX. (e) β-catenin promoted GATA4 to transcribe DCN and SORBS1 expression. CTNNB1, DCN and SORBS1 mRNA level in DOX treated HepG2i cells after transfected with shRNA-luc or shRNA-CTNNB1. (f) DCN and SORSBI inhibited cell proliferation. HepG2-Teton-DCN and HepG2-Teton-SORBS1 cells were treated w/o DOX (1 mg/mL) for indicated time points followed by monitoring viability with CCK-8 reagents (Left) and statistics of colony formation (Right). Data are representative of three independent experiments, and were analyzed by unpaired t-test. Error bars denote SD. *P < 0.05; **P < 0.01; ***P < 0.001
Figure 6
Figure 6
GATA4 deficiency denotes an opportunity for therapeutic intervention of HCC. (a & b) GATA4 expression shrank HepG2 xenografted tumors. Four mice in each group were treated according to schedules outlined in (Figure S6A). Picture of the mice were shown in upper panel. Body weight of the mice was recorded every 5 days and graphed in lower panel. Tumor growth was recorded every 2 days by measuring its diameter with Vernier caliper in the mice detailed in (a). Tumor volume was calculated by tumor volume (mm3) = D×d2/2, where D is the longest and d is the shortest diameter respectively (b). (c) GATA4 promoted cell senescence in tumor. b-galactosidase staining was conducted on tumors collected from the mice treated w/o DOX food. The stained tumor nodules were subjected to IHC staining with Cytokeratin (AE1/AE3) antibody (scale bars:100mm). (d & e) 2,4 Dia treatment shrank HepG2 xenografted tumors. Four mice in each group were treated according to schedules outlined in (Figure S6B), picture of the mice shown in upper panel. Body weight of the mice was recorded every 5 days and graphed in lower panel (d). Tumor growth was recorded every 3 days (e). (f) 2,4 Dia treatment resulted in senescence of cells of HepG2 xenografted tumors. b-galactosidase staining was conducted on tumors collected from the mice treated with 2,4 Dia or Vehicle. The stained tumor nodules were subjected to IHC staining with Cytokeratin (AE1/AE3) antibody (scale bars:100mm). Data are representative of three independent experiments, and were analyzed by unpaired t-test. Error bars denote SD. *P < 0.05; **P < 0.01; ***P < 0.001

References

    1. Siegel RL, Miller KD, Jemal A. Cancer Statistics, 2017. CA Cancer J Clin. 2017;67:7–30. - PubMed
    1. Ghouri YA, Mian I, Rowe JH. Review of hepatocellular carcinoma: Epidemiology, etiology, and carcinogenesis. J Carcinog. 2017;16:1. - PMC - PubMed
    1. Zhou M, Wang H, Zhu J, Chen W, Wang L, Liu S. et al. Cause-specific mortality for 240 causes in China during 1990-2013: a systematic subnational analysis for the Global Burden of Disease Study 2013. Lancet. 2016;387:251–72. - PubMed
    1. Kew MC. Epidemiology of hepatocellular carcinoma in sub-Saharan Africa. Ann Hepatol. 2013;12:173–82. - PubMed
    1. Ma LJ, Feng FL, Dong LQ, Zhang Z, Duan M, Liu LZ. et al. Clinical significance of PD-1/PD-Ls gene amplification and overexpression in patients with hepatocellular carcinoma. Theranostics. 2018;8:5690–702. - PMC - PubMed

Publication types

MeSH terms