

Large Scale Fabrication of Ordered Gold Nanoparticle-Epoxy Surface Nanocomposites and Their Application as Label-Free Plasmonic DNA Biosensors
- PMID: 31904921
- PMCID: PMC7307838
- DOI: 10.1021/acsami.9b20907
Large Scale Fabrication of Ordered Gold Nanoparticle-Epoxy Surface Nanocomposites and Their Application as Label-Free Plasmonic DNA Biosensors
Abstract
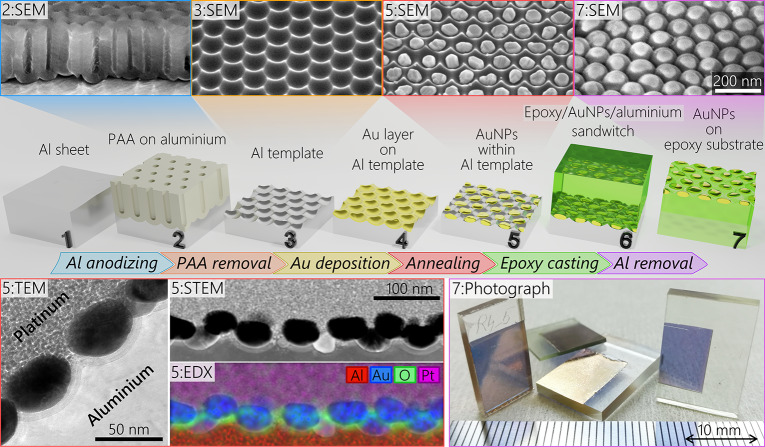
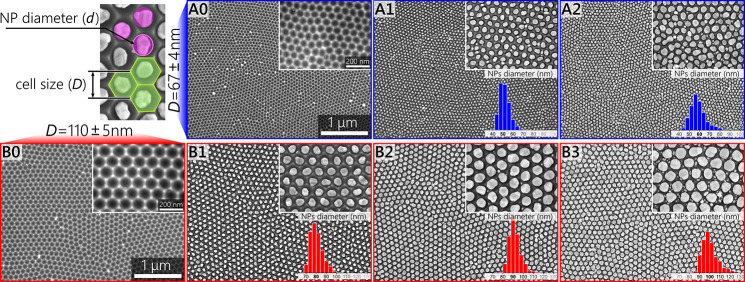
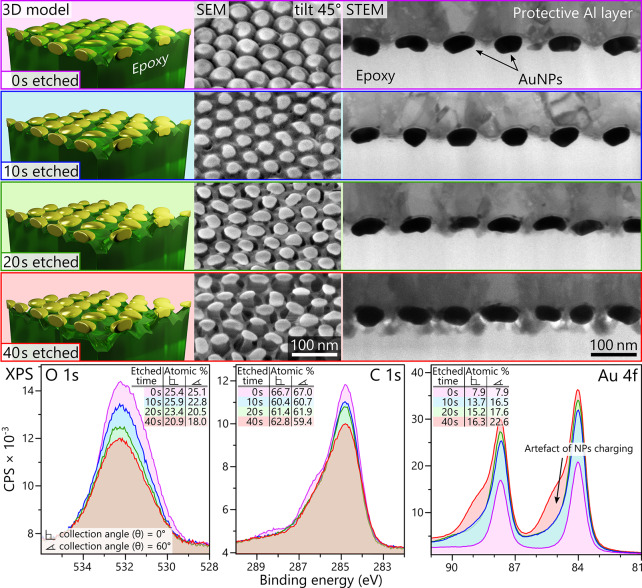
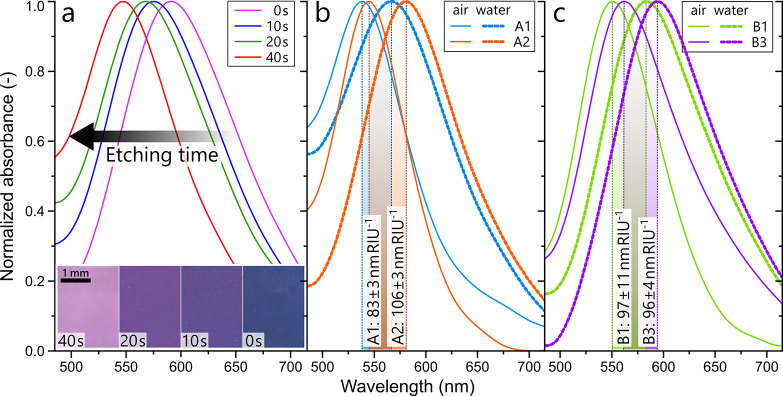
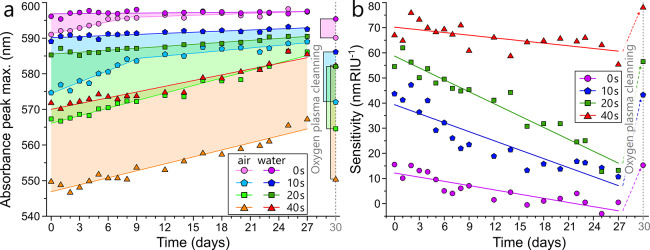
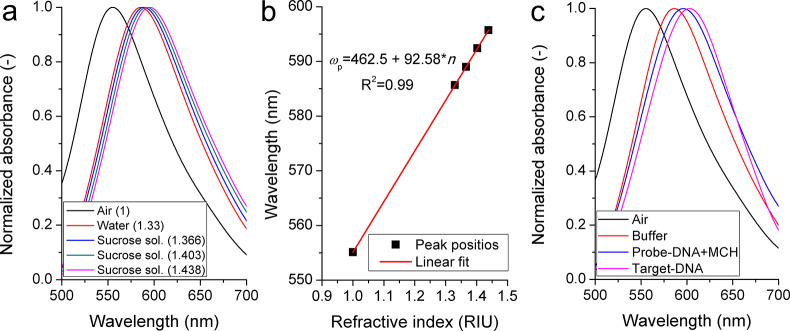
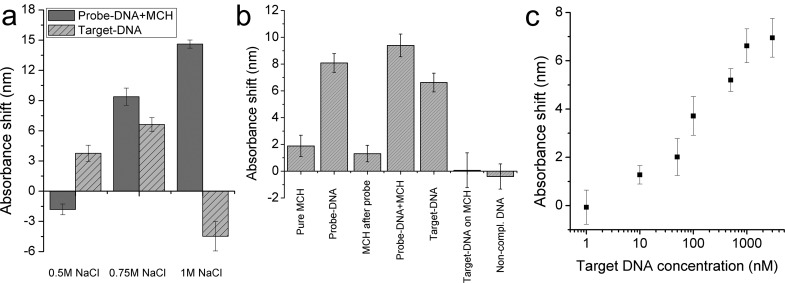
A robust and scalable technology to fabricate ordered gold nanoparticle arrangements on epoxy substrates is presented. The nanoparticles are synthesized by solid-state dewetting on nanobowled aluminum templates, which are prepared by the selective chemical etching of porous anodic alumina (PAA) grown on an aluminum sheet with controlled anodic oxidation. This flexible fabrication technology provides proper control over the nanoparticle size, shape, and interparticle distance over a large surface area (several cm2), which enables the fine-tuning and optimization of their plasmonic absorption spectra for LSPR and SERS applications between 535 and 625 nm. The nanoparticles are transferred to the surface of epoxy substrates, which are subsequently selectively etched. The resulting nanomushrooms arrangements consist of ordered epoxy nanopillars with flat, disk-shaped nanoparticles on top, and their bulk refractive index sensitivity is between 83 and 108 nm RIU-1. Label-free DNA detection is successfully demonstrated with the sensors by using a 20 base pair long specific DNA sequence from the parasite Giardia lamblia. A red-shift of 6.6 nm in the LSPR absorbance spectrum was detected after the 2 h hybridization with 1 μM target DNA, and the achievable LOD was around 5 nM. The reported plasmonic sensor is one of the first surface AuNP/polymer nanocomposites ever reported for the successful label-free detection of DNA.
Keywords: DNA biosensor; localized surface plasmon resonance; nanobowled aluminum; nanoparticle lattice; surface nanocomposite.
Conflict of interest statement
The authors declare no competing financial interest.
Figures
Similar articles
-
Plasmonic fluorescent nanocomposites of cyanines self-assembled upon gold nanoparticle scaffolds.Anal Sci. 2012;28(5):433-8. doi: 10.2116/analsci.28.433. Anal Sci. 2012. PMID: 22687920
-
A wavelength-modulated localized surface plasmon resonance (LSPR) optical fiber sensor for sensitive detection of mercury(II) ion by gold nanoparticles-DNA conjugates.Biosens Bioelectron. 2018 Aug 30;114:15-21. doi: 10.1016/j.bios.2018.05.004. Epub 2018 May 8. Biosens Bioelectron. 2018. PMID: 29775854
-
Fabrication of gold nanoparticle-embedded metal-organic framework for highly sensitive surface-enhanced Raman scattering detection.Anal Chem. 2014 Apr 15;86(8):3955-63. doi: 10.1021/ac5002355. Epub 2014 Mar 27. Anal Chem. 2014. PMID: 24646316
-
Plasmonic nanocomposites: polymer-guided strategies for assembling metal nanoparticles.Nanoscale. 2013 Jul 7;5(13):5677-91. doi: 10.1039/c3nr01091k. Epub 2013 May 24. Nanoscale. 2013. PMID: 23703218 Review.
-
Surface-enhanced Raman scattering: realization of localized surface plasmon resonance using unique substrates and methods.Anal Bioanal Chem. 2009 Aug;394(7):1747-60. doi: 10.1007/s00216-009-2762-4. Epub 2009 Apr 22. Anal Bioanal Chem. 2009. PMID: 19384546 Review.
Cited by
-
Nucleotide detection mechanism and comparison based on low-dimensional materials: A review.Front Bioeng Biotechnol. 2023 Mar 2;11:1117871. doi: 10.3389/fbioe.2023.1117871. eCollection 2023. Front Bioeng Biotechnol. 2023. PMID: 36937765 Free PMC article. Review.
-
Effect of Gold Nanoparticles on the Physical Properties of an Epoxy Resin.Int J Mol Sci. 2023 Mar 15;24(6):5638. doi: 10.3390/ijms24065638. Int J Mol Sci. 2023. PMID: 36982711 Free PMC article.
-
Enhanced detection sensitivity through enzyme-induced precipitate accumulation in LSPR-active nano-valleys.RSC Adv. 2022 May 23;12(25):15652-15657. doi: 10.1039/d2ra01331b. eCollection 2022 May 23. RSC Adv. 2022. PMID: 35685716 Free PMC article.
-
Nanoscale goldbeating: Solid-state transformation of 0D and 1D gold nanoparticles to anisotropic 2D morphologies.PNAS Nexus. 2023 Aug 18;2(8):pgad267. doi: 10.1093/pnasnexus/pgad267. eCollection 2023 Aug. PNAS Nexus. 2023. PMID: 37621403 Free PMC article.
-
New Parameter for Benchmarking Plasmonic Gas Sensors Demonstrated with Densely Packed Au Nanoparticle Layers.ACS Appl Mater Interfaces. 2024 Oct 23;16(42):57832-57842. doi: 10.1021/acsami.4c11102. Epub 2024 Oct 14. ACS Appl Mater Interfaces. 2024. PMID: 39399975 Free PMC article.
References
-
- Liedberg B.; Nylander C.; Lunström I. Surface Plasmon Resonance for Gas Detection and Biosensing. Sens. Actuators 1983, 4 (C), 299–304. 10.1016/0250-6874(83)85036-7. - DOI
-
- Wong C. L.; Olivo M. Surface Plasmon Resonance Imaging Sensors: A Review. Plasmonics 2014, 9 (4), 809–824. 10.1007/s11468-013-9662-3. - DOI
-
- Chinowsky T. M.; Quinn J. G.; Bartholomew D. U.; Kaiser R.; Elkind J. L. Performance of the Spreeta 2000 Integrated Surface Plasmon Resonance Affinity Sensor. Sens. Actuators, B 2003, 91 (1–3), 266–274. 10.1016/S0925-4005(03)00113-8. - DOI
MeSH terms
Substances
LinkOut - more resources
Full Text Sources
Miscellaneous
