. 2020 Sep;22(9):645-650.
doi: 10.1089/dia.2019.0393.

HbA1c Levels in Type 1 Diabetes from Early Childhood to Older Adults: A Deeper Dive into the Influence of Technology and Socioeconomic Status on HbA1c in the T1D Exchange Clinic Registry Findings

Affiliations

HbA1c Levels in Type 1 Diabetes from Early Childhood to Older Adults: A Deeper Dive into the Influence of Technology and Socioeconomic Status on HbA1c in the T1D Exchange Clinic Registry Findings

Kellee M Miller et al. Diabetes Technol Ther. 2020 Sep.

Abstract

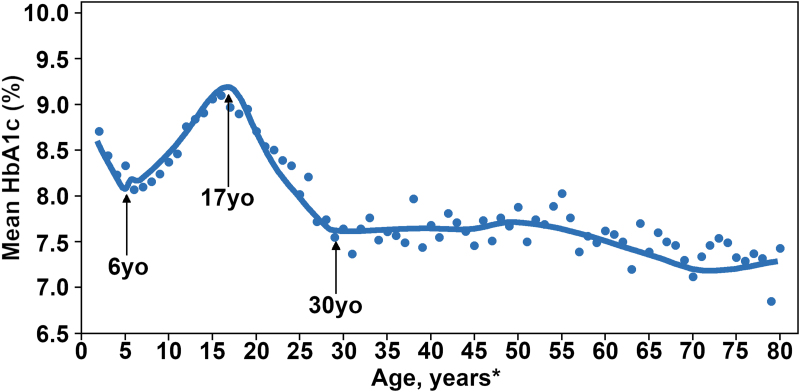
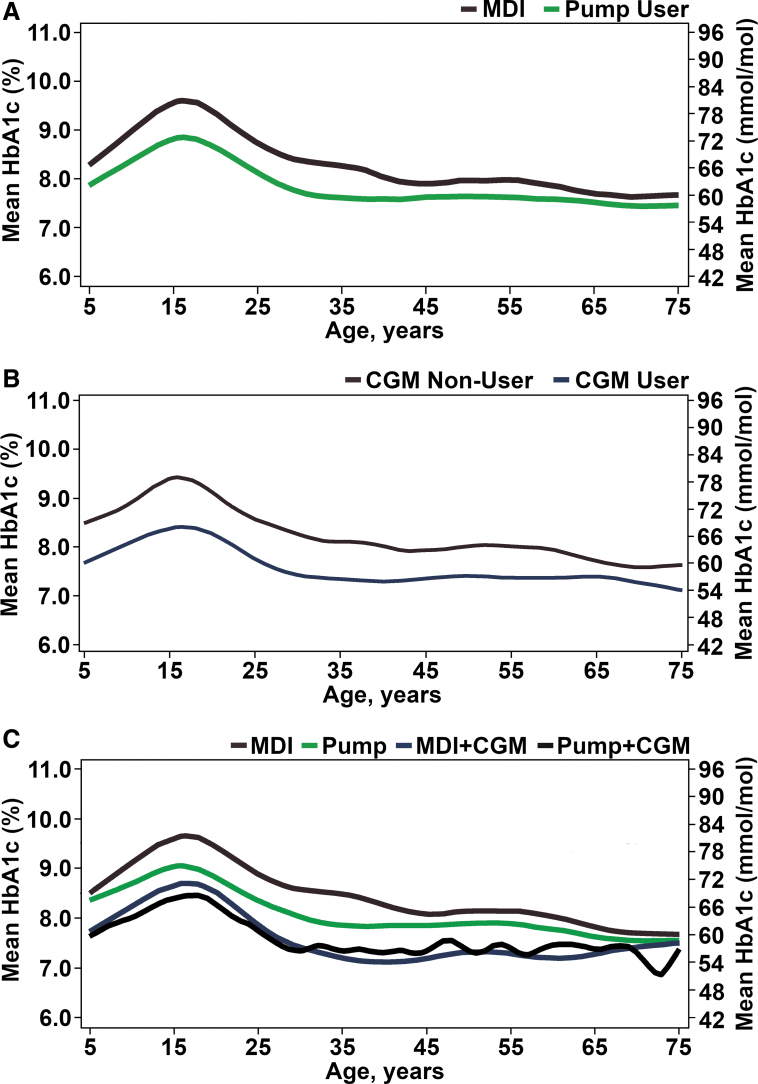
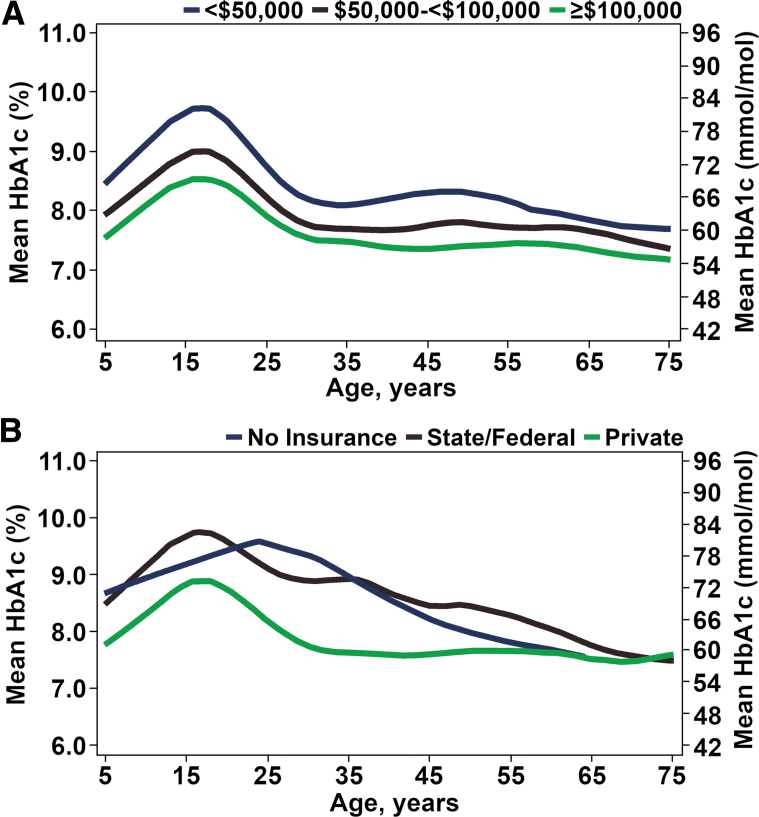
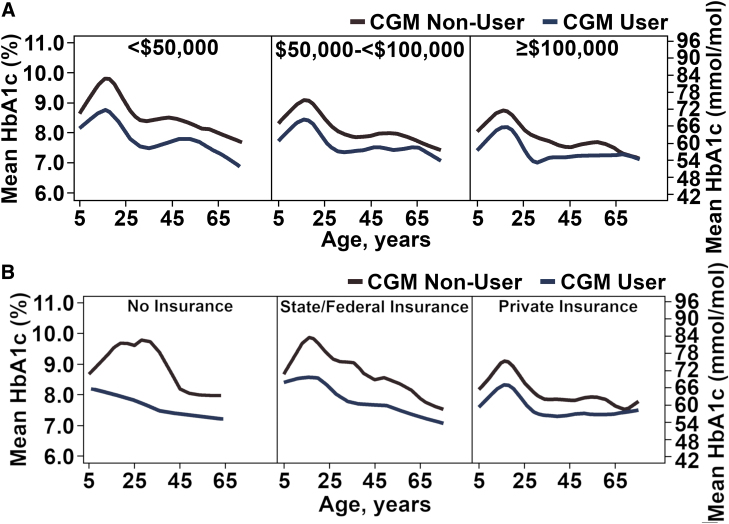
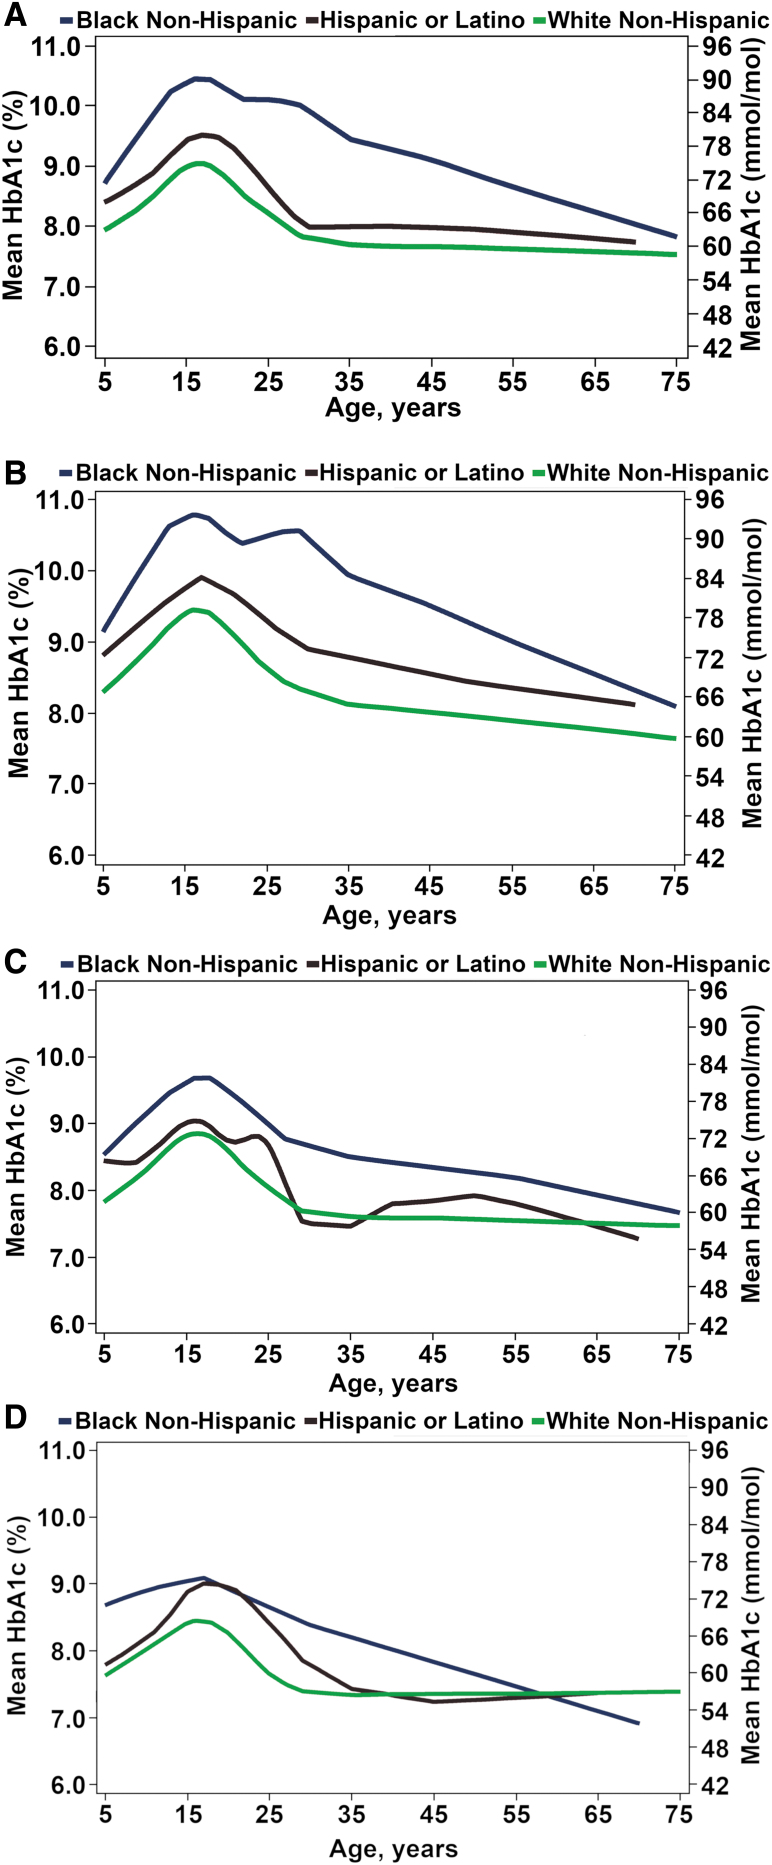
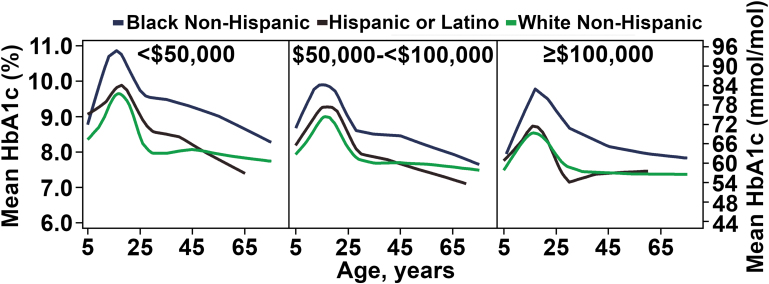
Objective: The T1D Exchange Clinic Registry figure of HbA1c levels according to age has become a classic picture of how average HbA1c varies from childhood to elderly. To further assess the course of HbA1c across the life span in T1D, we created similar figures stratified by device use and socioeconomic status (SES). Methods: Mean HbA1c was plotted versus age for 21,253 T1D Exchange Clinic Registry participants with an HbA1c measurement between January 1, 2016 and March 31, 2018 according to device use, race/ethnicity, and measures of SES. Results: Across the age range from childhood to elderly, continuous glucose monitoring (CGM) use without an insulin pump had better average HbA1c than pump without CGM; and among CGM users, pump and injection users had similar HbA1c levels. Any device use (pump or CGM) was associated with better HbA1c levels than no device use across the age range. Lower SES and African American race were associated with higher HbA1c across the age range. Across all device use, SES, and race/ethnicity factors, average HbA1c levels were highest in adolescents and young adults. Conclusion: Although the plot of average HbA1c from early childhood to elderly shifts according to device use and SES factors, the shape of the plots remains reasonably constant with highest HbA1c levels in adolescents and young adults. These findings emphasize the importance of targeting adolescence and early adulthood as the ages with the greatest need for improving diabetes management irrespective of device use and SES.

Keywords: HbA1c; T1D Exchange; Type 1 diabetes.


Conflict of interest statement

No competing financial interests exist.

Figures

FIG. 1.
FIG. 1.
Average A1c from early childhood to elderly in T1D exchange (N = 15,881). *≥80 Years old participants are pooled.
FIG. 2.
FIG. 2.
(A) Average A1c from early childhood to elderly by technology use: insulin delivery method. Solid red line represents multiple daily injection (N = 5006). Solid green line represents pump users (N = 6025). (B) Average A1c from early childhood to elderly by technology use: continuous glucose monitor (N = 15,418). Solid red line represents CGM nonuser (N = 11,199). Solid blue line represents CGM user (N = 4219). (C) Average A1c from early childhood to elderly by technology use: insulin delivery method and continuous glucose monitoring (N = 15,187). Solid red line represents multiple daily injection (N = 5006). Solid green line represents insulin pump (N = 6025). Solid blue line represents multiple daily injection and CGM use (N = 649). Solid black line represents pump and CGM use (N = 3507). CGM, continuous glucose monitor.
FIG. 3.
FIG. 3.
(A) Average A1c from early childhood to elderly by SES: income (N = 11,438). Solid blue line represents <$50,000 (N = 3659). Solid red line represents $50,000 to <$100,000 (N = 1850). Solid green line represents ≥$100,000 (N = 5959). (B) Average A1c from early childhood to elderly by SES: insurance status (N = 15,001). Solid blue line represents no insurance (N = 176). Solid red line represents state/federal insurance (N = 3786). Solid green line represents private insurance (N = 11,039). SES, socioeconomic status.
FIG. 4.
FIG. 4.
(A) Average A1c from early childhood to elderly by household income and CGM use (N = 11,101). Solid red line represents CGM nonuser (N = 7903). Solid blue line represent CGM user (N = 3198). (B) Average A1c from early childhood to elderly by insurance status and CGM use (N = 14,596). Solid red line represents CGM nonuser (N = 10,541). Solid blue line represents CGM user (N = 4055).
FIG. 5.
FIG. 5.
(A) Average A1c from early childhood to elderly by race/ethnicity (N = 15,780). Solid blue line represents black non-Hispanic (N = 942). Solid red line represents Hispanic or Latino (N = 1664). Solid green line represents white non-Hispanic (N = 12,339). (B) Average A1c from early childhood to elderly by race/ethnicity and technology use: no pump or CGM (N = 10,491). Solid blue line represents black non-Hispanic (N = 840). Solid red line represents Hispanic or Latino (N = 1319). Solid green line represents white non-Hispanic (N = 8332). (C) Average A1c from early childhood to elderly by race/ethnicity and technology use: pump users (N = 4668). Solid blue line represents black non-Hispanic (N = 587). Solid red line represents Hispanic or Latino (N = 742). Solid green line represents white non-Hispanic (N = 3339). (D) Average A1c from early childhood to elderly by race/ethnicity and technology use: CGM users (N = 4081). Solid blue line represents black non-Hispanic (N = 73). Solid red line represents Hispanic or Latino (N = 304). Solid green line represents white non-Hispanic (N = 3641).
FIG. 6.
FIG. 6.
Average A1c from early childhood to elderly by race/ethnicity and annual household income (N = 15,418). Solid blue line represents black non-Hispanic (N = 586). Solid red line represents Hispanic or Latino (N = 1088). Solid green line represents white non-Hispanic (N = 8835).

References

    1. Beck RW, Tamborlane WV, Bergenstal RM, et al. : The T1D exchange clinic registry. J Clin Endocrinol Metab 2012;97:4383–4389 - PubMed
    1. Foster NC, Beck RW, Miller KM, et al. : State of type 1 diabetes management and outcomes from the T1D exchange in 2016–2018. Diabetes Technol Ther 2019;21:66–72 - PMC - PubMed
    1. Miller KM, Foster NC, Beck RW, et al. : Current state of type 1 diabetes treatment in the U.S.: updated data from the T1D exchange clinic registry. Diabetes Care 2015;38:971–978 - PubMed
    1. Blackman SM, Raghinaru D, Adi S, et al. : Insulin pump use in young children in the T1D exchange clinic registry is associated with lower hemoglobin A1c levels than injection therapy. Pediatr Diabetes 2014;15:564–572 - PubMed
    1. Rodbard D: State of type 1 diabetes care in the United States in 2016–2018 from T1D exchange registry data. Diabetes Technol Ther 2019;21:62–65 - PMC - PubMed

Publication types