. 2020 Feb;578(7795):472-476.
doi: 10.1038/s41586-019-1910-z. Epub 2020 Jan 6.

The structural basis for cohesin-CTCF-anchored loops

Affiliations

The structural basis for cohesin-CTCF-anchored loops

Yan Li et al. Nature. 2020 Feb.

Abstract

Cohesin catalyses the folding of the genome into loops that are anchored by CTCF1. The molecular mechanism of how cohesin and CTCF structure the 3D genome has remained unclear. Here we show that a segment within the CTCF N terminus interacts with the SA2-SCC1 subunits of human cohesin. We report a crystal structure of SA2-SCC1 in complex with CTCF at a resolution of 2.7 Å, which reveals the molecular basis of the interaction. We demonstrate that this interaction is specifically required for CTCF-anchored loops and contributes to the positioning of cohesin at CTCF binding sites. A similar motif is present in a number of established and newly identified cohesin ligands, including the cohesin release factor WAPL2,3. Our data suggest that CTCF enables the formation of chromatin loops by protecting cohesin against loop release. These results provide fundamental insights into the molecular mechanism that enables the dynamic regulation of chromatin folding by cohesin and CTCF.


Conflict of interest statement

Competing Interests The authors declare no competing interests

Figures

Extended Data Figure 1
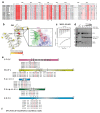
Extended Data Figure 1. Biochemical analysis of CTCF binding to SA2-SCC1.
a, Domain architecture of CTCF. CTCF fragments tested for SA2-SCC1 binding by GST pulldown analysis are indicated. The region retaining SA2-SCC1 is highlighted in magenta. b, Summary data showing results of GST pulldowns. The input (I) and the bound (B) fractions were analysed by SDS-PAGE. CTCF fragments that bind SA2-SCC1 are shown in magenta. The experiment was repeated once. c, ITC curves. The binding stoichiometry (N) and dissociation constants Kd are indicated. The experiment was repeated three times with consistency. d, Fo-Fc omit electron density Fourier map contoured at 3 Sigma. e, LIGPLOT representation of the interaction between the CTCF peptide and SA2-SCC1. The CTCF peptide is shown in magenta, SA2 in blue and SCC1 in green bonds.
Extended Data Figure 2
Extended Data Figure 2. Analysis of the SA2-SCC1-CTCF structure.
a, Multiple sequence alignment of SA2 (STAG2) orthologs and paralogs. The key amino acid residues engaging CTCF are indicated by (*). b, Missense mutation frequencies plotted onto the SA2 structure. R370, a hotspot in SA2, is indicated. The inset shows an overview of mutation hotspots R370 (SA2), Y226, F228 (CTCF) and S334, K335, R338, L341 (SCC1). c, ITC progress curves of binding between WAPL 423-463 and SA2-SCC1. d, Competition between SGO1 and CTCF for SA2-SCC1 binding. SA2-SCC1 was incubated with GST-CTCF 86-267. Increasing amounts (lanes 4-8; molar ratios are indicated) of T346-phosphorylated SGO1 peptide spanning 331-349 were added and the input (I) and the bound (B) fraction analysed by SDS-PAGE. The experiment was repeated twice. One representative example is shown. c, Domain architecture and sequence alignments of cohesin regulators containing F/YxF motifs. Putative CES interacting residues are highlighted in red. d, Regular expression motif used to query the human and yeast proteomes for F/YxF-containing factors. Regular expression syntax: letters denote a specific amino acid; square brackets denote a subset of allowed amino acids; curly brackets denote length variability.
Extended Data Figure 3
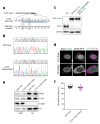
Extended Data Figure 3. Generation of CTCF Y226A F228A cells.
a, Schematic depiction of CRISPR-Cas9 based generation of CTCF Y226A F228A cells. The guide targets cleavage of exon 1 of the CTCF gene. The repair oligo renders the gene non-cleavable by Cas9, and simultaneously introduces mutations in the codons encoding Y226 and F228. b, The CTCF Y226A F228A mutation was confirmed by Sanger sequencing, including a silent mutation at position 229. c, Western blot depicting Halo-tagged SCC1 in wild type and CTCF Y226A F228A cells. The parental wild type cells are included as a control. This experiment was performed once. d, Representative images of cells in G1 and G2, as indicated by their nuclear and cytoplasmic localization of DHB-iRFP respectively. e, Chromatin bound levels of CTCF and SMC1 analyzed by Western Blot. Histone H4 is used as a control for the chromatin fraction. CTCF Y226A F228A mutation does not evidently affect overall CTCF and cohesin levels on chromatin. WCE: whole-cell extract, CB: chromatin bound fraction. This experiment was performed twice with similar results. f, Relative SCC1-Halo fluorescence intensity quantified in the unbleached area directly after photobleaching, as a proxy for the chromatin-bound fraction of SCC1. This non-diffusive fraction is not evidently affected by the CTCF Y226A F228A mutation. Individual cells of three independent experiments are plotted as dots and their mean is indicated (21 wild type cells and 17 CTCF Y226A F228A cells were scored).
Extended Data Figure 4
Extended Data Figure 4. TAD analyses and Hi-C replicates.
a, Schematic depiction of a Hi-C matrix displaying DNA-DNA contacts across a genomic region that includes two TADs. TADs in general are flanked by inwards-pointing CTCF sites (magenta arrows). Signal close to the diagonal line reflects short-range contacts, and contacts spanning longer distances are found further away from the diagonal. The contacts within a TAD are formed by cohesin complexes (blue circles). Cohesin builds loops that it can enlarge until it encounters CTCF. Some TADs are enriched for contacts between the two CTCF sites that lie at their boundaries. These contacts are referred to as CTCF-anchored loops. b, Aggregate TAD analysis (ATA) depicting the average contact frequency across TADs defined in wild-type cells. c, Heatmap of the insulation score at TAD borders as defined for wild-type cells. d, Aggregate peak analysis as in Fig. 3c, using two independent library preps per genotype. e, Aggregate TAD analysis for wild-type and CTCF Y226A F228A cells as in (b). f, Heatmap of insulation scores at TAD borders for wild-type and CTCF Y226A F228A cells as in (c).
Extended Data Figure 5
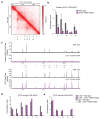
Extended Data Figure 5. CTCF Y226A F228A mutation has little effect on CTCF levels at CTCF sites.
a, Hi-C contact matrix of region chr16: 77000000 - 78300000 at 10 kb resolution for the wild type cell line (lower triangle) and the CTCF Y226A F228A cell line (upper triangle). CTCF sites are depicted below; those selected for qPCR are shown in colour. Red triangles indicate sites with a forward motif and blue triangles indicate sites with a reverse motif. The numbers underneath indicate the qPCR primer pairs shown in (b). Primer pair 11 (indicated with *) is at a locus devoid of SCC1 and CTCF. b, ChIP-qPCR analysis of SCC1 (cohesin) enrichment at the aforementioned CTCF sites and control locus (*) in wild type and CTCF Y226A F228A cells. The mean of three independent ChIP experiments is shown with the standard deviation. c, ChIP-seq tracks for SCC1 and CTCF at region chr16: 77000000 - 78300000 in wild type and CTCF Y226A F228A cells. The loci used for ChIP-qPCR analysis are indicated below the SCC1 ChIP-Seq tracks. d, ChIP-qPCR analysis of CTCF abundance at loci 1 to 7, as described in Fig. 3d. Analysis includes IgG as a control. The mean of two independent ChIP experiments is shown. Details about replicates are shown in the Methods. e, ChIP-qPCR analysis of CTCF abundance at loci 8 to 12, as described in Extended Data Fig. 4a. Analysis includes IgG as a control. The mean of two independent ChIP experiments is shown. Details about replicates are shown in the extended methods.
Extended Data Figure 6
Extended Data Figure 6. Compartmentalization is largely maintained in cells containing the CTCF Y226A F228A mutation.
a, Hi-C contact matrices of the q-arm of chromosome 2 at 500 kb resolution. The corresponding compartment scores are plotted above. b, Genome-wide comparison of compartment scores for wild type and CTCF Y226A F228A cells (Pearson correlation = 0.97). c, Saddle plots representing the interaction between A and B compartments. d, A region of chromosome 1 (chr1: 55500000 - 59500000) at 10kb resolution that harbours no obvious CTCF-anchored loops. e, Relative contact probability profiles for wild type and CTCF Y226A F228A mutant cells (left), compared to previously published contact profiles upon degradation of CTCF (middle) or SCC1 (right). The CTCF Y226A F228A mutation, like CTCF depletion, only slightly affects the contact probability profile.
Extended Data Figure 7
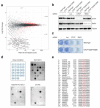
Extended Data Figure 7. Identification of CES ligands.
a, MA plot depicting the log2 fold change in gene expression in relation to the mean of the normalized counts for each gene. Differentially expressed genes (adjusted p-value < 0.05, two-tailed Wald test adjusted for multiple testing using the Benjamini-Hochberg procedure) are shown in red. Gene names are included for the 40 genes with the highest fold-change. b, Western blot assessing knockdown of CTCF and the cohesin subunit SMC1 upon transfection with a control siRNA targeting Luciferase (Luc) or siRNAs targeting CTCF or SMC1. This experiment was performed twice with similar results. c, Colony formation assay of wild type and CTCF Y226A F228A cells upon transfection with a control siRNA targeting Luciferase (Luc) or siRNAs targeting CTCF or SMC1. CTCF remains essential for viability in CTCF Y226A F228A cells. This experiment was performed four times with similar results. d, Peptide array annotation (top left), binding of SA2-SCC1 (top right) or SA2 F371A-SCC1 mutant (bottom left) and antibody control (bottom right). Three independent experiments were done with consistency. One representative example is shown. e, Amino acid sequences of the peptides. Predicted lead-anchoring residues are colored in red.
Figure 1
Figure 1. Structure of the SA2-SCC1-CTCF complex.
a, Surface-rendered cartoon of the SA2-SCC1-CTCF complex colored in blue, green and magenta, respectively. b, Detailed view of the binding interface with SA2 residues in blue, SCC1 in green and CTCF in magenta. c, Details of the composite binding pocket around CTCF F228 and d, CTCF Y226. e, GST pulldown analysis of CTCF and f, SA2 or SCC1 variants. Controls are shown in panel e (lanes 1-2). Experiments were done once. g, SA2 is surface-rendered and colored according to sequence conservation.
Figure 2
Figure 2. CTCF interaction stabilizes cohesin on DNA.
a, Schematic representation of competition between CTCF and WAPL. b, Increasing amounts of WAPL residues 1-600 (lane 4-7; molar ratios are indicated) were incubated with GST-CTCF and SA2-SCC1 and the bound fraction analysed. Three independent experiments were done with consistency. A representative example is shown. c, Example images of cells used in (d) at the indicated time points after photobleaching. FRAP was performed in G1 cells (see Extended Data Fig. 3d for details). d, Quantification of the FRAP experiments. Averages and standard deviations for 21 wild type cells and 17 CTCF Y226A F228A cells, measured over three independent experiments.
Figure 3
Figure 3. CTCF-CES interaction is required for CTCF-anchored loops.
a, Hi-C contact matrices of the HoxA locus at 10 kb resolution, normalized to 100 million contacts per sample. Genes and CTCF sites are depicted above the contact matrices. b, Genome-wide quantification of loops using HICCUPS. The inset shows an example of called loops for a region of chromosome 16. c, Aggregate peak analysis (APA) for the loops defined in wild type cells. The Hi-C signal is averaged across these locations for both cell lines.
Figure 4
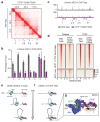
Figure 4. CTCF-CES interaction promotes cohesin localization to CTCF sites.
a, Hi-C contact matrix of a region of chromosome 7 at 10 kb resolution. CTCF sites are depicted below; those selected for qPCR are shown in colour (forward motifs in red, reverse motifs in blue). The numbers underneath indicate the loci used for qPCRs in (b). Locus 6 is the HOTAIRM1 transcription start site (indicated with *). b, ChIP-qPCR analysis of SCC1 (cohesin) at the loci depicted in (a). The mean of three independent ChIP experiments is shown with standard deviations. c, ChIP-seq tracks for SCC1 of the same region of chromosome 7 as depicted by Hi-C in (a). The ChIP-qPCR loci of (b) are depicted below. d, ChIP-seq heatmap of the cohesin subunit SCC1 (left) and CTCF (right). The depicted sites are selected for being bound in wild type cells by both SCC1 and CTCF (top), or only by SCC1 (bottom). e, Cohesin-mediate looping initiates at distal sites suntil encounter of the N-terminal end of CTCF. f, Cohesin-mediated looping starts at CTCF sites. e, In the CTCF mutant the YxF motif does not engage the CES on SA2-SCC1 resulting in DNA release. g, Molecular model of CTCF and SA2-SCC1 bound to DNA (grey). The YxF motif is separated by a flexible linker spanning residues 232-267 (magenta dotted line) to the C-terminal DNA binding domain of CTCF.

References

    1. Merkenschlager M, Nora EP. CTCF and Cohesin in Genome Folding and Transcriptional Gene Regulation. Annual review of genomics and human genetics. 2016;17:17–43. - PubMed
    1. Dekker J, Mirny L. The 3D Genome as Moderator of Chromosomal Communication. Cell. 2016;164:1110–1121. - PMC - PubMed
    1. Rowley MJ, Corces VG. Organizational principles of 3D genome architecture. Nature reviews Genetics. 2018;19:789–800. - PMC - PubMed
    1. Yatskevich S, Rhodes J, Nasmyth K. Organization of Chromosomal DNA by SMC Complexes. Annu Rev Genet. 2019 - PubMed
    1. Alipour E, Marko JF. Self-organization of domain structures by DNA-loop-extruding enzymes. Nucleic Acids Res. 2012;40:11202–11212. - PMC - PubMed

MeSH terms