. 2019 Dec 30;21(1):244.
doi: 10.3390/ijms21010244.

Difference in Developmental Kinetics of Y-Specific Monoclonal Antibody Sorted Male and Female In Vitro Produced Bovine Embryos

Affiliations

Difference in Developmental Kinetics of Y-Specific Monoclonal Antibody Sorted Male and Female In Vitro Produced Bovine Embryos

Tabinda Sidrat et al. Int J Mol Sci. .

Abstract

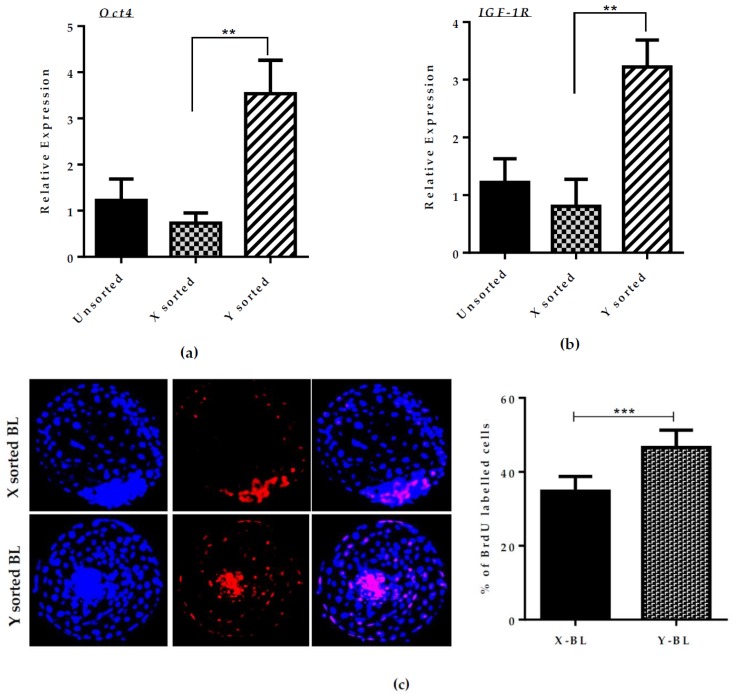
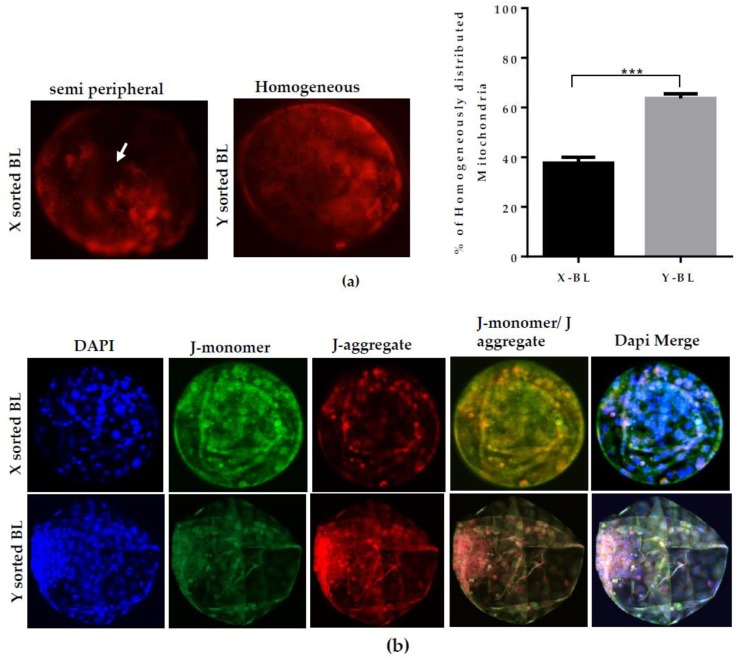
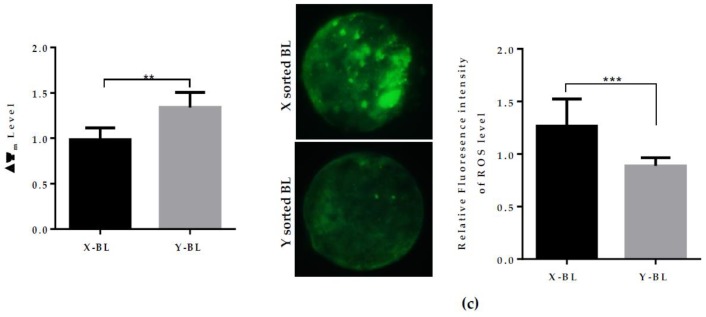
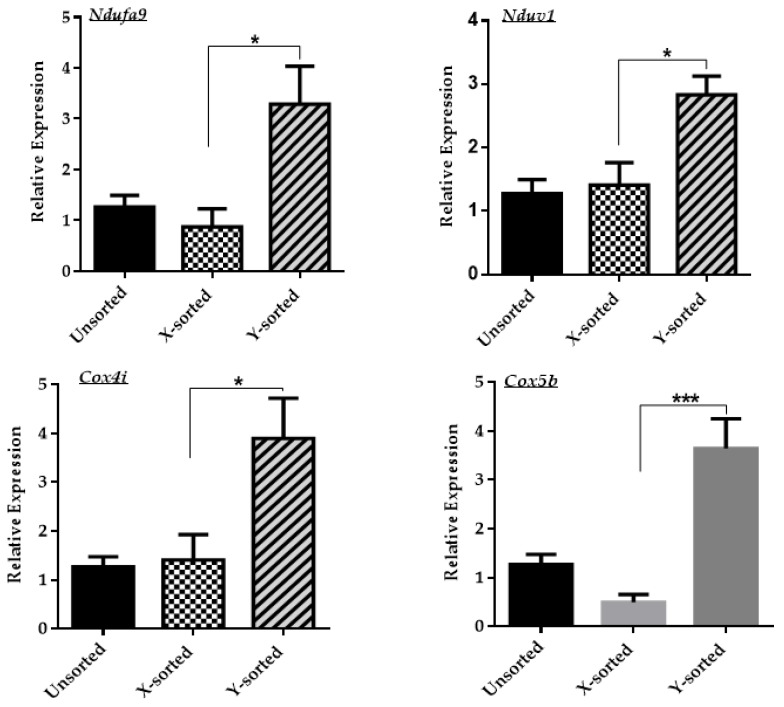
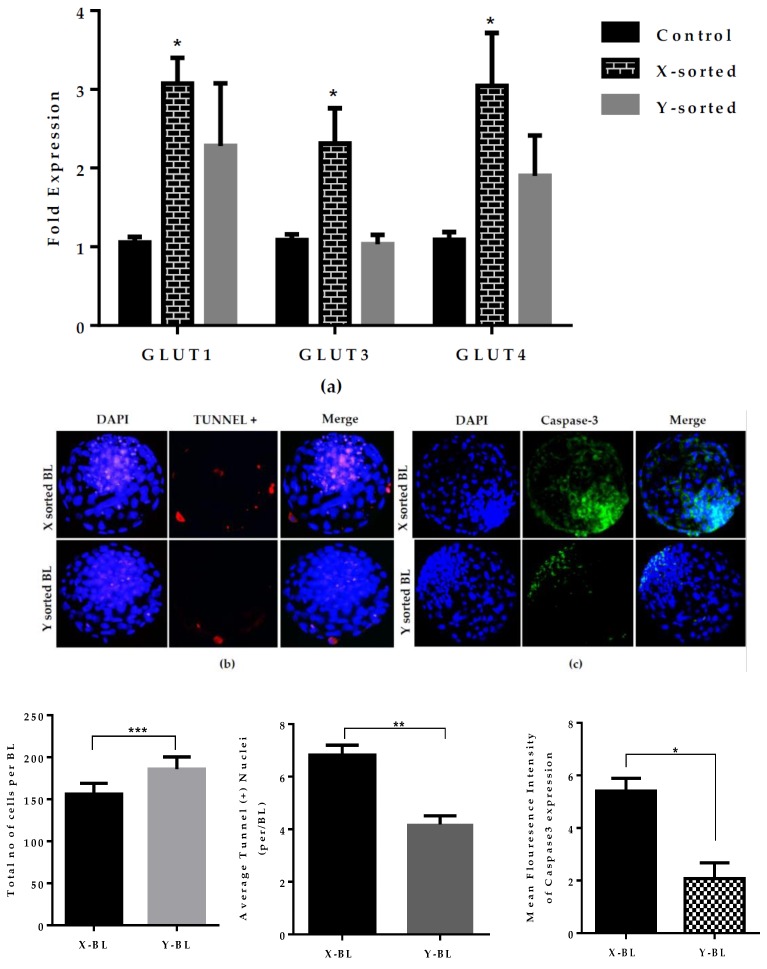
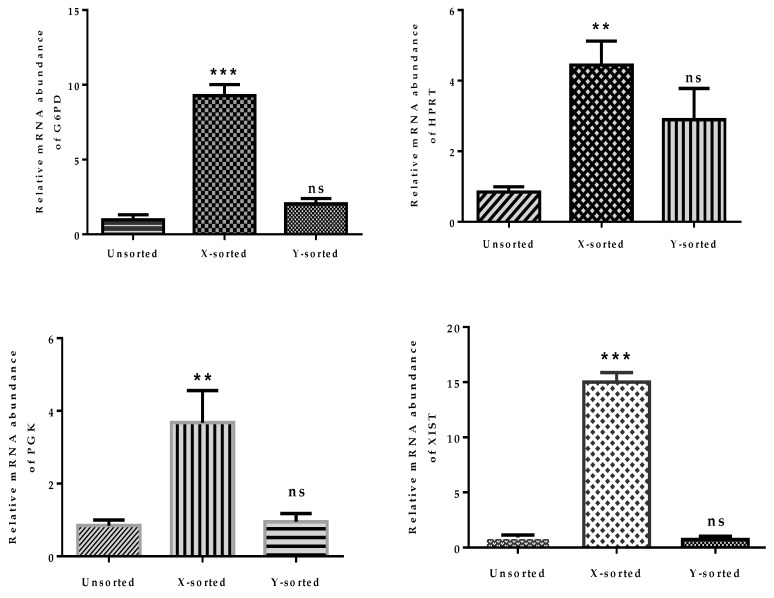
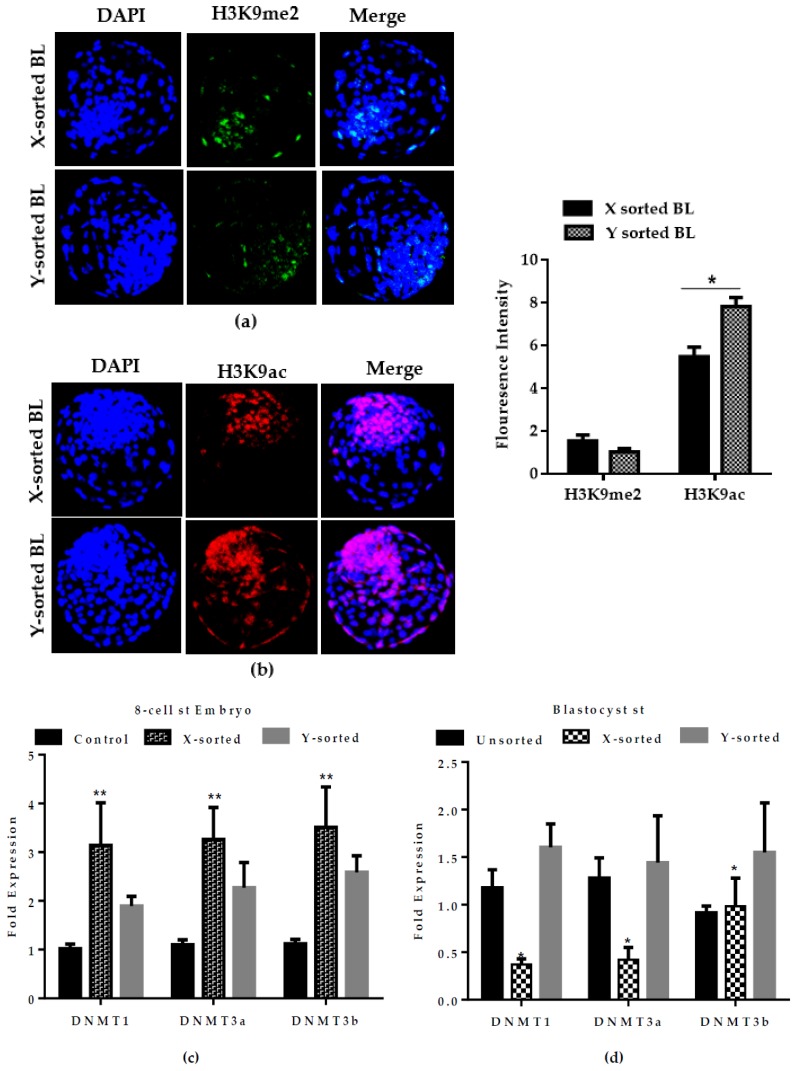
Sex-related growth differences between male and female embryos remain an attractive subject for reproductive biologists. This study aimed to investigate the endogenous factors that play a crucial role in the pace of early development between male and female bovine embryos. Using sex pre-selected semen by Y-specific monoclonal antibodies for the production of bovine embryos, we characterized the critical endogenous factors that are responsible for creating the development differences, especially during the pre-implantation period between male and female embryos. Our results showed that at day seven, (57.8%) Y-sperm sorted in vitro cultured embryos reached the expanded blastocyst (BL) stage, whereas the X-sperm sorted group were only 25%. Y-BLs showed higher mRNA abundance of pluripotency and developmental competency regulators, such as Oct4 and IGF1-R. Interestingly, Y-sperm sorted BLs had a homogeneous mitochondrial distribution pattern, higher mitochondrial membrane potential (∆Ѱm), efficient OXPHOS (oxidative phosphorylation) system and well-encountered production of ROS (reactive oxygen species) level. Moreover, Y-blastocysts (BLs) showed less utilization of glucose metabolism relative to the X-BLs group. Importantly, both sexes showed differences in the timing of epigenetic events. All these factors directly or indirectly orchestrate the whole embryonic progression and may help in the faster and better quality yield of BL in the Y-sperm sorted group compared to the X counterpart group.

Keywords: Bovine blastocyst; Y-specific monoclonal antibody; developmental kinetics; sex differences.


Conflict of interest statement

The authors declare no conflict of interest.

Figures

Figure 1
Figure 1
Differences in developmental competence and cell proliferation ratio during X- and Y-BL (blastocyst) development. Relative mRNA expression of (a) OCT4 and (b) IGF1-R in unsorted, X-sorted, and Y sperm-sorted day seven BLs. (c) Immunofluorescence staining of 5-bromo-2′-deoxyuridine (BrdU) in X and Y sperm-derived day seven BL. Quantification of cell proliferation rate. Bar graph data represent means ± SEM (standard error of mean) from three independent sets of experiment, including n = 20 BLs per group in each replicate. ** p < 0.01; *** p < 0.001 indicates significant difference. Original magnification 100×.
Figure 2
Figure 2
Difference in mitochondrial distribution, ∆Ѱm, and ROS level during the development of X- and Y-sorted BLs. (a) Representative images of Mitotracker (Red) staining showing X-BL with semiperipheral and Y-BL with homogeneous distribution patterns of mitochondria. Data in graph represent the percentage of homogeneously distributed mitochondria in the X- and Y-BL groups. (b) Expression of J-monomer (green) and J-aggregates (red) was analyzed by JC-1 staining to measure the mitochondrial ∆Ѱm in X- and Y-BL using confocal microscopy. Quantification for relative fluorescence intensities in both X- and Y sperm-derived BLs are presented in graph. (c) DCHDFA (2’, 7’-dichlorodihydrofluorescein diacetate) staining for the generation of ROS level in X- and Y-BL. Quantification of fluorescence intensities is shown in graph. Bar graphs represent means ± SEM from three separate experiments with day seven BLs, n = 15 per group in individual sets of assays. ** p < 0.01; *** p < 0.001. Original Magnification 100×.
Figure 2
Figure 2
Difference in mitochondrial distribution, ∆Ѱm, and ROS level during the development of X- and Y-sorted BLs. (a) Representative images of Mitotracker (Red) staining showing X-BL with semiperipheral and Y-BL with homogeneous distribution patterns of mitochondria. Data in graph represent the percentage of homogeneously distributed mitochondria in the X- and Y-BL groups. (b) Expression of J-monomer (green) and J-aggregates (red) was analyzed by JC-1 staining to measure the mitochondrial ∆Ѱm in X- and Y-BL using confocal microscopy. Quantification for relative fluorescence intensities in both X- and Y sperm-derived BLs are presented in graph. (c) DCHDFA (2’, 7’-dichlorodihydrofluorescein diacetate) staining for the generation of ROS level in X- and Y-BL. Quantification of fluorescence intensities is shown in graph. Bar graphs represent means ± SEM from three separate experiments with day seven BLs, n = 15 per group in individual sets of assays. ** p < 0.01; *** p < 0.001. Original Magnification 100×.
Figure 3
Figure 3
Differences in the mitochondrial OXPHOS system attributed to the development of X- and Y-BLs. Relative mRNA expression analysis of mitochondrial OXPHOS subunit genes, Ndufa9, Ndufv1, Cox4i, Cox5b in unsorted, X-, and Y-sperm-sorted BLs at day seven. Data in the bar graphs represent the means ± SEM from three independent sets of experiments. * p < 0.05; *** p < 0.001.
Figure 4
Figure 4
Differences in cell metabolism and apoptosis level on the quality and development kinetics of X- and Y-sorted BL. (a) Relative mRNA level of GLUT1, GLUT3, GLUT4 in control, X-, and Y-sperm generated day seven BL groups. (b) Fluorescence microscope image of TUNEL-positive cells (red) and DAPI (4,6-diamidino-2-phenylindole) (blue) shown in X- and Y-BL at day seven. White arrows indicate the apoptotic cells in nuclei. (c) Representative fluorescent image showing Caspase-3 expression in X- and Y-BL. Graphical data represent the quantification of fluorescent images of X- and Y-BL groups. Data in the bar graphs represent the means ± SEM from three independent sets of experiments including n = 20 BLs per group in each replicate. * p < 0.05; ** p < 0.01; *** p < 0.001. Original magnification 100×.
Figure 5
Figure 5
Relative mRNA expression of X-chromosome linked genes in X and Y sperm-sorted BLs. Quantitative real-time PCR analysis showing the mRNA expression level of X-chromosome linked genes, G6PD, HPRT, PGK, and XIST in an unsorted, X, and Y sperm-sorted BL. Data in the bar graphs represent the means ± SEM from three independent sets of experiments. ** p < 0.01; *** p < 0.001. ns indicated the non-significant difference as compared to unsorted group.
Figure 6
Figure 6
Epigenetic status during development of X and Y sperm-sorted BL. (a) Representative fluorescent images of H3K9me2 and (b) H3K9ac in X- and Y-BL. Mean fluorescence intensity of H3K9me2 and H3K9ac signals in the X- and Y-BL groups are presented in the graph. The experiment was performed in triplicate sets of experiment with 20 BLs per group in each replicate (c,d). Analysis of relative mRNA expression of DNMTs in X and Y sperm-sorted 8-cell stage embryo and day eight BLs. Data in the bar graphs represent the means ± SEM from three independent sets of experiments. * p < 0.05; ** p < 0.01. Original magnification 100×.

References

    1. Bermejo-Alvarez P., Rizos D., Lonergan P., Gutierrez-Adan A. Transcriptional sexual dimorphism during preimplantation embryo development and its consequences for developmental competence and adult health and disease. Reproduction. 2011;141:563–570. doi: 10.1530/REP-10-0482. - DOI - PubMed
    1. Nedambale T.L., Dinnyes A., Yang X., Tian X.C. Bovine blastocyst development in vitro: Timing, sex, and viability following vitrification. Biol. Reprod. 2004;71:1671–1676. doi: 10.1095/biolreprod.104.027987. - DOI - PubMed
    1. Inaba Y., Abe R., Geshi M., Matoba S., Nagai T., Somfai T. Sex-sorting of spermatozoa affects developmental competence of in vitro fertilized oocytes in a bull-dependent manner. J. Reprod. Dev. 2016;62:451–456. doi: 10.1262/jrd.2016-032. - DOI - PMC - PubMed
    1. Bermejo-Alvarez P., Rizos D., Rath D., Lonergan P., Gutierrez-Adan A. Sex determines the expression level of one third of the actively expressed genes in bovine blastocysts. Proc. Natl. Acad. Sci. USA. 2010;107:3394–3399. doi: 10.1073/pnas.0913843107. - DOI - PMC - PubMed
    1. Imai K., Matoba S., Dochi O., Shimohira I. Different factors affect developmental competence and cryotolerance in in vitro produced bovine embryo. J. Vet. Med. Sci. 2002;64:887–891. doi: 10.1292/jvms.64.887. - DOI - PubMed

LinkOut - more resources