

Salivary Microbiome and Cigarette Smoking: A First of Its Kind Investigation in Jordan
- PMID: 31905907
- PMCID: PMC6982339
- DOI: 10.3390/ijerph17010256
Salivary Microbiome and Cigarette Smoking: A First of Its Kind Investigation in Jordan
Abstract
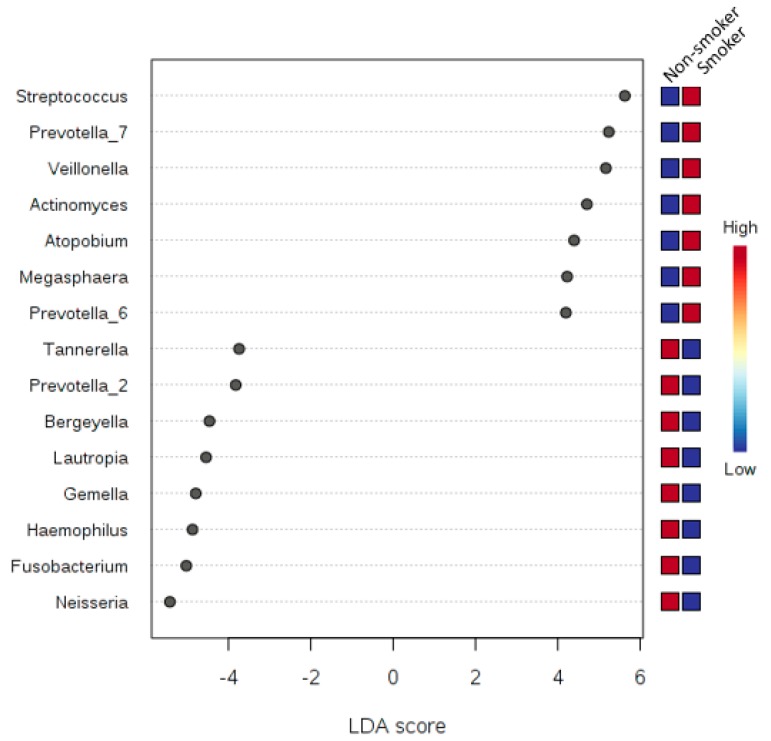
There is accumulating evidence in the biomedical literature suggesting the role of smoking in increasing the risk of oral diseases including some oral cancers. Smoking alters microbial attributes of the oral cavity by decreasing the commensal microbial population and increasing the pathogenic microbes. This study aims to investigate the shift in the salivary microbiota between smokers and non-smokers in Jordan. Our methods relied on high-throughput next-generation sequencing (NGS) experiments for V3-V4 hypervariable regions of the 16S rRNA gene, followed by comprehensive bioinformatics analysis including advanced multidimensional data visualization methods and statistical analysis approaches. Six genera-Streptococcus, Prevotella, Vellionella, Rothia, Neisseria, and Haemophilus-predominated the salivary microbiota of all samples with different percentages suggesting the possibility for the salivary microbiome to restored after quitting smoking. Three genera-Streptococcus, Prevotella, and Veillonella-showed significantly elevated levels among smokers at the expense of Neisseria in non-smokers. In conclusion, smoking has a definite impact on shifting the salivary microbiota in smokers. We can suggest that there is microbial signature at the genera level that can be used to classify smokers and non-smokers by Linear Discriminant Analysis Effect Size (LEfSe) based on the salivary abundance of genera. Proteomics and metabolomics studies are highly recommended to fully understand the effect of bacterial endotoxin release and xenobiotic metabolism on the bacterial interrelationships in the salivary microbiome and how they affect the growth of each other in the saliva of smokers.
Keywords: 16S rRNA; Jordan; bioinformatics; microbiome; microbiota; next-generation sequencing; operational taxonomic unit (OTU); saliva; smoking.
Conflict of interest statement
The authors declared no conflict of interest.
Figures


Similar articles
-
Salivary microbiomes: a potent evidence in forensic investigations.Forensic Sci Med Pathol. 2024 Sep;20(3):1058-1065. doi: 10.1007/s12024-023-00759-3. Epub 2024 Jan 4. Forensic Sci Med Pathol. 2024. PMID: 38175312 Review.
-
Smoking induced salivary microbiome dysbiosis and is correlated with lipid biomarkers.BMC Oral Health. 2024 May 25;24(1):608. doi: 10.1186/s12903-024-04340-4. BMC Oral Health. 2024. PMID: 38796419 Free PMC article.
-
Characterization of the salivary microbiome in healthy individuals under fatigue status.Front Cell Infect Microbiol. 2025 May 29;15:1506723. doi: 10.3389/fcimb.2025.1506723. eCollection 2025. Front Cell Infect Microbiol. 2025. PMID: 40510800 Free PMC article.
-
Analysis of the effect of smoking on the buccal microbiome using next-generation sequencing technology.J Med Microbiol. 2019 Aug;68(8):1148-1158. doi: 10.1099/jmm.0.001003. Epub 2019 Jun 14. J Med Microbiol. 2019. PMID: 31199220
-
The oral microbiome and human health.J Oral Sci. 2017;59(2):201-206. doi: 10.2334/josnusd.16-0856. J Oral Sci. 2017. PMID: 28637979 Review.
Cited by
-
Oral microbiome of electronic cigarette users: A cross-sectional exploration.Oral Dis. 2023 May;29(4):1875-1884. doi: 10.1111/odi.14186. Epub 2022 Mar 22. Oral Dis. 2023. PMID: 35285123 Free PMC article.
-
Healthy Oral Lifestyle Behaviours Are Associated with Favourable Composition and Function of the Oral Microbiota.Microorganisms. 2021 Aug 6;9(8):1674. doi: 10.3390/microorganisms9081674. Microorganisms. 2021. PMID: 34442754 Free PMC article.
-
Salivary microbiomes: a potent evidence in forensic investigations.Forensic Sci Med Pathol. 2024 Sep;20(3):1058-1065. doi: 10.1007/s12024-023-00759-3. Epub 2024 Jan 4. Forensic Sci Med Pathol. 2024. PMID: 38175312 Review.
-
Investigation of the impact of commonly used medications on the oral microbiome of individuals living without major chronic conditions.PLoS One. 2021 Dec 9;16(12):e0261032. doi: 10.1371/journal.pone.0261032. eCollection 2021. PLoS One. 2021. PMID: 34882708 Free PMC article.
-
The Role of the Microbiome in Oral Squamous Cell Carcinoma with Insight into the Microbiome-Treatment Axis.Int J Mol Sci. 2020 Oct 29;21(21):8061. doi: 10.3390/ijms21218061. Int J Mol Sci. 2020. PMID: 33137960 Free PMC article. Review.
References
Publication types
MeSH terms
Substances
LinkOut - more resources
Full Text Sources
