. 2019 Dec 30;12(1):98.
doi: 10.3390/cancers12010098.

Histone 2A Family Member J Drives Mesenchymal Transition and Temozolomide Resistance in Glioblastoma Multiforme

Affiliations

Histone 2A Family Member J Drives Mesenchymal Transition and Temozolomide Resistance in Glioblastoma Multiforme

Hsun-Hua Lee et al. Cancers (Basel). .

Erratum in

Abstract

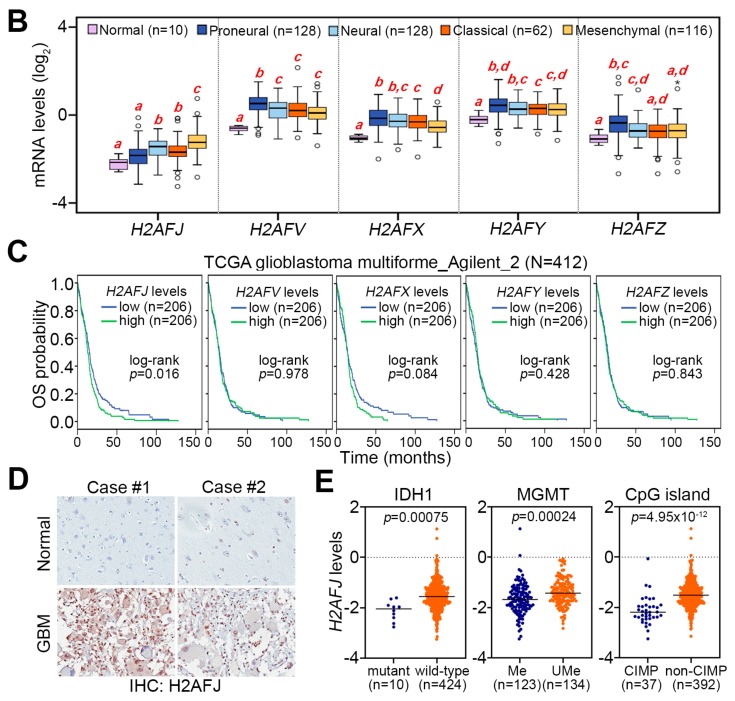
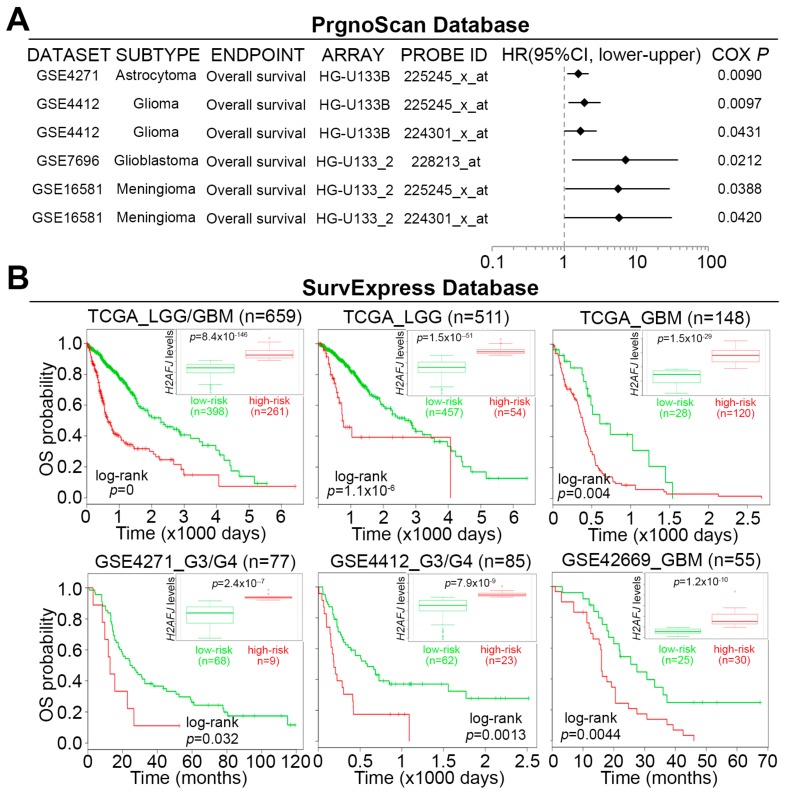
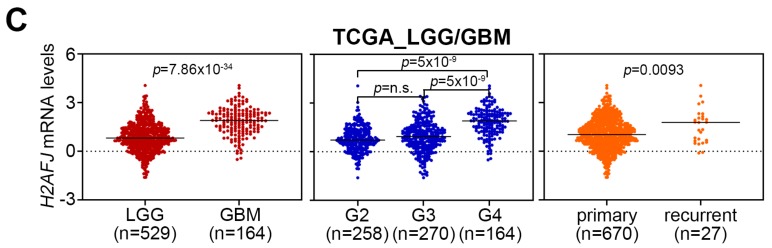
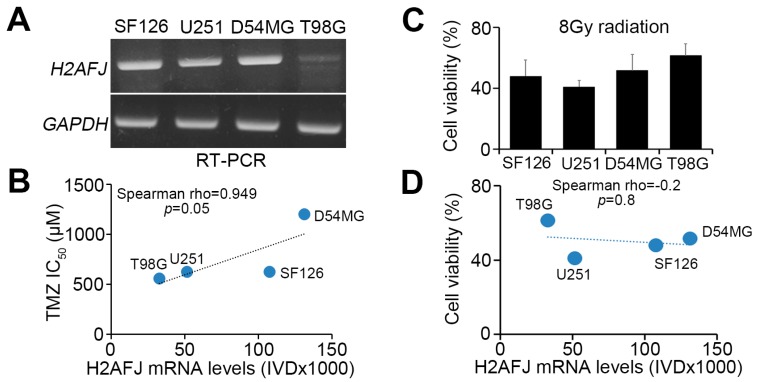
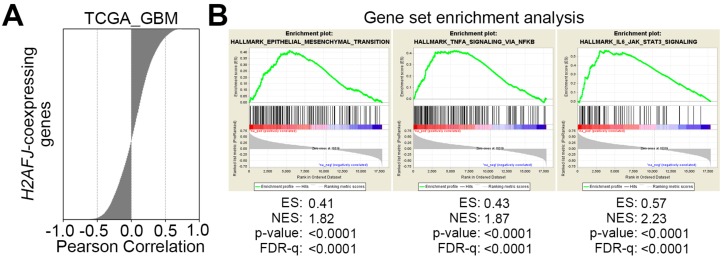
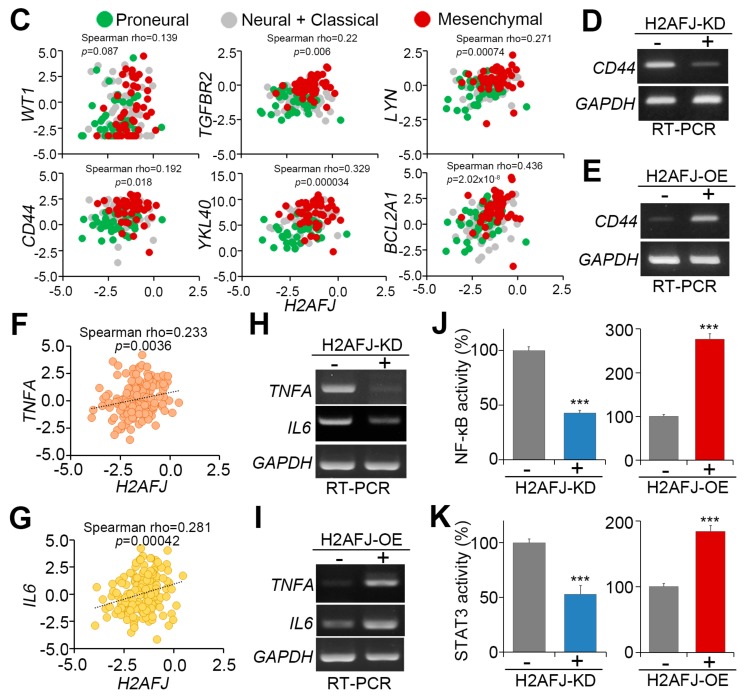
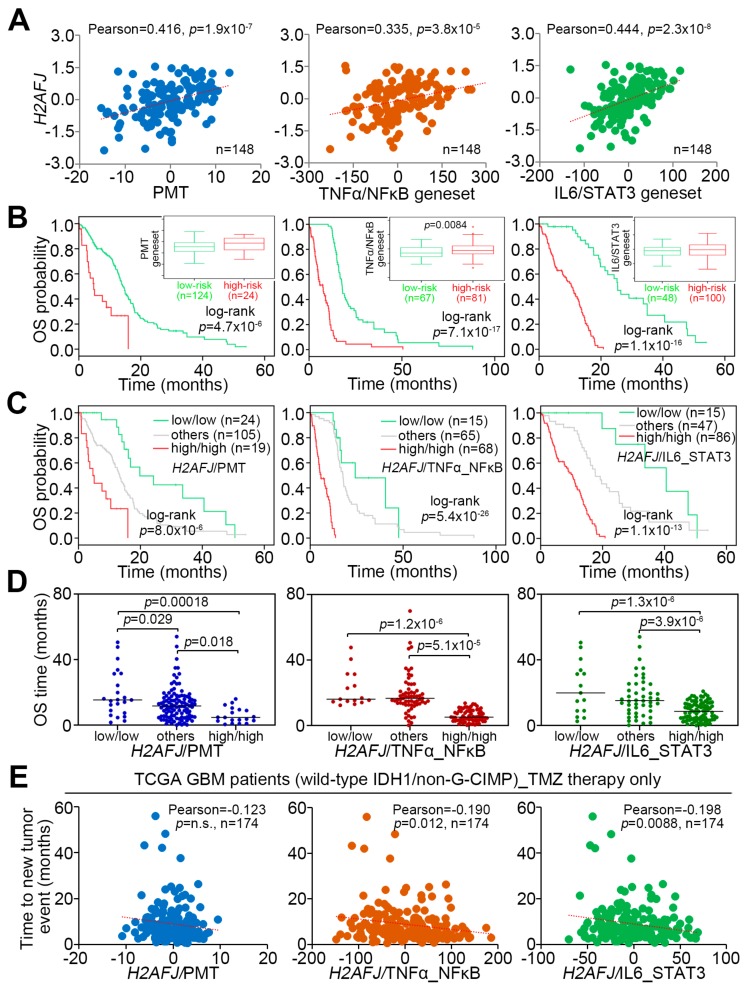
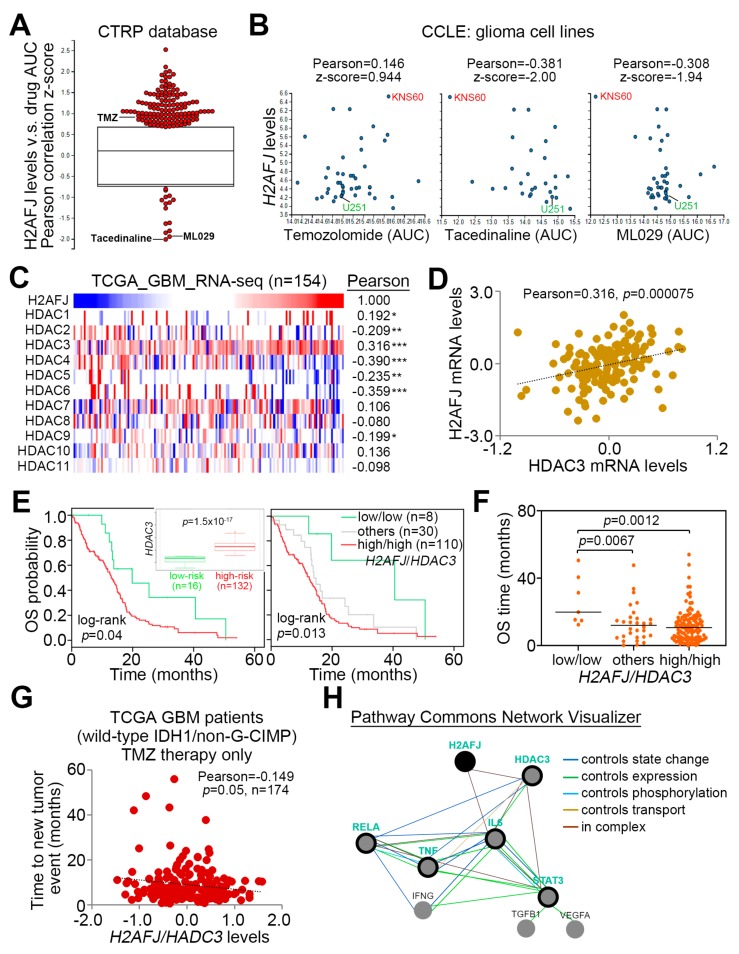
Glioblastoma multiforme (GBM) is the most aggressive brain tumor and has a poor prognosis and is poorly sensitive to radiotherapy or temozolomide (TMZ) chemotherapy. Therefore, identifying new biomarkers to predict therapeutic responses of GBM is urgently needed. By using The Cancer Genome Atlas (TCGA) database, we found that the upregulation of histone 2A family member J (H2AFJ), but not other H2AFs, is extensively detected in the therapeutic-insensitive mesenchymal, IDH wildtype, MGMT unmethylated, or non-G-CIMP GBM and is associated with poor TMZ responsiveness independent of radiation. Similar views were also found in GBM cell lines. Whereas H2AFJ knockdown diminished TMZ resistance, H2AFJ overexpression promoted TMZ resistance in a panel of GBM cell lines. Gene set enrichment analysis (GSEA) revealed that H2AFJ upregulation accompanied by the activation of TNF-α/NF-κB and IL-6/STAT3-related pathways is highly predicted. Luciferase-based promoter activity assay further validated that the activities of NF-κB and STAT3 are causally affected by H2AFJ expression in GBM cells. Moreover, we found that therapeutic targeting HADC3 by tacedinaline or NF-κB by ML029 is likely able to overcome the TMZ resistance in GBM cells with H2AFJ upregulation. Significantly, the GBM cohorts harboring a high-level H2AFJ transcript combined with high-level expression of TNF-α/NF-κB geneset, IL-6/STAT3 geneset or HADC3 were associated with a shorter time to tumor repopulation after initial treatment with TMZ. These findings not only provide H2AFJ as a biomarker to predict TMZ therapeutic effectiveness but also suggest a new strategy to combat TMZ-insensitive GBM by targeting the interaction network constructed by TNF-α/NF-κB, IL-6/STAT3, HDAC3, and H2AFJ.

Keywords: GBM; H2AFJ; MGMT; Temozolomide; precision medicine.


Conflict of interest statement

The authors declare no conflict of interest.

Figures

Figure 1
Figure 1
H2AFJ is highly expressed in mesenchymal-type GBM tissues. (A,B) Heatmap (A) and boxplot (B) for the transcriptional profile of the H2A subfamily, which was analyzed by Agilent G4502A microarray, in normal brain tissues (N for heatmap) and primary tumors derived from patients with different molecular subtypes (proneural, neural, classical and mesenchymal) of GBM using TCGA database. In (B), statistical significance was estimated by one-way ANOVA and Turkey’s post-hoc test. (C) Kaplan–Meier analyses for the mRNA levels of H2A subfamily under the condition of overall survival (OS) probability using TCGA GBM database. (D) Immunohistochemistry (IHC) staining of H2AFJ protein in two representatives of normal brain and GBM tissues. Photographs were taken at a magnification of 400×. (E) Dot plots for the transcriptional profiling of H2AFJ in IDH1 mutant and wild-type GBM, MGMT promoter methylated (Me), and unmethylated (Ume) GBM, or CpG island methylation phenotype (CIMP) and non-CIMP-harboring GBM. The statistical significance was determined by Student’s t-test.
Figure 1
Figure 1
H2AFJ is highly expressed in mesenchymal-type GBM tissues. (A,B) Heatmap (A) and boxplot (B) for the transcriptional profile of the H2A subfamily, which was analyzed by Agilent G4502A microarray, in normal brain tissues (N for heatmap) and primary tumors derived from patients with different molecular subtypes (proneural, neural, classical and mesenchymal) of GBM using TCGA database. In (B), statistical significance was estimated by one-way ANOVA and Turkey’s post-hoc test. (C) Kaplan–Meier analyses for the mRNA levels of H2A subfamily under the condition of overall survival (OS) probability using TCGA GBM database. (D) Immunohistochemistry (IHC) staining of H2AFJ protein in two representatives of normal brain and GBM tissues. Photographs were taken at a magnification of 400×. (E) Dot plots for the transcriptional profiling of H2AFJ in IDH1 mutant and wild-type GBM, MGMT promoter methylated (Me), and unmethylated (Ume) GBM, or CpG island methylation phenotype (CIMP) and non-CIMP-harboring GBM. The statistical significance was determined by Student’s t-test.
Figure 2
Figure 2
H2AFJ acts as a poor prognostic marker in brain tumors, particularly GBM. (A) A meta-analysis of H2AFJ in low-grade glioma and GBM using the PrognoScan database (left). A forest plot (right) was used to present the hazard ratio (HR) distribution in the 95% confidence interval (CI) estimated by Cox regression against H2AFJ transcript levels (high vs. low) in the enrolled cohorts. (B) Prognostic estimation of H2AFJ expression using the SurvExpress program under the condition of overall survival (OS) probability in low-grade glioma (LGG)/GBM, LGG or GBM cohorts from TCGA and LGG or GBM cohorts from three GEO datasets (GSE4271, GSE4412, and GSE42669). The inserts indicate the mRNA levels of H2AFJ in the low- and high-risk groups. (C) Dot plots for the transcriptional profiling of H2AFJ in clinical tissues derived from LGG and GBM, different histological grades, or primary and recurrent tumors using TCGA LGG/GBM database. The bars indicate the mean of H2AFJ mRNA levels in each group. The statistical significance was analyzed by Student t-test (left and right) or one-way ANOVA and Turkey’s post-hoc test (middle). The symbol “n.s.” denotes not significant.
Figure 2
Figure 2
H2AFJ acts as a poor prognostic marker in brain tumors, particularly GBM. (A) A meta-analysis of H2AFJ in low-grade glioma and GBM using the PrognoScan database (left). A forest plot (right) was used to present the hazard ratio (HR) distribution in the 95% confidence interval (CI) estimated by Cox regression against H2AFJ transcript levels (high vs. low) in the enrolled cohorts. (B) Prognostic estimation of H2AFJ expression using the SurvExpress program under the condition of overall survival (OS) probability in low-grade glioma (LGG)/GBM, LGG or GBM cohorts from TCGA and LGG or GBM cohorts from three GEO datasets (GSE4271, GSE4412, and GSE42669). The inserts indicate the mRNA levels of H2AFJ in the low- and high-risk groups. (C) Dot plots for the transcriptional profiling of H2AFJ in clinical tissues derived from LGG and GBM, different histological grades, or primary and recurrent tumors using TCGA LGG/GBM database. The bars indicate the mean of H2AFJ mRNA levels in each group. The statistical significance was analyzed by Student t-test (left and right) or one-way ANOVA and Turkey’s post-hoc test (middle). The symbol “n.s.” denotes not significant.
Figure 3
Figure 3
H2AFJ upregulation desensitizes GBM cells to TMZ treatment. (A) RT-PCR analysis of H2AFJ and GAPDH expression in different GBM cell lines. (B) Scatter plots for the correlation between H2AFJ expression and TMZ IC50 concentrations in various GBM cells. (C) Cell viability of the detected GBM cells after 24-h exposure to radiation at 8 Gy. The count of remaining viable cells after radiation treatment was normalized with the cell number of the untreated group in each detected GBM cell line. The data from three independent experiments are presented as the mean ± SEM. (D) Scatter plots for the correlation between H2AFJ mRNA levels and cell viability of the detected GBM cells posttreatment with radiation at 8 Gy for 24 h. A non-parametric Spearman correlation test was used to estimate statistical significance in B and D. (E,F) Scatchart plots for the cell viability of D54MG cells (E) with or without H2AFJ knockdown (insert) and T98G cells (F) with or without H2AFJ overexpression (insert) after TMZ treatment for four days at the indicated TMZ concentrations. In A, E and F, GAPDH was used as an internal control for RT-PCR experiments. (G) Kaplan–Meier analysis of overall survival probability associated with H2AFJ gene expression in MGMT-unmethylated and -methylated GBM patients undergoing radiation therapy or standard TMZ/radiation therapy. (H) Scatter plots for H2AFJ transcripts and time to a new tumor event after radiation or TMZ therapy in GBM patients who were diagnosed to be wild-type IDH and non-G-CIMP. The statistical significance was estimated by Pearson’s correlation test. The symbol “n.s.” denotes not significant.
Figure 3
Figure 3
H2AFJ upregulation desensitizes GBM cells to TMZ treatment. (A) RT-PCR analysis of H2AFJ and GAPDH expression in different GBM cell lines. (B) Scatter plots for the correlation between H2AFJ expression and TMZ IC50 concentrations in various GBM cells. (C) Cell viability of the detected GBM cells after 24-h exposure to radiation at 8 Gy. The count of remaining viable cells after radiation treatment was normalized with the cell number of the untreated group in each detected GBM cell line. The data from three independent experiments are presented as the mean ± SEM. (D) Scatter plots for the correlation between H2AFJ mRNA levels and cell viability of the detected GBM cells posttreatment with radiation at 8 Gy for 24 h. A non-parametric Spearman correlation test was used to estimate statistical significance in B and D. (E,F) Scatchart plots for the cell viability of D54MG cells (E) with or without H2AFJ knockdown (insert) and T98G cells (F) with or without H2AFJ overexpression (insert) after TMZ treatment for four days at the indicated TMZ concentrations. In A, E and F, GAPDH was used as an internal control for RT-PCR experiments. (G) Kaplan–Meier analysis of overall survival probability associated with H2AFJ gene expression in MGMT-unmethylated and -methylated GBM patients undergoing radiation therapy or standard TMZ/radiation therapy. (H) Scatter plots for H2AFJ transcripts and time to a new tumor event after radiation or TMZ therapy in GBM patients who were diagnosed to be wild-type IDH and non-G-CIMP. The statistical significance was estimated by Pearson’s correlation test. The symbol “n.s.” denotes not significant.
Figure 4
Figure 4
H2AFJ upregulation is associated with proneural-mesenchymal transition and activation of TNFα/NF-κB and IL-6/STAT3-related pathways. (A) Histogram for the results from Pearson’s correlation test of the transcriptional profile for H2AFJ and other somatic genes in TCGA GBM tissues. (B) Snapshot of gene set enrichment analysis (GSEA) results showing as enrichment plots for epithelial-mesenchymal transition, TNFα/NF-κB and IL-6/STAT3 gene sets using the H2AFJ-related gene signature in A. (C) Scatter plots for the correlation of transcriptional profiles among H2AFJ and proneural-mesenchymal transition-associated markers (WT1, TGFBR2, LYN, CD44, YKL40, and BCL2A1) in GBM tissues from TCGA. (D,E) RT-PCR analysis for the mRNA levels of CD44 and GAPDH in D54MG cells without or with H2AFJ knockdown (KD, D) and T98G cells without or with H2AFJ overexpression (OE, E). (F,G) Scatter plots for the correlation among the gene expression of TNF-alpha (TNFA, F), interleukin-6 (IL6, G) and H2AFJ in the TCGA GBM database. In C, F, G, the statistical significance was analyzed by Spearman’s correlation test. (H,I) RT-PCR analysis for the mRNA levels of TNFA, IL6, and GAPDH in D54MG cells without or with H2AFJ knockdown (KD, H) and T98G cells without or with H2AFJ overexpression (OE, I). In D, E, H and I, GAPDH was used as an internal control for RT-PCR. (J,K) Histograms represent the results of luciferase-based reporter assays for NF-κB (J) and STAT3 (K) activities in D54MG cells without (non-silencing control, NS) or with H2AFJ knockdown (KD) and T98G cells without (vector control, VC) or with H2AFJ overexpression (OE). The data from three independent experiments are presented as the mean ± SEM. “***” denotes statistical significance at p < 0.001 for a non-parametric Mann–Whitney test.
Figure 4
Figure 4
H2AFJ upregulation is associated with proneural-mesenchymal transition and activation of TNFα/NF-κB and IL-6/STAT3-related pathways. (A) Histogram for the results from Pearson’s correlation test of the transcriptional profile for H2AFJ and other somatic genes in TCGA GBM tissues. (B) Snapshot of gene set enrichment analysis (GSEA) results showing as enrichment plots for epithelial-mesenchymal transition, TNFα/NF-κB and IL-6/STAT3 gene sets using the H2AFJ-related gene signature in A. (C) Scatter plots for the correlation of transcriptional profiles among H2AFJ and proneural-mesenchymal transition-associated markers (WT1, TGFBR2, LYN, CD44, YKL40, and BCL2A1) in GBM tissues from TCGA. (D,E) RT-PCR analysis for the mRNA levels of CD44 and GAPDH in D54MG cells without or with H2AFJ knockdown (KD, D) and T98G cells without or with H2AFJ overexpression (OE, E). (F,G) Scatter plots for the correlation among the gene expression of TNF-alpha (TNFA, F), interleukin-6 (IL6, G) and H2AFJ in the TCGA GBM database. In C, F, G, the statistical significance was analyzed by Spearman’s correlation test. (H,I) RT-PCR analysis for the mRNA levels of TNFA, IL6, and GAPDH in D54MG cells without or with H2AFJ knockdown (KD, H) and T98G cells without or with H2AFJ overexpression (OE, I). In D, E, H and I, GAPDH was used as an internal control for RT-PCR. (J,K) Histograms represent the results of luciferase-based reporter assays for NF-κB (J) and STAT3 (K) activities in D54MG cells without (non-silencing control, NS) or with H2AFJ knockdown (KD) and T98G cells without (vector control, VC) or with H2AFJ overexpression (OE). The data from three independent experiments are presented as the mean ± SEM. “***” denotes statistical significance at p < 0.001 for a non-parametric Mann–Whitney test.
Figure 5
Figure 5
The signature of combing high-level H2AFJ transcripts with high-level PMT geneset, TNFα/NF-κB geneset or IL-6/STAT3 geneset expression correlates with poor responsiveness to TMZ therapy in patients with GBM harboring wild-type IDH1 and non-G-CIMP. (A) Scatter plots for the correlation of mRNA levels determined by RNA sequencing technique among H2AFJ, PMT geneset, TNFα/NF-κB geneset or IL-6/STAT3 geneset in primary tumors derived from the TCGA GBM database. (B,C) Kaplan–Meier analyses using overall survival (OS) probability for the low and high-risk populations defined by SurvExpress program under a maximal risk condition in accordance with the transcriptional levels of PMT geneset, TNFα/NF-κB geneset or IL-6/STAT3 geneset combined without (B) or with (C) H2AFJ mRNA levels in TCGA GBM database. Insets represent the mRNA levels of the factors in low and high-risk populations. In C, others denote the low/high and high/low expression levels. (D) Dot plots represent overall survival time in the three populations stratified in C according to the transcriptional profiles of H2AFJ, PMT geneset, TNFα/NF-κB geneset or IL-6/STAT3 geneset in primary tumors derived from the TCGA GBM database. The bars indicate the mean of overall survival time in each group. One-way ANOVA and Turkey’s post-hoc test was used to estimate the statistical significance. (E) Scatter plots for the correlation of time to new tumor event with the H2AFJ mRNA levels combined with the transcriptional profiles of PMT geneset, TNFα/NF-κB geneset or IL-6/STAT3 geneset in the TCGA IDH1 wild-type/non-G-CIPM GBM patients receiving TMZ therapy. The statistical significance was analyzed by Pearson’s correlation test. The symbol “n.s.” denotes not significant.
Figure 6
Figure 6
(A) Box/dot plot for the z-score derived from Pearson’s correlation test for the transcriptional profile of H2AFJ and the AUC values of drug IC50 concentrations in glioma cell lines using CTRP database. AUC is abbreviated from the area under the curve of the receiver operating characteristic curve. (B) Scatter plots represent the results of Pearson’s correlation test for the association of H2AFJ mRNA levels with the AUC values of temozolomide, tacedinaline or ML029 IC50 concentrations in glioma cell lines using the Cancer Cell Line Encyclopedia (CCLE) database. (C) Heatmap for the transcriptional profiles of H2AFJ and HDAC subfamily determined by RNA sequencing method in the TCGA GBM database. The results of Pearson’s correlation test against the transcriptional profiles of H2AFJ and the all listed genes are shown next to the heatmap. The symbols *, ** and *** denote the statistical significance at p < 0.05, p < 0.01, and p < 0.001 in Pearson’s correlation test. (D) Scatter plot represents the correlation for the transcriptional profile of H2AFJ and HDAC3 in the TCGA GBM database. (E) Kaplan–Meier analyses using overall survival (OS) probability for the low and high-risk populations defined by SurvExpress program under a maximal risk condition in accordance with the transcriptional profile of HDAC3 combined without (left) or with (right) H2AFJ mRNA levels in TCGA GBM database. Insets represent the mRNA levels of HDCA3 in low and high-risk populations. In the right figure, others denote the low/high and high/low expression levels of H2AFJ and HDAC3. (F) Dot plots represent overall survival time in the three population stratified in E according to the transcriptional profiles of H2AFJ and HDCA3 in primary tumors derived from the TCGA GBM database. The bars indicate the mean of overall survival time in each group. One-way ANOVA and Turkey’s post-hoc test was used to estimate the statistical significance. (G) Scatter plots for the correlation of time to a new tumor event with the transcriptional profile of H2AFJ/HDAC3 in TCGA IDH1 wild-type/non-G-CIPM GBM patients receiving TMZ therapy. The statistical significance was analyzed by Pearson’s correlation test. (H) The network of inter-molecular interactions among H2AFJ, HDAC3, TNFα/NF-κB (RELA), and IL-6/STAT3 using Pathway Commons Network Visualizer program. The relationships of inter-molecular interaction are shown in the inserted panel.

References

    1. Louis D.N., Perry A., Reifenberger G., von D.A., Figarella-Branger D., Cavenee W.K., Ohgaki H., Wiestler O.D., Kleihues P., Ellison D.W. The 2016 World Health Organization Classification of Tumors of the Central Nervous System: A summary. Acta Neuropathol. 2016;131:803–820. doi: 10.1007/s00401-016-1545-1. - DOI - PubMed
    1. Chandana S.R., Movva S., Arora M., Singh T. Primary brain tumors in adults. Am. Fam. Physician. 2008;77:1423–1430. - PubMed
    1. Urbanska K., Sokolowska J., Szmidt M., Sysa P. Glioblastoma multiforme—An overview. Contemp. Oncol. (Pozn.) 2014;18:307–312. - PMC - PubMed
    1. Ohka F., Natsume A., Wakabayashi T. Current trends in targeted therapies for glioblastoma multiforme. Neurol. Res. Int. 2012;2012:878425. doi: 10.1155/2012/878425. - DOI - PMC - PubMed
    1. Batash R., Asna N., Schaffer P., Francis N., Schaffer M. Glioblastoma Multiforme, Diagnosis and Treatment; Recent Literature Review. Curr. Med. Chem. 2017;24:3002–3009. doi: 10.2174/0929867324666170516123206. - DOI - PubMed