. 2020 Jan 1;12(1):113.
doi: 10.3390/cancers12010113.

Albumin Nano-Encapsulation of Piceatannol Enhances Its Anticancer Potential in Colon Cancer Via Downregulation of Nuclear p65 and HIF-1α

Affiliations

Albumin Nano-Encapsulation of Piceatannol Enhances Its Anticancer Potential in Colon Cancer Via Downregulation of Nuclear p65 and HIF-1α

Alaa A A Aljabali et al. Cancers (Basel). .

Erratum in

Abstract

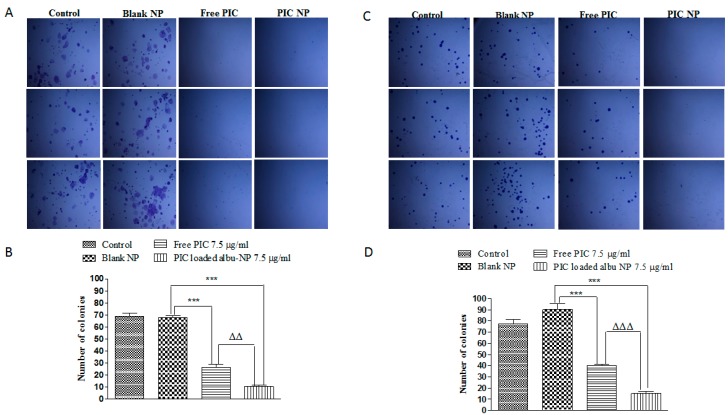
Piceatannol (PIC) is known to have anticancer activity, which has been attributed to its ability to block the proliferation of cancer cells via suppression of the NF-kB signaling pathway. However, its effect on hypoxia-inducible factor (HIF) is not well known in cancer. In this study, PIC was loaded into bovine serum albumin (BSA) by desolvation method as PIC-BSA nanoparticles (NPs). These PIC-BSA nanoparticles were assessed for in vitro cytotoxicity, migration, invasion, and colony formation studies and levels of p65 and HIF-1α. Our results indicate that PIC-BSA NPs were more effective in downregulating the expression of nuclear p65 and HIF-1α in colon cancer cells as compared to free PIC. We also observed a significant reduction in inflammation induced by chemical colitis in mice by PIC-BSA NPs. Furthermore, a significant reduction in tumor size and number of colon tumors was also observed in the murine model of colitis-associated colorectal cancer, when treated with PIC-BSA NPs as compared to free PIC. The overall results indicate that PIC, when formulated as PIC-BSA NPs, enhances its therpautice potential. Our work could prompt further research in using natural anticancer agents as nanoparticels with possiable human clinical trails. This could lead to the development of a new line of safe and effective therapeutics for cancer patients.

Keywords: HIF-1α; albumin nanoparticles; colon cancer; nuclear P65; piceatannol.


Conflict of interest statement

The authors declare no conflicts of interest.

Figures

Figure 1
Figure 1
Cellular uptake and in vitro cytotoxicity of PIC-loaded nanoparticle. Cellular uptake of optimized PIC-loaded albumin nanoparticles (NPs) in CaCo-2 and HT-29 cells at 100×. Cellular localization of Nile red-coated PIC-loaded albumin NPs was observed in CaCo-2 (A) and HT-29 (B) cells and visualized by overlapping under fluorescent microscopy. The red fluorescent can be observed in the microscopic images F2 in Figure 6A,B. The cytotoxicity assay was evaluated on CaCo-2 (C) and HT-29 (D) cell lines; 40 × 104 cells were seeded on 24-well plates and treated with 2.5, 5, and 7.5 µg/mL of PIC-loaded albumin NPs and an equivalent amount of free PIC. The absorbance was calculated after 24, 48, 72, and 96 h. PIC-loaded albumin NPs show higher cell cytotoxicity as compared to free PIC. Values are mean ± standard error of the mean (SEM) with n = 3. *** p < 0.001 compared with same amount of free drug.
Figure 2
Figure 2
Effect of PIC-loaded albumin nanoparticles on migration potential. Effect of PIC-loaded albumin NPs and free PIC on migration potential of CaCo-2 cell lines. The above image in (A) demonstrates the effect of free PIC and PIC-loaded albumin NPs on wound closure after 72 h of treatment. PIC-loaded albumin NPs demonstrate more void space than free PIC in the wound scratch of cell lines as compared to control and blank NPs. (B) depicts a significant variation of anti-migration activity of free PIC (p < 0.01) and PIC-loaded albumin NPs (p < 0.001) after 72 h of treatment at equal dose. Values are mean ± SEM with n = 3. ** p < 0.01, *** p < 0.001 compared with blank NPs. Similarly, (C,D) represents the effect of PIC-loaded albumin NPs and free PIC on migration potential of HT-29 cell lines. (C) shows the effect of free PIC and PIC-loaded albumin NPs on wound closure after 72 h of treatment. PIC-loaded albumin NPs demonstrate more void space than free PIC in the wound scratch of cell lines as compared to control and blank NPs. (D) shows a significant variation of anti-migration activity of free PIC (p < 0.01) and PIC-loaded albumin NPs (p < 0.001) after 72 h of treatment at equal dose. Values are mean ± SEM with n = 3. ** p < 0.01, *** p < 0.001 compared with blank NPs and ΔΔ p < 0.01 compared with the same dose of free PIC.
Figure 3
Figure 3
Effect of PIC-loaded albumin nanoparticles on colony formation effect of PIC-loaded albumin NPs and free PIC on colony formation ability of CaCo-2 cell lines. The above images in (A) show a pattern of colon formation in control, blank NPs, free PIC, and PIC-loaded albumin NPs treated the group as demonstrated in the microscopic images. (B) represents significant (p < 0.01) variation in colony formation upon treatment with free PIC and PIC-loaded albumin NPs. The PIC-loaded albumin NPs show a significantly lower number of colonies than free PIC. Values are mean ± SEM with n = 3. *** p < 0.001 compared with blank NPs. ΔΔ p < 0.01 compared with the same dose of free PIC. Similarly, (C,D) represents the effect of PIC-loaded albumin NPs and free PIC on colony formation ability of HT-29 cell lines. (C) shows a pattern of colony formation in control, blank NPs, free PIC, and PIC-loaded albumin NPs treated the group as demonstrated in the microscopic images. (D) represents (p < 0.001) variation in colony formation upon treatment with free PIC and PIC-loaded albumin NPs. The above figures reveal that PIC-loaded albumin NPs show a significantly lower number of colonies than free PIC. Values are mean ± SEM with n = 3. *** p < 0.001 compared with blank NPs. ΔΔΔ p < 0.001 compared with the same dose of free PIC.
Figure 4
Figure 4
Effect of PIC-loaded albumin nanoparticles on invasion potential Effect of PIC-loaded albumin NP and free PIC on invasion potential of CaCo-2 cell lines. (A) represents anti-invasive activity of free PIC and PIC-loaded albumin NPs after treatment. The cells which appear bright are the ones which invaded through the membrane. PIC-loaded albumin NPs show a significantly (p < 0.01) lower percentage of invasion than free PIC. (B) shows that PIC nanoparticles represent significantly less invasion than free PIC (p < 0.01). Values are mean ± SEM with n = 3. *** p < 0.001 compared with blank NPs. ΔΔ p < 0.01 compared with the same dose of free PIC. Similarly, (C,D) represents anti-invasive activity of free PIC and PIC-loaded albumin NPs after treatment in HT-29 cells. The cells which appear bright are the one swhich invaded through the membrane. (C) shows PIC-loaded albumin NPs show a significantly (p < 0.05) lower percentage of invasion than free PIC. (B) shows that the PIC nanoparticles have significantly less invasion than free PIC (p < 0.05). Values are mean ± SEM with n = 3. *** p < 0.001 compared with blank NPs. Δ p < 0.05 compared with the same dose of free PIC.
Figure 5
Figure 5
Effect of PIC-loaded albumin nanoparticles on the expression of p65. Effect of PIC-loaded albumin NPs and free PIC on the expression of p65 in CaCo-2 at 40×. (A) were captured under bright field microscopy. Control and blank images show induction of p65, whereas images under free PIC and PIC-loaded albumin NPs show a reduced level of p65. (B) shows a significant (p < 0.01) reduction in the level of p65. Values are mean ± SEM (n = 3). * p < 0.05 and ** p < 0.01 as compared to control. ΔΔ p < 0.01 compared to same amount of free PIC. Similarly (C) shows images captured under bright field microscopy in HT-29 cells at 40X. Control and blank images show induction of p65 whereas images under the free PIC and PIC-loaded albumin NP show a reduced level of p65. (D) reveals significant reduction in the level of p65. Values are mean ± SEM (n = 3). ** p < 0.01 and *** p < 0.001 as compare to control. ΔΔΔ p < 0.001 compared to same amount of free PIC.
Figure 6
Figure 6
Effect of PIC-loaded albumin nanoparticles on the expression of HIF-1α. Effect of PIC-loaded albumin NPs and free PIC on the expression HIF-1α in CaCo-2 (A) and HT-29 (B) at 40×. The above images shows induction of HIF-1α in control and blank transfected group, whereas images under free PIC and PIC-loaded albumin NPs show a reduced level of HIF-1α.
Figure 7
Figure 7
Effect of PIC-loaded albumin nanoparticles on inhibition of experimental colitis. Effect of PIC-loaded albumin NPs and free PIC on azoxymethane/dextran sodium sulphate-induced change in acute colitis (n = 10 per group). (A) Representative hematoxylin and eosin-stained histological sections of control (or negative control), healthy, free PIC, and PIC–BSA NP groups. (B) PI–BSA NPs prevent colitis, expressed as disease activity index. Data from the control (or negative control) group are all zeros from day 1 to day 14.
Figure 8
Figure 8
Effect of PIC-loaded albumin nanoparticles on tumor size, number of tumors, and body weight. The effect of PIC-loaded albumin NPs and free PIC on azoxymethane/dextran sodium sulphate-induced colon carcinogenesis (n = 10 per group). (A) The size of the tumor reduced significantly (p < 0.05) in the PIC–BSA NP group compared to the control (negative or blank). (B) Percentage body weight reduction was significant (p < 0.05) in PIC–BSA NPs. (C) Number of tumors reduced very significantly (p < 0.05) in PIC–BSA NPs compared to control, blank, and free PIC, respectively.

References

    1. Merrill R.M., Anderson A.E. Risk-adjusted colon and rectal cancer incidence rates in the United States. Dis. Colon Rectum. 2011;54:1301–1306. doi: 10.1097/DCR.0b013e3182242bd3. - DOI - PubMed
    1. Bray F., Ren J.-S., Masuyer E., Ferlay J. Global estimates of cancer prevalence for 27 sites in the adult population in 2008. Int. J. Cancer. 2013;132:1133–1145. doi: 10.1002/ijc.27711. - DOI - PubMed
    1. Ferlay J., Seorjomataram I., Dikshit R., Eser E., Mathers C., Rebelo M., Parkin D.M., Forman D., Bray F. Cancer incidence and mortality worldwide: Sources, methods and major patterns in GLOBOCAN 2012. Int. J. Cancer. 2015;136:E359–E386. doi: 10.1002/ijc.29210. - DOI - PubMed
    1. Data Were Provided by the Office for National Statistics on Request, July 2017. [(accessed on 26 April 2019)]; Available online: https://www.ons.gov.uk/peoplepopulationandcommunity/healthandsocialcare/....
    1. Santandreu F.M., Valle A., Oliver J., Roca P. Resveratrol potentiates the cytotoxic oxidative stress induced by chemotherapy in human colon cancer cells. Cell. Physiol. Biochem. 2011;28:219–228. doi: 10.1159/000331733. - DOI - PubMed

LinkOut - more resources