. 2020 Jan 2;11(1):50.
doi: 10.3390/genes11010050.

Consensify: A Method for Generating Pseudohaploid Genome Sequences from Palaeogenomic Datasets with Reduced Error Rates

Affiliations

Consensify: A Method for Generating Pseudohaploid Genome Sequences from Palaeogenomic Datasets with Reduced Error Rates

Axel Barlow et al. Genes (Basel). .

Abstract

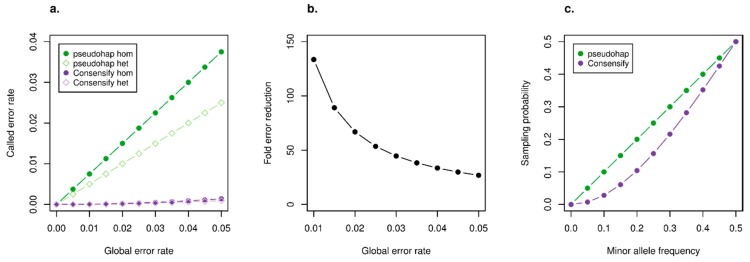
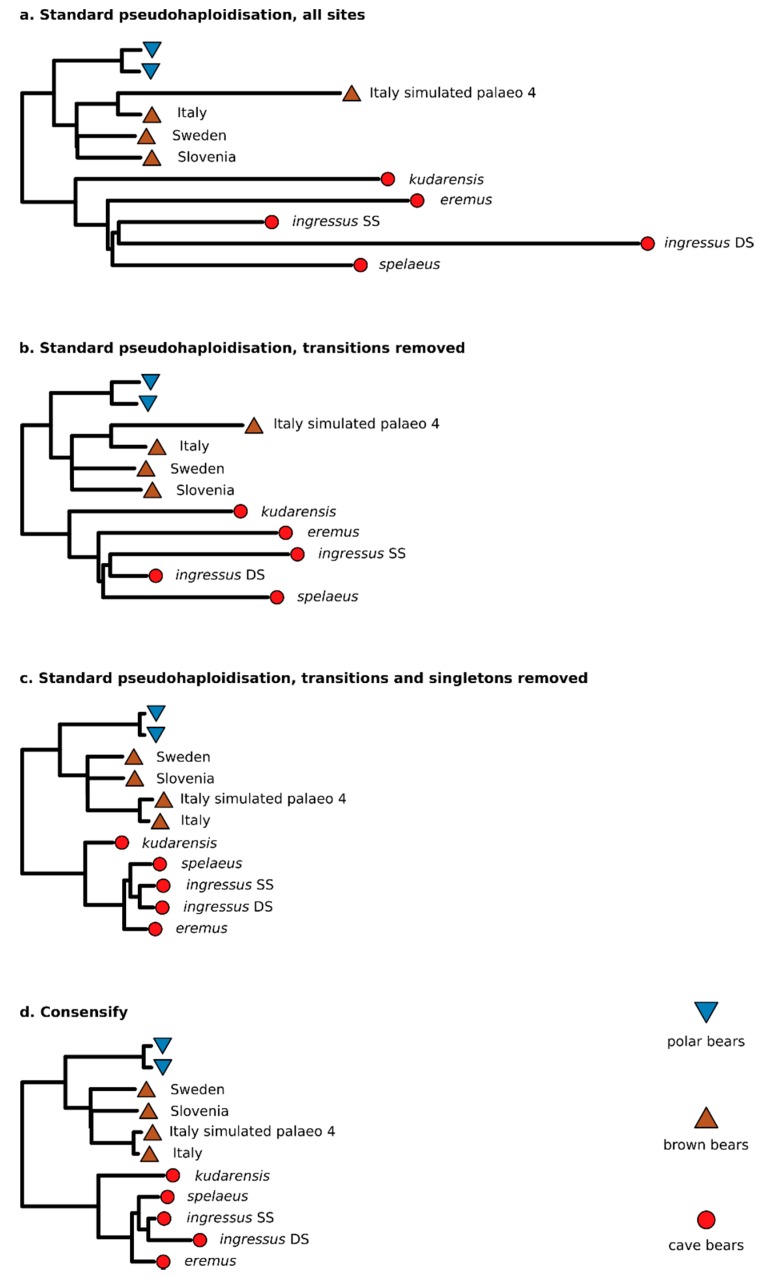
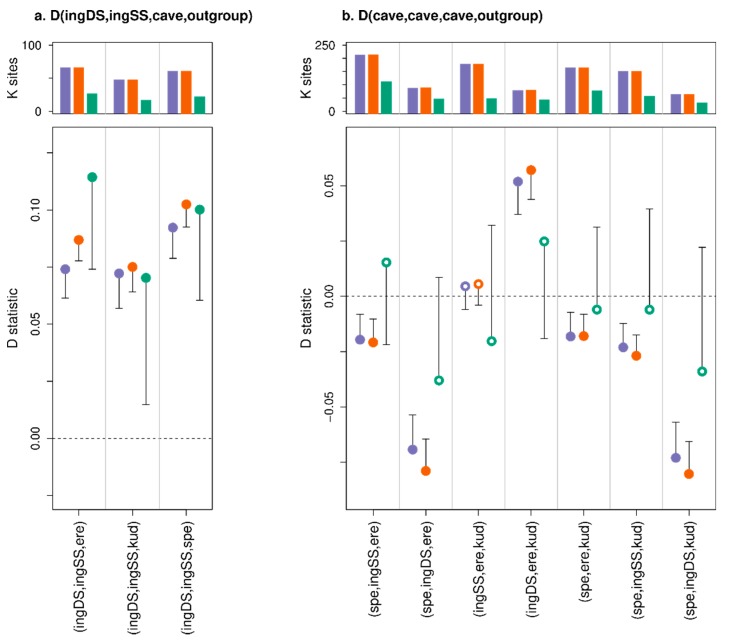
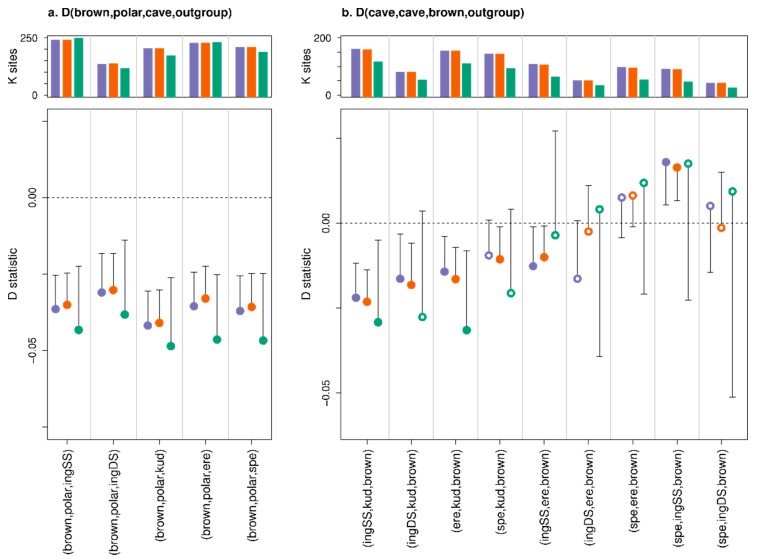
A standard practise in palaeogenome analysis is the conversion of mapped short read data into pseudohaploid sequences, frequently by selecting a single high-quality nucleotide at random from the stack of mapped reads. This controls for biases due to differential sequencing coverage, but it does not control for differential rates and types of sequencing error, which are frequently large and variable in datasets obtained from ancient samples. These errors have the potential to distort phylogenetic and population clustering analyses, and to mislead tests of admixture using D statistics. We introduce Consensify, a method for generating pseudohaploid sequences, which controls for biases resulting from differential sequencing coverage while greatly reducing error rates. The error correction is derived directly from the data itself, without the requirement for additional genomic resources or simplifying assumptions such as contemporaneous sampling. For phylogenetic and population clustering analysis, we find that Consensify is less affected by artefacts than methods based on single read sampling. For D statistics, Consensify is more resistant to false positives and appears to be less affected by biases resulting from different laboratory protocols than other frequently used methods. Although Consensify is developed with palaeogenomic data in mind, it is applicable for any low to medium coverage short read datasets. We predict that Consensify will be a useful tool for future studies of palaeogenomes.

Keywords: D statistics; ancient DNA; bioinformatics; error reduction; palaeogenomics; sequencing error.


Conflict of interest statement

The authors declare no conflict of interest.

Figures

Figure 1
Figure 1
Expected performance of Consensify compared with standard pseudohaploidisation, assuming equal base composition and equal error probabilities across all nucleotides. (a) Shows the expected called error rates (y axis) across a range of global error rates (x axis) for standard pseudohaploidisation (green) and Consensify (purple), for both homozygous sites (circles) and heterozygous sites (rhombuses). (b) Shows the fold-reduction in error rates achieved by using Consensify compared with pseudohaploidisation (y axis), for a range of global error rates (x axis). Note that the fold-reduction in error is equal for both homozygous and heterozygous sites. (c) Shows the probability of sampling (y axis) an allele which is underrepresented in the read stack (x axis) using Consensify and standard pseudohaploidisation.
Figure 2
Figure 2
Effect of Consensify on phylogenetic analysis. Panels show neighbour-joining phylogenetic trees calculated from datasets obtained by (a) standard pseudohaploidisation using all sites, (b) with transitions removed, (c) with transitions and singletons removed, and (d) Consensify. The trees are rooted using the Asiatic black bear as outgroup (not shown). Coloured symbols at the terminal tips indicate polar bears (blue triangles), brown bears (brown inverted triangles), and cave bears (red circles). The sampling localities of brown bears and the taxon names of cave bears are indicated. “Italy simulated palaeo 4” indicates the simulated palaeogenomic dataset with 35 bp fragment length, cytosine deamination and sequencing error. Note that the ingressus cave bear is represented twice, corresponding to datasets generated from sequencing libraries prepared using a single-stranded (SS) and a double-stranded (DS) protocol, respectively. Absolute branch lengths are not comparable among trees because each dataset includes different numbers of sites filtered in different ways. To improve visualisation of relative differences in branch lengths, the trees have been scaled so that the distance between the basal ingroup node and the terminal tips of the polar bear lineage are approximately equal. Polar bears show low genomic diversity [25] and are approaching complete lineage sorting [5], and thus represent the most stable element of the phylogeny with which to anchor the scaling of the trees.
Figure 3
Figure 3
Effect of Consensify on population clustering analysis. Panels show the ordination of individuals along the first (x axes) and second (y axes) coordinates of a principal coordinates analysis based on (a) standard pseudohaploidisation using all sites, (b) with transitions removed, (c) with transitions and singletons removed, and (d) Consensify. Coloured symbols are consistent with Figure 1, and, where appropriate, individual cave bears are indicated by the first three letters of their taxon name. “ingDS” and “ingSS” indicate the ingressus datasets generated using double- and single-stranded library preparation methods, respectively. “Italy sim. palaeo 4” and “Italy” indicate the simulated palaeogenomic dataset with 35 bp fragment length, cytosine deamination and sequencing error, and the unmodified modern Italian brown bear dataset, respectively.
Figure 4
Figure 4
Effect of Consensify on D statistic tests of admixture, evaluated using simulated palaeogenomic data. The tests are based on three brown bears with the relationship: (((P1 = Italy,P2 = Slovenia),P3 = Sweden),P4 = outgroup). Each panel displays results calculated using different outgroups: the closely related polar bear (a) and the more distantly related Asiatic black bear (b). The upper plot of each panel shows the number of D statistic informative sites (ABBA+BABA, y axes in thousands of sites) counted for each D statistic comparison (separated by grey vertical lines). For each comparison, three results are displayed sequentially from left to right, corresponding to the standard D statistic, the extended D statistic with error correction, and the D statistic calculated using Consensify. The lower plots show D values (y axes) as coloured points. Single error bars extending toward zero show the weighted block jackknife standard error multiplied by three, with error bars that bisect y = 0 (dashed horizontal line) being non-significant (Z < 3). Significant and non-significant D values are further indicated by closed and open points, respectively. The leftmost comparisons in each panel corresponds to the original, high-quality dataset, and does not provide evidence of admixture in any test. For each adjacent comparison, data from the Italian brown bear has been modified in silico to mimic specific properties of palaeogenomic datasets (x axes): short fragment length (35 or 50 bp), C⟶T substitutions increasing exponentially towards the terminal fragment ends (deamination), and increased global sequencing error (error). Any significant D values are therefore false positives resulting from the data modification. Note that y axes are consistent between both panels (a,b).
Figure 5
Figure 5
Effect of Consensify on D statistic tests of admixture among cave bear populations and datasets. The plot layout and annotation are consistent with Figure 4. Comparisons are described by x-axis labels, with the first three letters of each cave bear taxon indicating their respective positions as (P1,P2,P3). The outgroup (P4) is the Asiatic black bear. The left panel (a) shows comparisons with datasets generated from the same ingressus cave bear individual as P1 and P2, corresponding, respectively, to datasets generated using either the single-stranded (SS) or the double-stranded (DS) library protocol. The right panel (b) shows all comparisons compatible with the cave bear phylogeny (see Figure 1 and Figure 3): (((ingressus,spelaeus),eremus),kudarensis). Note that y axes are not consistent between panels (a,b).
Figure 6
Figure 6
Effect of Consensify on D statistic tests of admixture among cave bears and brown bears subsequent to the divergence of polar bears and brown bears (a), and subsequent to the divergence of the sampled cave bear populations (b). The plot layout and annotation are consistent with Figure 4 and Figure 5. The polar bear and brown bear lineages are each represented by a single individual (SRS412584 and 191Y Slovenia, respectively). Comparisons are described by x axis labels, with either the first three letters of each cave bear taxon, or “polar” for the polar bear and “brown” for the brown bear, indicating their respective positions as (P1,P2,P3). The outgroup (P4) is the Asiatic black bear. Note that y axes are not consistent between panels (a,b).
Figure 7
Figure 7
Evolutionary relationships among bears estimated using Consensify. For these analyses, the ingressus cave bear dataset generated using the double-stranded library protocol (ingressus DS) has been excluded to achieve consistency of methods across all cave bears. (a) Maximum-likelihood tree assuming a phylogenetic model of evolution and a GTR+GAMMA model of nucleotide substitution, rooted using an Asiatic black bear as outgroup (not shown). Coloured symbols and tip labels are consistent with Figure 1. (b) Ordination of the same individuals along the first (x axis) and second (y axis) coordinates of a principal coordinates analysis.

References

    1. Briggs A.W., Stenzel U., Johnson P.L.F., Green R.E., Kelso J., Prüfer K., Meyer M., Krause J., Ronan M.T., Lachmann M., et al. Patterns of damage in genomic DNA sequences from a Neandertal. Proc. Natl. Acad. Sci. USA. 2007;104:14616–14621. doi: 10.1073/pnas.0704665104. - DOI - PMC - PubMed
    1. Brotherton P., Endicott P., Sanchez J.J., Beaumont M., Barnett R., Austin J., Cooper A. Novel high-resolution characterization of ancient DNA reveals C > U-type base modification events as the sole cause of post mortem miscoding lesions. Nucleic Acids Res. 2007;35:5717–5728. doi: 10.1093/nar/gkm588. - DOI - PMC - PubMed
    1. Heyn P., Stenzel U., Briggs A.W., Kircher M., Hofreiter M., Meyer M. Road blocks on paleogenomes—Polymerase extension profiling reveals the frequency of blocking lesions in ancient DNA. Nucleic Acids Res. 2010;38:e161. doi: 10.1093/nar/gkq572. - DOI - PMC - PubMed
    1. Hofreiter M., Jaenicke V., Serre D., von Haeseler A., Pääbo S. DNA sequences from multiple amplifications reveal artifacts induced by cytosine deamination in ancient DNA. Nucleic Acids Res. 2001;29:4793–4799. doi: 10.1093/nar/29.23.4793. - DOI - PMC - PubMed
    1. Barlow A., Cahill J.A., Hartmann S., Theunert C., Xenikoudakis G., Fortes G.G., Paijmans J.L.A., Rabeder G., Frischauf C., Grandal-d’Anglade A., et al. Partial genomic survival of cave bears in living brown bears. Nat. Ecol. Evol. 2018;2:1563. doi: 10.1038/s41559-018-0654-8. - DOI - PMC - PubMed

Publication types

LinkOut - more resources