. 2020 Jan 2;21(1):318.
doi: 10.3390/ijms21010318.

Differential Subcellular Distribution and Translocation of Seven 14-3-3 Isoforms in Response to EGF and During the Cell Cycle

Affiliations

Differential Subcellular Distribution and Translocation of Seven 14-3-3 Isoforms in Response to EGF and During the Cell Cycle

Abdalla Abdrabou et al. Int J Mol Sci. .

Abstract

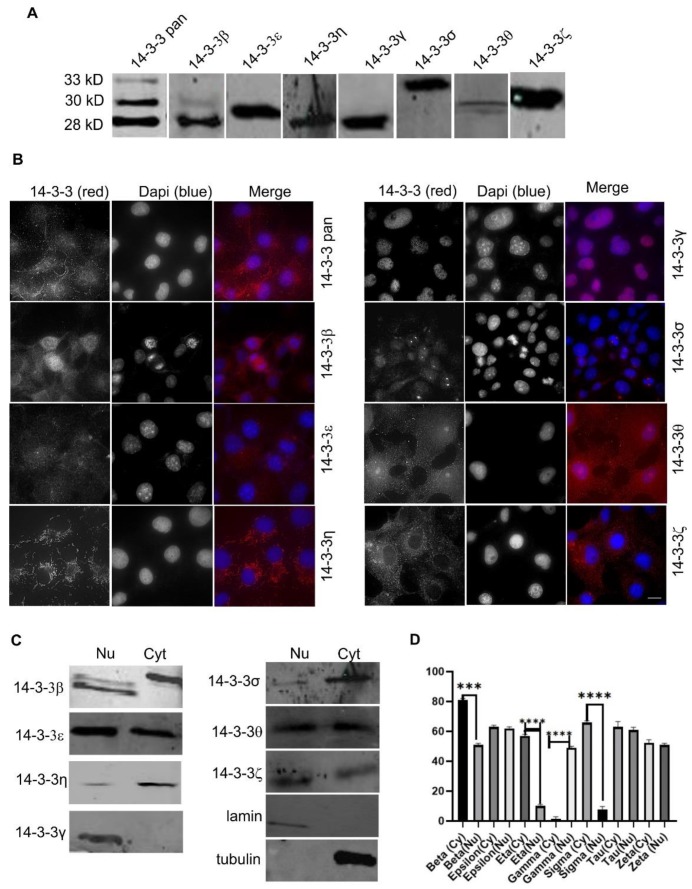
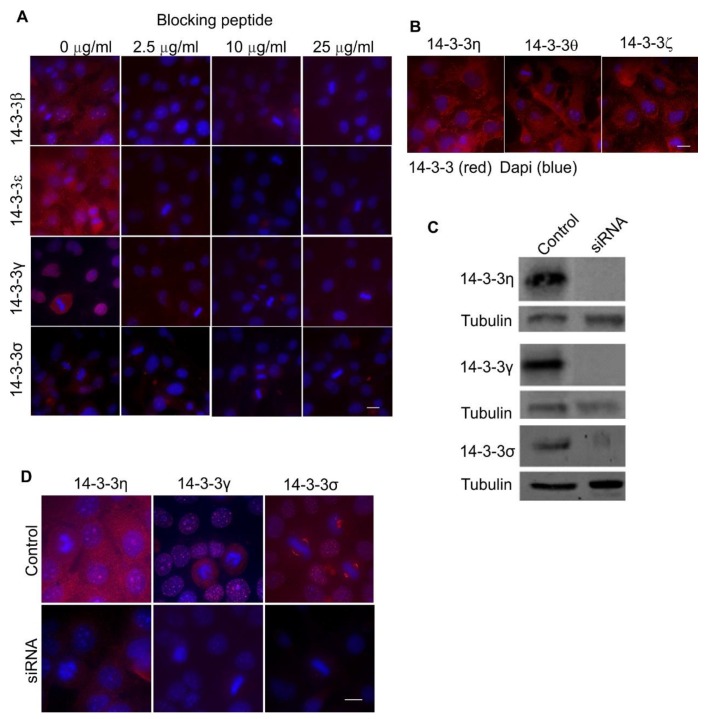
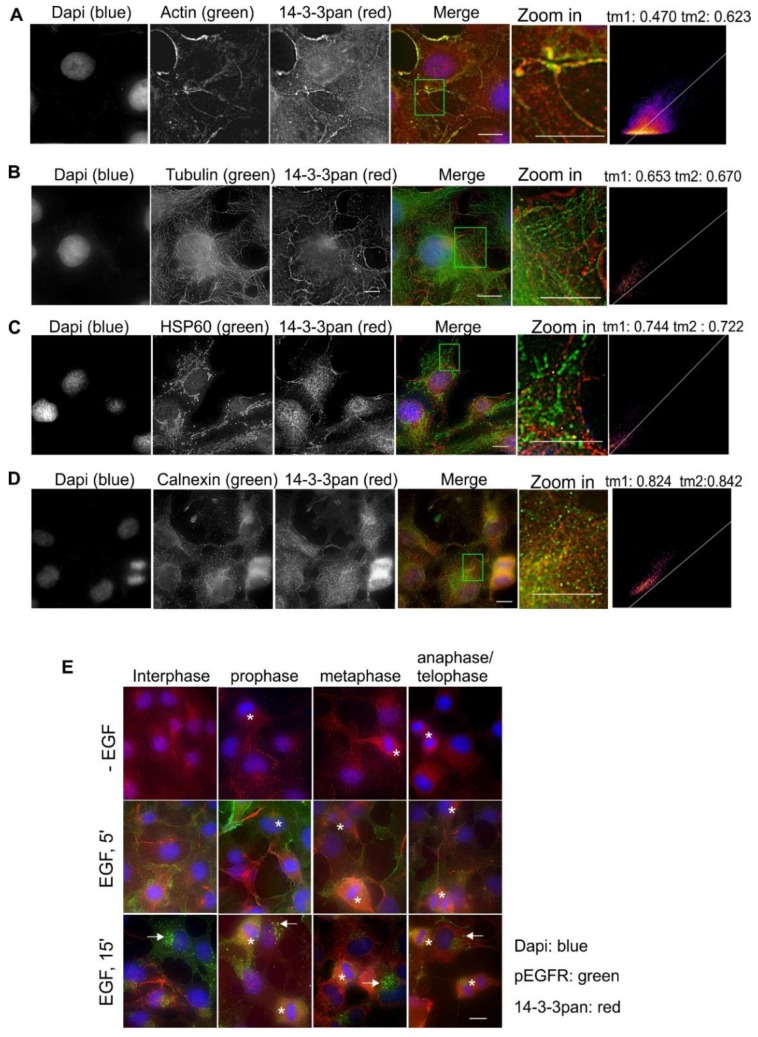
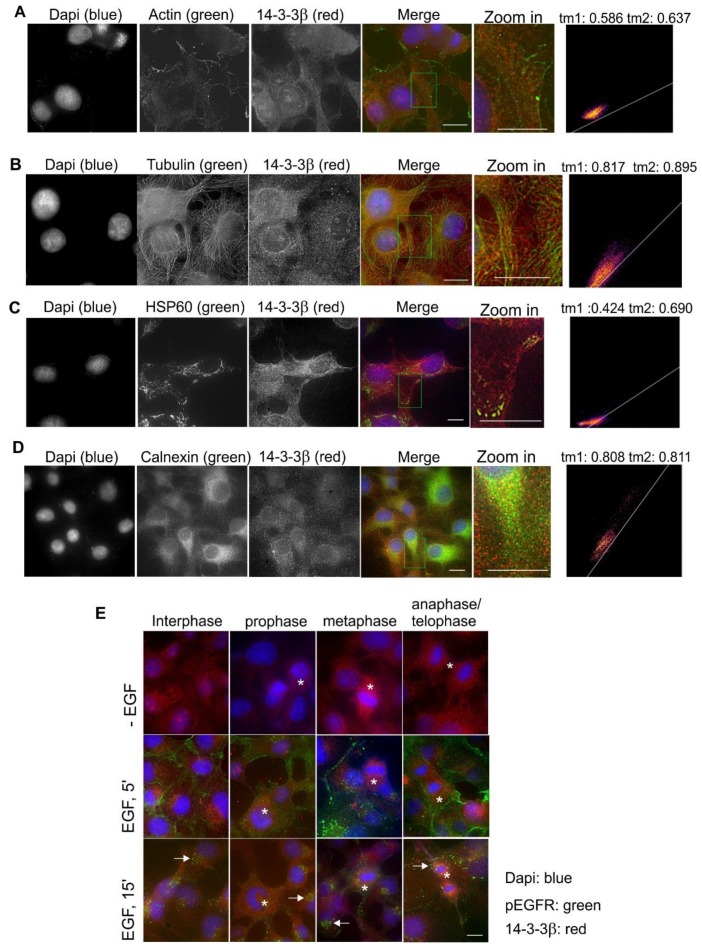
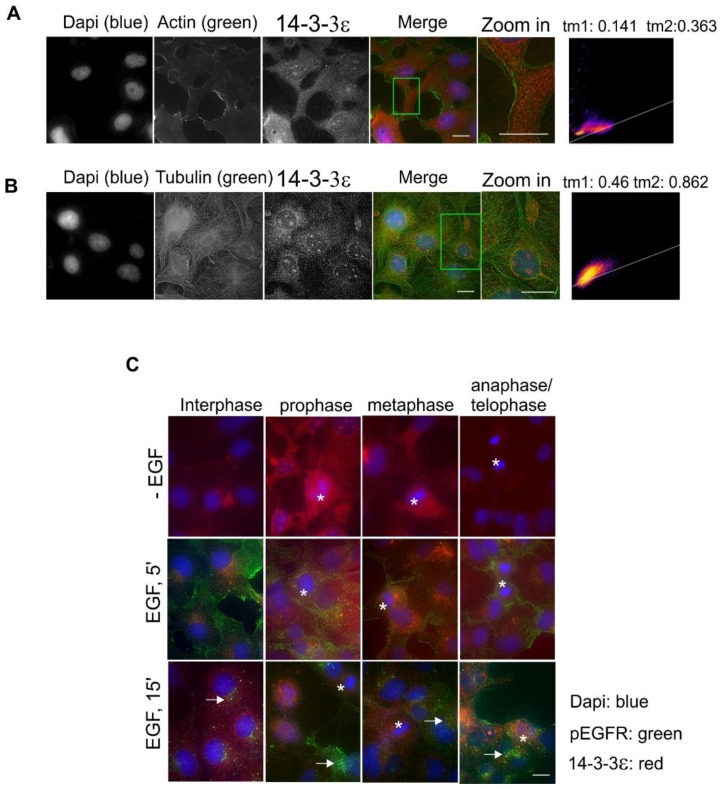
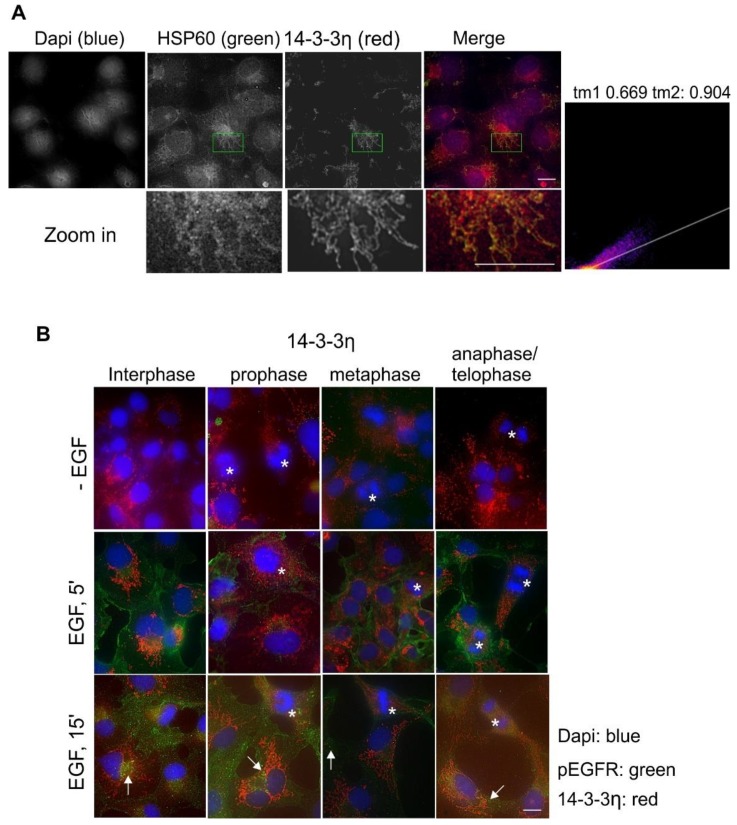
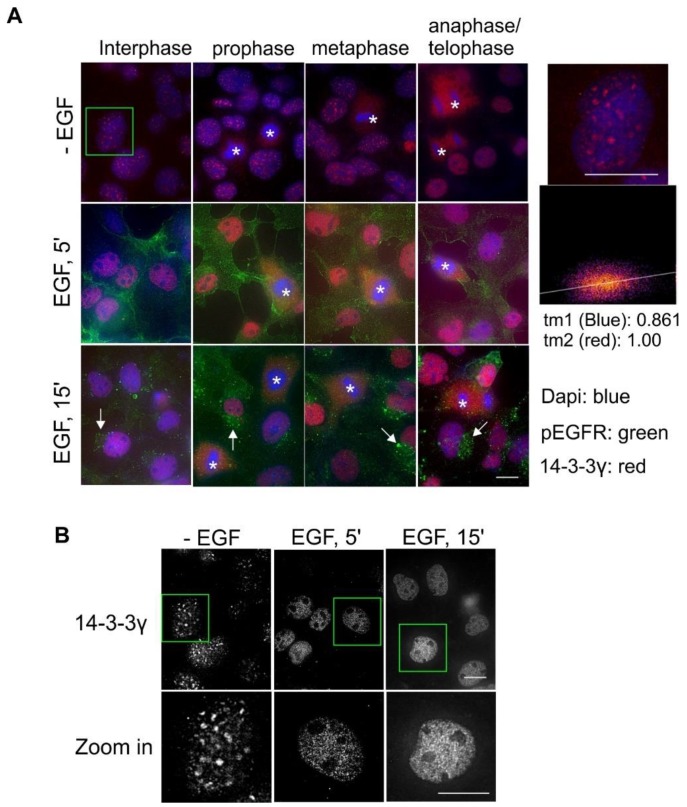
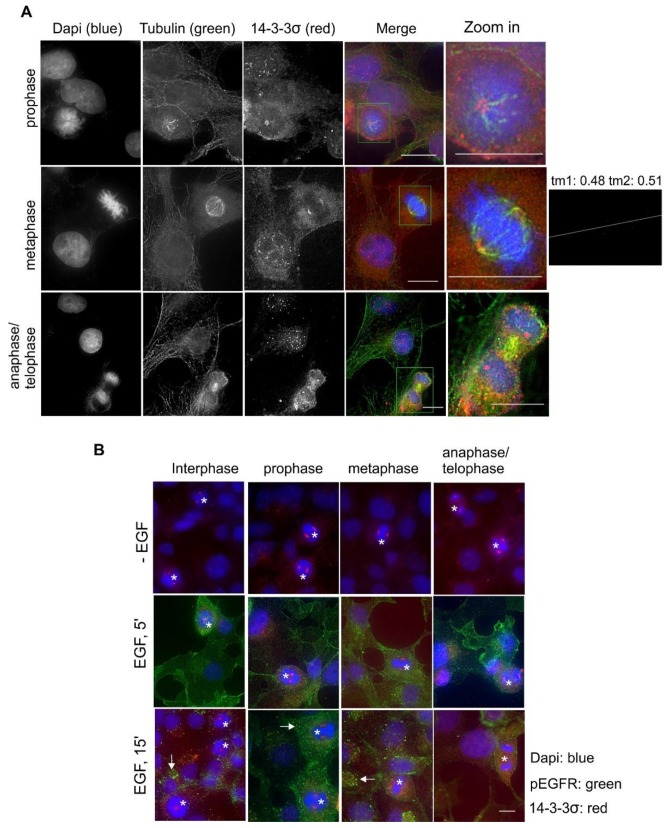
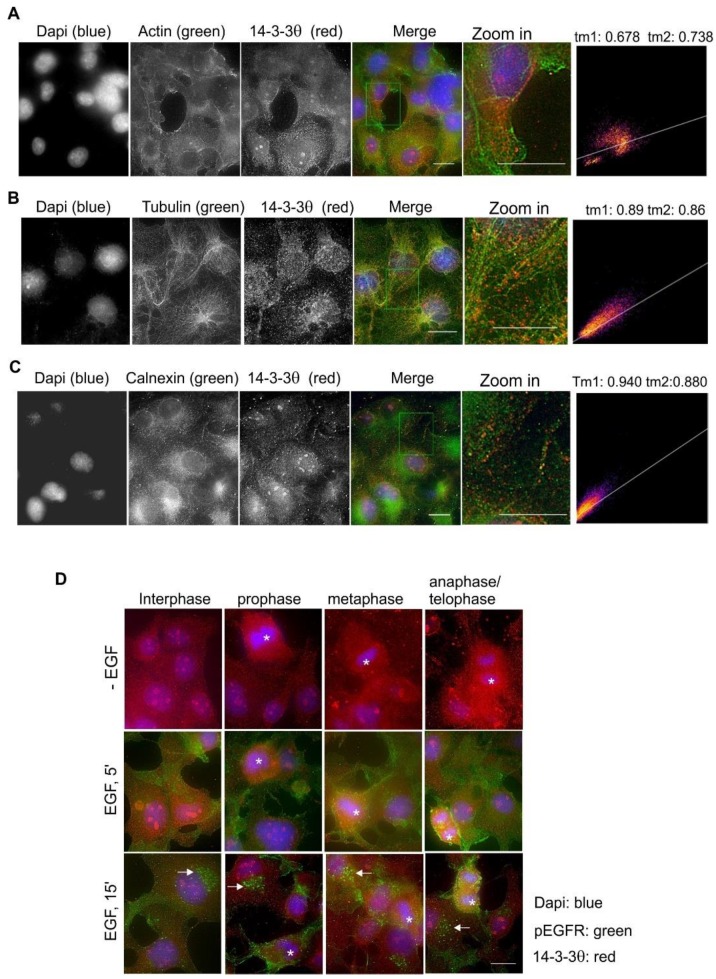
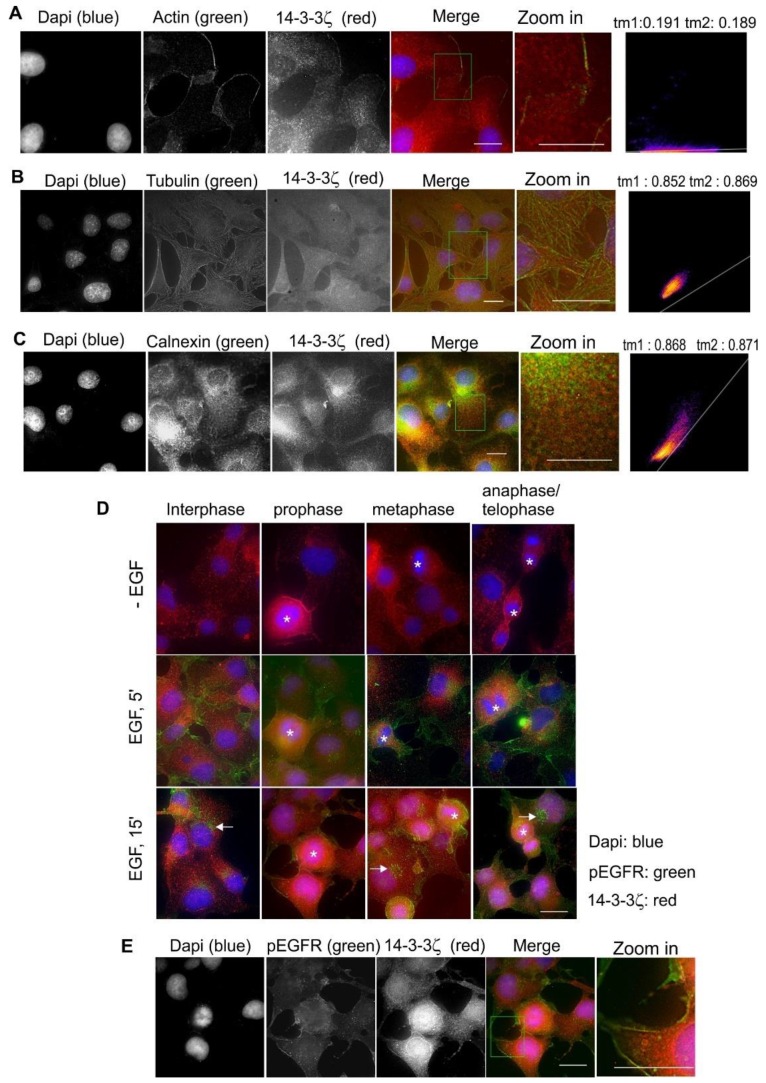
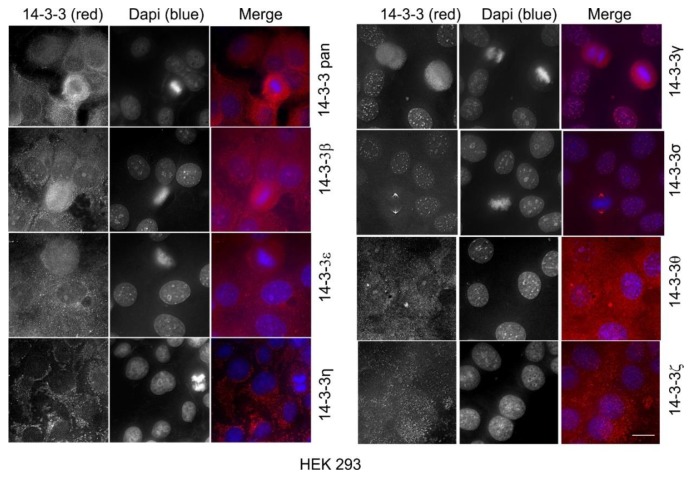
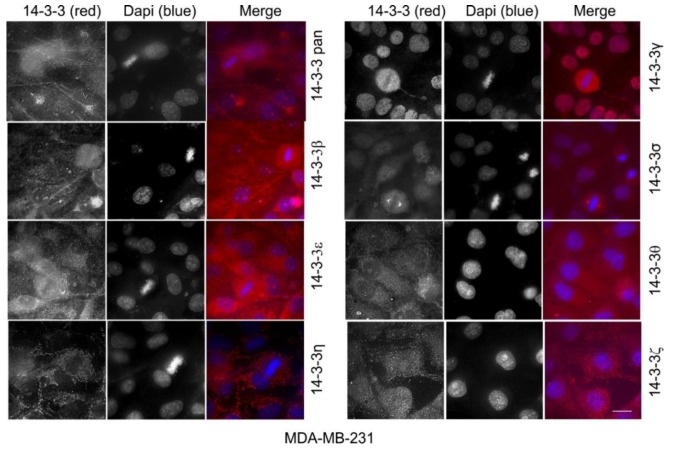
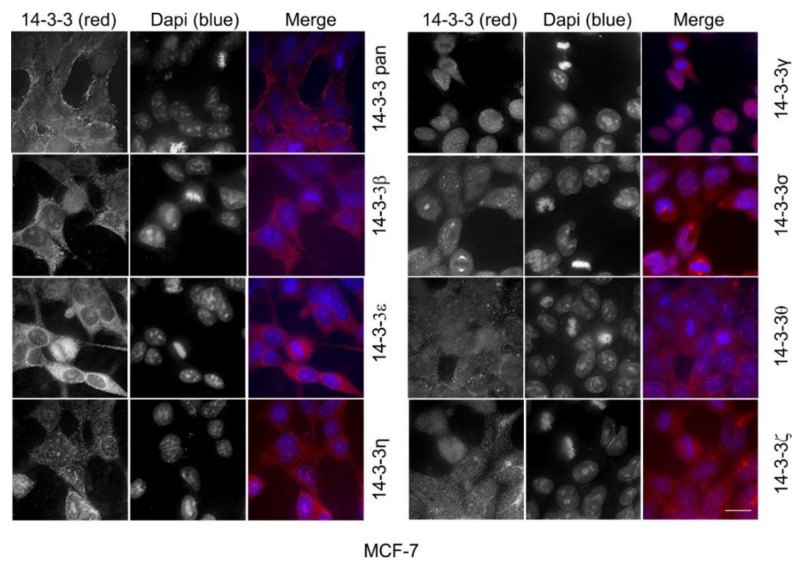
Multiple isoforms of 14-3-3 proteins exist in different organisms. In mammalian cells, 14-3-3 protein has seven isoforms (α/β, ε, η, γ, σ, θ/τ, and δ/ζ), with α and δ representing the phosphorylated versions of β and ζ, respectively. While the existence of multiple isoforms may represent one more level of regulation in 14-3-3 signaling, our knowledge regarding the isoform-specific functions of 14-3-3 proteins is very limited. Determination of the subcellular localization of the different 14-3-3 isoforms could give us important clues of their specific functions. In this study, by using indirect immunofluorescence, subcellular fractionation, and immunoblotting, we studied the subcellular localization of the total 14-3-3 protein and each of the seven 14-3-3 isoforms; their redistribution throughout the cell cycle; and their translocation in response to EGF in Cos-7 cells. We showed that 14-3-3 proteins are broadly distributed throughout the cell and associated with many subcellular structures/organelles, including the plasma membrane (PM), mitochondria, ER, nucleus, microtubules, and actin fibers. This broad distribution underlines the multiple functions identified for 14-3-3 proteins. The different isoforms of 14-3-3 proteins have distinctive subcellular localizations, which suggest their distinctive cellular functions. Most notably, 14-3-3ƞ is almost exclusively localized to the mitochondria, 14-3-3γ is only localized to the nucleus, and 14-3-3σ strongly and specifically associated with the centrosome during mitosis. We also examined the subcellular localization of the seven 14-3-3 isoforms in other cells, including HEK-293, MDA-MB-231, and MCF-7 cells, which largely confirmed our findings with Cos-7 cells.

Keywords: 14-3-3 proteins; actin fibers; and microtubules; centrosome; isoforms; mitochondria; nucleus; subcellular localization.


Conflict of interest statement

The authors declare no conflict of interest.

Figures

Figure 1
Figure 1
Subcellular localization of total 14-3-3 protein and the seven 14-3-3 isoforms in Cos-7 cells. The total 14-3-3 protein was determined by a pan14-3-3 antibody. Each 14-3-3 isoform was determined by antibodies to each specific isoform. Immunoblotting, immunofluorescence, and subcellular fractionation were performed as described in Materials and Methods. (A) The expression level of total protein and seven isoforms of 14-3-3 protein by immunoblotting in Cos-7 cells. The expression of tubulin was used as a control. (B) Subcellular localization of pan14-3-3 and seven 14-3-3 isoforms in Cos-7 cells by immunofluorescence. 14-3-3 proteins were revealed by TRITC (red) and the chromatin was stained by DAPI (blue). Scale bar = 10 µm. (C) Nuclear and cytoplasmic localization of 14-3-3 proteins by subcellular fractionation followed by immunoblotting. A-Tubulin was used as a marker for cytoplasm and lamin A was used as a marker for the nucleus. (D) Quantification of the results from (C). each value is the average of three experiments and the error bar is the standard error. **** p < 0.0001; *** p < 0.001.
Figure 2
Figure 2
Control experiments to determine the specificities of the antibodies used in Figure 1 by indirect immunofluorescence in Cos-7 cells. (A) The effects of blocking peptides for 14-3-3β, ε, γ, and σ. The indirect immunofluorescence experiments were performed as described for Figure 1, except that the antibodies were incubated with blocking peptides of the indicated concentration for 1 h prior to incubation with the cells. (B) The subcellular localizations of 14-3-3η, θ, and ζ were determined by antibodies different from those used in Figure 1; (C) 14-3-3η, γ, and σ were knocked down in HEK 293 cells by siRNA, and the expressions of these isoforms were examined by immunoblotting with the corresponding antibodies. (D) 14-3-3η, γ, and σ were knocked down in HEK 293 cells by siRNA and the expressions of these isoforms were examined by indirect immunofluorescence with the corresponding antibodies. Scale bar = 10 µm.
Figure 3
Figure 3
Subcellular localization of the pan14-3-3 protein in Cos-7 cells by double indirect immunofluorescence. (A) Co-localization of pan14-3-3 (red) and actin (green); (B) co-localization of pan14-3-3 protein (red) and tubulin (green); (C) co-localization of pan14-3-3 protein (red) and HSP60 (green); (D) co-localization of pan14-3-3 protein (red) and calnexin (green). For (AD), the zoomed-in areas were used to calculate Mander’s coefficients. (E) Subcellular localization of pan14-3-3 protein during the cell cycle and in response to EGF. With or without EGF stimulation, pan14-3-3 proteins (red) and pEGFR (green) were revealed by double indirect immunofluorescence. Mitotic cells are labeled by * and endosomes are marked by arrows. Scale bar = 10 μm.
Figure 4
Figure 4
Subcellular localization of 14-3-3β in Cos-7 cells by double indirect immunofluorescence. (A) Co-localization of 14-3-3β (red) and actin (green); (B) co-localization of 14-3-3β (red) and tubulin (green); (C) co-localization of 14-3-3β (red) and HSP60 (green); (D) co-localization of 14-3-3β (red) and calnexin (green). For (AD), the zoomed-in areas were used to calculate Mander’s coefficients. (E) Subcellular localization of 14-3-3β during the cell cycle and in response to EGF. With or without EGF stimulation, 14-3-3β (red) and pEGFR (green) were revealed by double indirect immunofluorescence. Mitotic cells are labeled by * and endosomes are marked by arrows. Scale bar = 10 μm.
Figure 5
Figure 5
Subcellular localization of 14-3-3ε in Cos-7 cells by double indirect immunofluorescence. (A) Co-localization of 14-3-3ε (red) and actin (green); (B) co-localization of 14-3-3ε (red) and tubulin (green). For (A,B), the zoomed-in areas were used to calculate Mander’s coefficients. (C) Subcellular localization of 14-3-3ε during the cell cycle and in response to EGF. With or without EGF stimulation, 14-3-3ε (red) and pEGFR (green) were revealed by double indirect immunofluorescence. Mitotic cells are labeled by * and endosomes are marked by arrows. Scale bar = 10 μm.
Figure 6
Figure 6
Subcellular localization of 14-3-3η in Cos-7 cells by double indirect immunofluorescence. (A) Co-localization of 14-3-3η (red) and HSP60 (green). The zoomed-in areas were used to calculate Mander’s coefficients. (B) Subcellular localization of 14-3-3η during the cell cycle and in response to EGF. With or without EGF stimulation, 14-3-3η (red) and pEGFR (green) were revealed by double indirect immunofluorescence. Mitotic cells are labeled by * and endosomes are marked by arrows. Scale bar = 10 μm.
Figure 7
Figure 7
Subcellular localization of 14-3-3γ in Cos-7 cells by double indirect immunofluorescence. (A) Subcellular localization of 14-3-3γ during the cell cycle and in response to EGF. With or without EGF stimulation, 14-3-3γ (red) and pEGFR (green) were revealed by double indirect immunofluorescence. Mitotic cells are labeled by * and endosomes are marked by arrows. The zoomed-in areas were used to calculate Mander’s coefficients between blue and red channels. (B) Black and white images highlight the changes in the 14-3-3γ stain. The three images are the same as the three images in the far left panel in (A). Scale bar = 10 μm.
Figure 8
Figure 8
Subcellular localization of 14-3-3σ in Cos-7 cells by double indirect immunofluorescence. (A) Co-localization of 14-3-3σ (red) and tubulin (green) during mitosis. The zoomed-in areas were used to calculate Mander’s coefficients. (B) Subcellular localization of 14-3-3σ during the cell cycle and in response to EGF. With or without EGF stimulation, 14-3-3σ (red) and pEGFR (green) were revealed by double indirect immunofluorescence. Mitotic cells are labeled by * and endosomes are marked by arrows. Scale bar = 10 μm.
Figure 9
Figure 9
Subcellular localization of 14-3-3θ in Cos-7 cells by double indirect immunofluorescence. (A) Co-localization of 14-3-3θ (red) and actin (green); (B) co-localization of 14-3-3θ (red) and tubulin (green); (C) co-localization of 14-3-3θ (red) and calnexin (green). For (AC), the zoomed-in areas were used to calculate Mander’s coefficients. (D) Subcellular localization of 14-3-3θ during the cell cycle and in response to EGF. With or without EGF stimulation, 14-3-3θ (red) and pEGFR (green) were revealed by double indirect immunofluorescence. Mitotic cells are labeled by * and endosomes are marked by arrows. Scale bar = 10 μm.
Figure 10
Figure 10
Subcellular localization of 14-3-3ζ in Cos-7 cells by double indirect immunofluorescence. (A) Co-localization of 14-3-3ζ (red) and actin (green); (B) co-localization of 14-3-3ζ (red) and tubulin (green); (C) co-localization of 14-3-3ζ (red) and calnexin (green). (D) Subcellular localization of 14-3-3ζ during the cell cycle and in response to EGF. With or without EGF stimulation, 14-3-3ζ (red) and pEGFR (green) were revealed by double indirect immunofluorescence. (E) Co-localization of 14-3-3ζ (red) and pEGFR (green) following EGF stimulation for 5 min. Mitotic cells are labeled by * and endosomes are marked by arrows. Scale bar = 10 μm.
Figure 11
Figure 11
Subcellular localization of the total 14-3-3 protein and the seven 14-3-3 isoforms in HEK 293 cells by immunofluorescence. The total 14-3-3 protein was determined by a pan14-3-3 antibody. Each 14-3-3 isoform was determined by antibodies to each specific isoform. Immunoblotting, immunofluorescence, and subcellular fractionation were performed as described in Materials and Methods. 14-3-3 proteins were revealed by TRITC (red) and the chromatin was stained by DAPI (blue). Scale bar = 10 µm.
Figure 12
Figure 12
Subcellular localization of the total 14-3-3 protein and the seven 14-3-3 isoforms in MDA-MB-231 cells by immunofluorescence. The total 14-3-3 proteins were determined by a pan14-3-3 antibody. Each 14-3-3 isoform was determined by antibodies to each specific isoform. Immunoblotting, immunofluorescence, and subcellular fractionation were performed as described in Materials and Methods. 14-3-3 proteins were revealed by TRITC (red) and the chromatin was stained by DAPI (blue). Scale bar = 10 µm.
Figure 13
Figure 13
Subcellular localization of the total 14-3-3 protein and the seven 14-3-3 isoforms in MCF-7 cells by immunofluorescence. The total 14-3-3 proteins were determined by a pan14-3-3 antibody. Each 14-3-3 isoform was determined by antibodies to each specific isoform. Immunoblotting, immunofluorescence, and subcellular fractionation were performed as described in Materials and Methods. 14-3-3 proteins were revealed by TRITC (red) and the chromatin was stained by DAPI (blue). Scale bar = 10 µm.

Similar articles

Cited by

References

    1. Thomas D., Guthridge M., Woodcock J., Lopez A. 14-3-3 protein Signal. in development and growth factor responses. Curr. Top. Dev. Biol. 2005;67:285–303. - PubMed
    1. Ichimura T., Isobe T., Okuyama T., Takahashi N., Araki K., Kuwano R., Takahashi Y. Molecular cloning of cDNA coding for brain-specific 14-3-3 protein, a protein kinase-dependent activator of tyrosine and tryptophan hydroxylases. Proc. Natl. Acad. Sci. USA. 1988;85:7084–7088. doi: 10.1073/pnas.85.19.7084. - DOI - PMC - PubMed
    1. Toker A., Sellers L.A., Amess B., Patel Y., Harris A., Aitken A. Multiple isoforms of a protein kinase C inhibitor (KCIP-1/14-3-3) from sheep brain. Amino acid sequence of phosphorylated forms. Eur. J. Biochem. 1992;206:453–461. doi: 10.1111/j.1432-1033.1992.tb16946.x. - DOI - PubMed
    1. Gardino A.K., Yaffe M.B. 14-3-3 proteins as signaling integration points for cell cycle control and apoptosis. Semin. Cell Dev. Biol. 2011;22:688–695. doi: 10.1016/j.semcdb.2011.09.008. - DOI - PMC - PubMed
    1. Aghazadeh Y., Papadopoulos V. The role of the 14-3-3 protein family in health, disease, and drug development. Drug Discov. Today. 2016;21:278–287. doi: 10.1016/j.drudis.2015.09.012. - DOI - PubMed

MeSH terms

LinkOut - more resources