

Childhood malaria case incidence in Malawi between 2004 and 2017: spatio-temporal modelling of climate and non-climate factors
- PMID: 31906963
- PMCID: PMC6945411
- DOI: 10.1186/s12936-019-3097-z
Childhood malaria case incidence in Malawi between 2004 and 2017: spatio-temporal modelling of climate and non-climate factors
Abstract
Background: Malaria transmission is influenced by a complex interplay of factors including climate, socio-economic, environmental factors and interventions. Malaria control efforts across Africa have shown a mixed impact. Climate driven factors may play an increasing role with climate change. Efforts to strengthen routine facility-based monthly malaria data collection across Africa create an increasingly valuable data source to interpret burden trends and monitor control programme progress. A better understanding of the association with other climatic and non-climatic drivers of malaria incidence over time and space may help guide and interpret the impact of interventions.
Methods: Routine monthly paediatric outpatient clinical malaria case data were compiled from 27 districts in Malawi between 2004 and 2017, and analysed in combination with data on climatic, environmental, socio-economic and interventional factors and district level population estimates. A spatio-temporal generalized linear mixed model was fitted using Bayesian inference, in order to quantify the strength of association of the various risk factors with district-level variation in clinical malaria rates in Malawi, and visualized using maps.
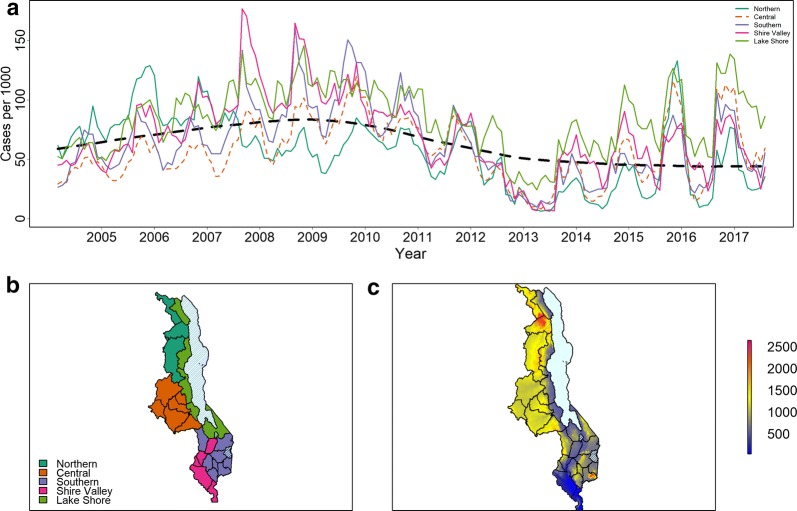
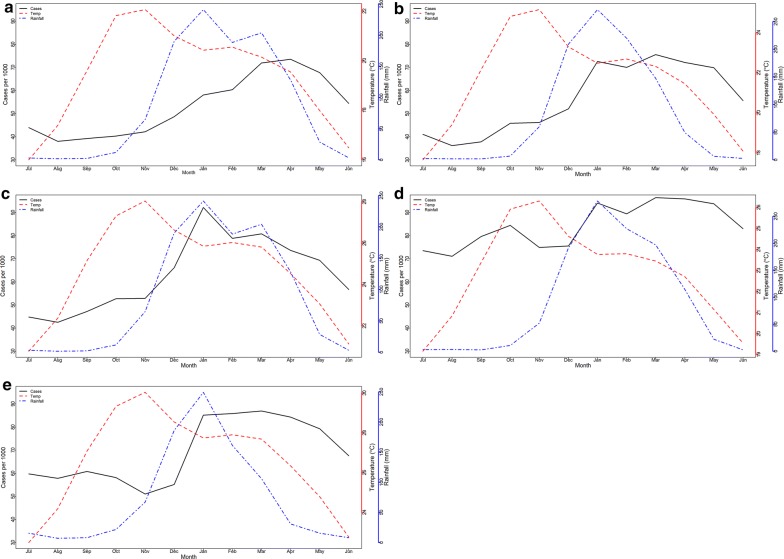
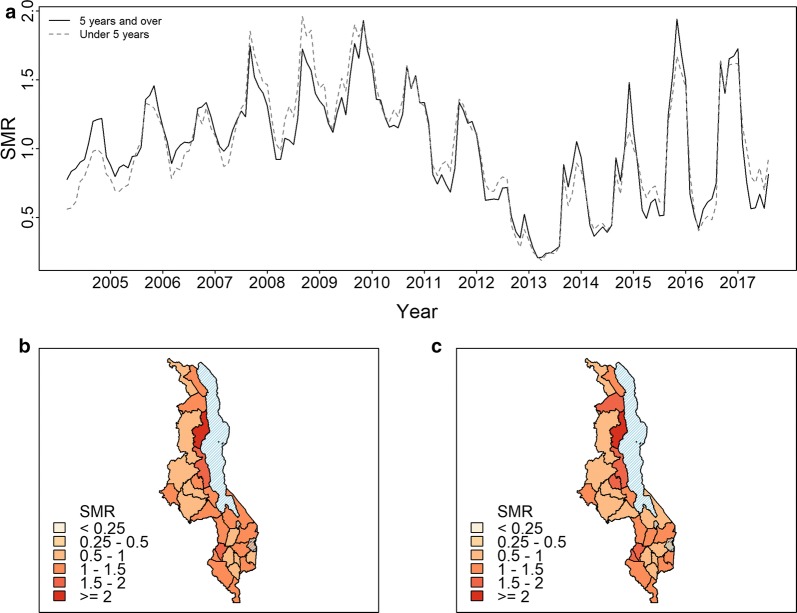
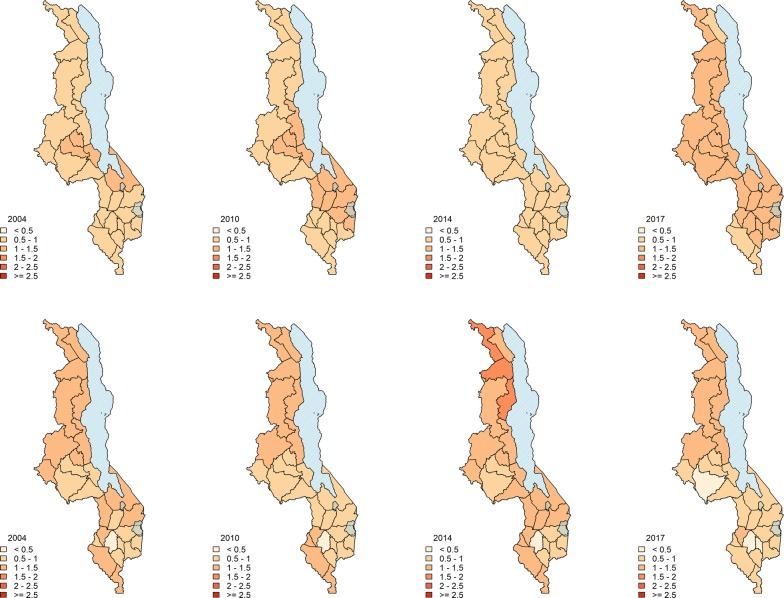
Results: Between 2004 and 2017 reported childhood clinical malaria case rates showed a slight increase, from 50 to 53 cases per 1000 population, with considerable variation across the country between climatic zones. Climatic and environmental factors, including average monthly air temperature and rainfall anomalies, normalized difference vegetative index (NDVI) and RDT use for diagnosis showed a significant relationship with malaria incidence. Temperature in the current month and in each of the 3 months prior showed a significant relationship with the disease incidence unlike rainfall anomaly which was associated with malaria incidence at only three months prior. Estimated risk maps show relatively high risk along the lake and Shire valley regions of Malawi.
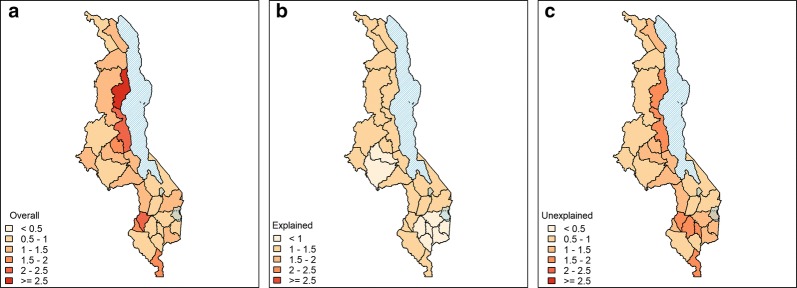
Conclusion: The modelling approach can identify locations likely to have unusually high or low risk of malaria incidence across Malawi, and distinguishes between contributions to risk that can be explained by measured risk-factors and unexplained residual spatial variation. Also, spatial statistical methods applied to readily available routine data provides an alternative information source that can supplement survey data in policy development and implementation to direct surveillance and intervention efforts.
Keywords: Climate; Malaria; Spatio-temporal; Statistical model; Vectors.
Conflict of interest statement
The authors declare that they have no competing interests.
Figures
Similar articles
-
Relative importance of climatic, geographic and socio-economic determinants of malaria in Malawi.Malar J. 2013 Nov 14;12:416. doi: 10.1186/1475-2875-12-416. Malar J. 2013. PMID: 24228784 Free PMC article.
-
Interactions between climatic changes and intervention effects on malaria spatio-temporal dynamics in Uganda.Parasite Epidemiol Control. 2018 Apr 26;3(3):e00070. doi: 10.1016/j.parepi.2018.e00070. eCollection 2018 Aug. Parasite Epidemiol Control. 2018. PMID: 29988311 Free PMC article.
-
High-resolution spatio-temporal risk mapping for malaria in Namibia: a comprehensive analysis.Malar J. 2024 Oct 5;23(1):297. doi: 10.1186/s12936-024-05103-w. Malar J. 2024. PMID: 39367414 Free PMC article.
-
Remote Sensing-Driven Climatic/Environmental Variables for Modelling Malaria Transmission in Sub-Saharan Africa.Int J Environ Res Public Health. 2016 Jun 14;13(6):584. doi: 10.3390/ijerph13060584. Int J Environ Res Public Health. 2016. PMID: 27314369 Free PMC article. Review.
-
Insights and challenges of insecticide resistance modelling in malaria vectors: a review.Parasit Vectors. 2024 Apr 3;17(1):174. doi: 10.1186/s13071-024-06237-1. Parasit Vectors. 2024. PMID: 38570854 Free PMC article. Review.
Cited by
-
Blood transfusion and mortality in children with severe anaemia in a malaria-endemic region.Paediatr Int Child Health. 2021 May;41(2):129-136. doi: 10.1080/20469047.2021.1881270. Epub 2021 Apr 19. Paediatr Int Child Health. 2021. PMID: 33874852 Free PMC article.
-
Overdiagnosis of Malaria Illness in an Endemic Setting: A Facility-Based Surveillance Study in Malawi.Am J Trop Med Hyg. 2021 May 3;104(6):2123-2130. doi: 10.4269/ajtmh.20-1209. Am J Trop Med Hyg. 2021. PMID: 33939628 Free PMC article.
-
Associations between environmental covariates and temporal changes in malaria incidence in high transmission settings of Uganda: a distributed lag nonlinear analysis.BMC Public Health. 2021 Oct 30;21(1):1962. doi: 10.1186/s12889-021-11949-5. BMC Public Health. 2021. PMID: 34717583 Free PMC article.
-
Spatial distribution of incident pediatric Burkitt lymphoma in central and northern Malawi and association with malaria prevalence.Pediatr Blood Cancer. 2022 Oct;69(10):e29867. doi: 10.1002/pbc.29867. Epub 2022 Aug 3. Pediatr Blood Cancer. 2022. PMID: 35731580 Free PMC article.
-
Spatio-temporal modelling of routine health facility data for malaria risk micro-stratification in mainland Tanzania.Sci Rep. 2023 Jun 30;13(1):10600. doi: 10.1038/s41598-023-37669-x. Sci Rep. 2023. PMID: 37391538 Free PMC article.
References
MeSH terms
Grants and funding
LinkOut - more resources
Full Text Sources
Medical
