. 2020 Jan 7;17(1):2.
doi: 10.1186/s12987-019-0162-5.

Genetic disruption of slc4a10 alters the capacity for cellular metabolism and vectorial ion transport in the choroid plexus epithelium

Affiliations

Genetic disruption of slc4a10 alters the capacity for cellular metabolism and vectorial ion transport in the choroid plexus epithelium

Inga Baasch Christensen et al. Fluids Barriers CNS. .

Abstract

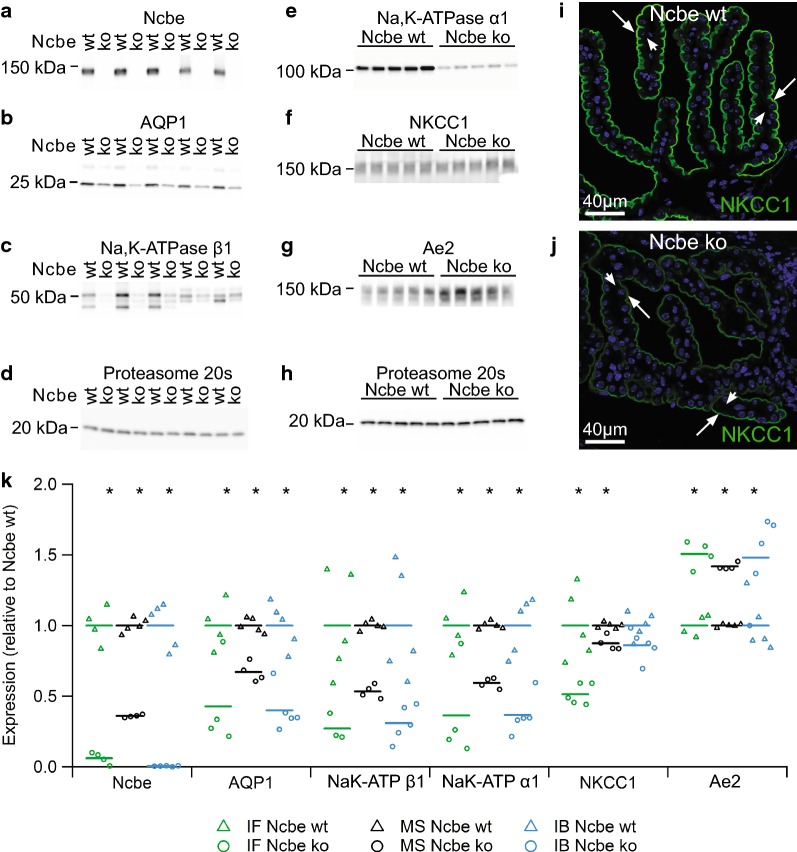
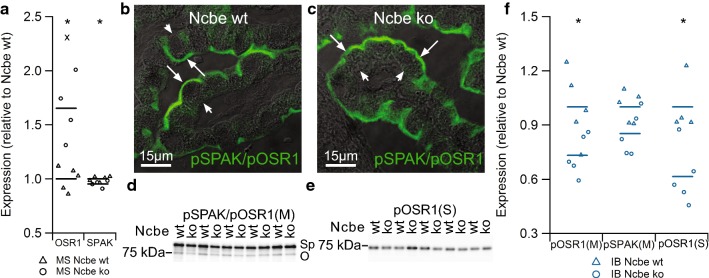
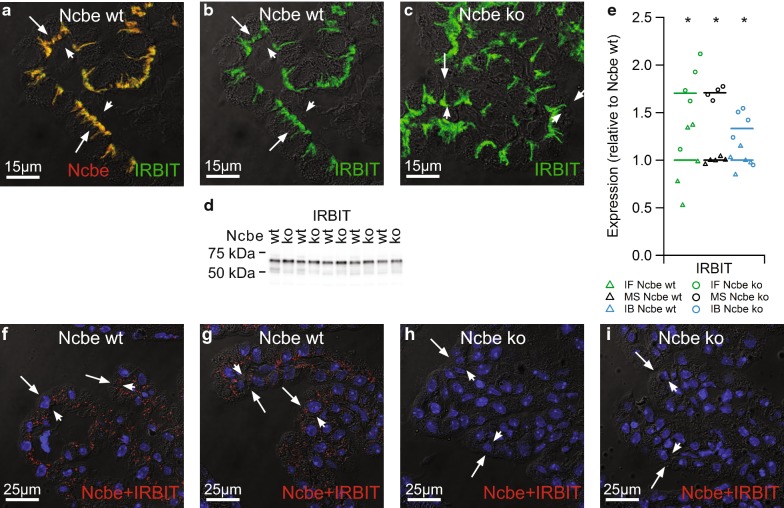
Background: Genetic disruption of slc4a10, which encodes the sodium-dependent chloride/bicarbonate exchanger Ncbe, leads to a major decrease in Na+-dependent HCO3- import into choroid plexus epithelial cells in mice and to a marked reduction in brain intraventricular fluid volume. This suggests that Ncbe functionally is a key element in vectorial Na+ transport and thereby for cerebrospinal fluid secretion in the choroid plexus. However, slc4a10 disruption results in severe changes in expression of Na+,K+-ATPase complexes and other major transport proteins, indicating that profound cellular changes accompany the genetic manipulation.

Methods: A tandem mass tag labeling strategy was chosen for quantitative mass spectrometry. Alterations in the broader patterns of protein expression in the choroid plexus in response to genetic disruption of Ncbe was validated by semi-quantitative immunoblotting, immunohistochemistry and morphometry.

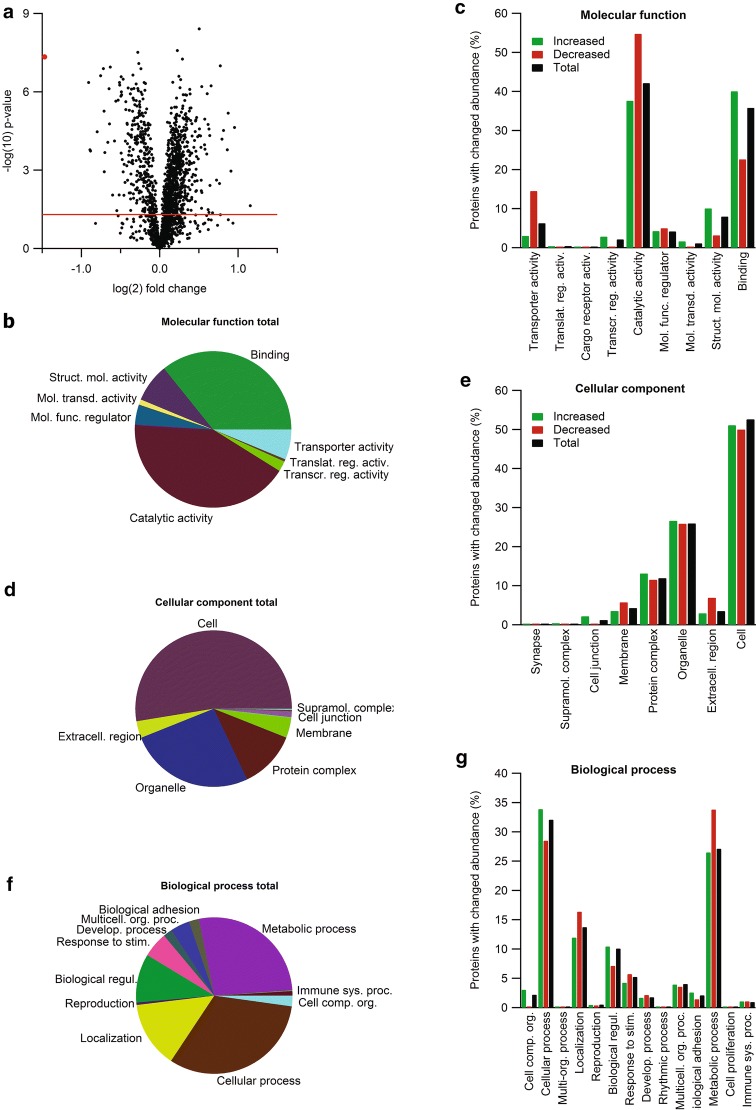
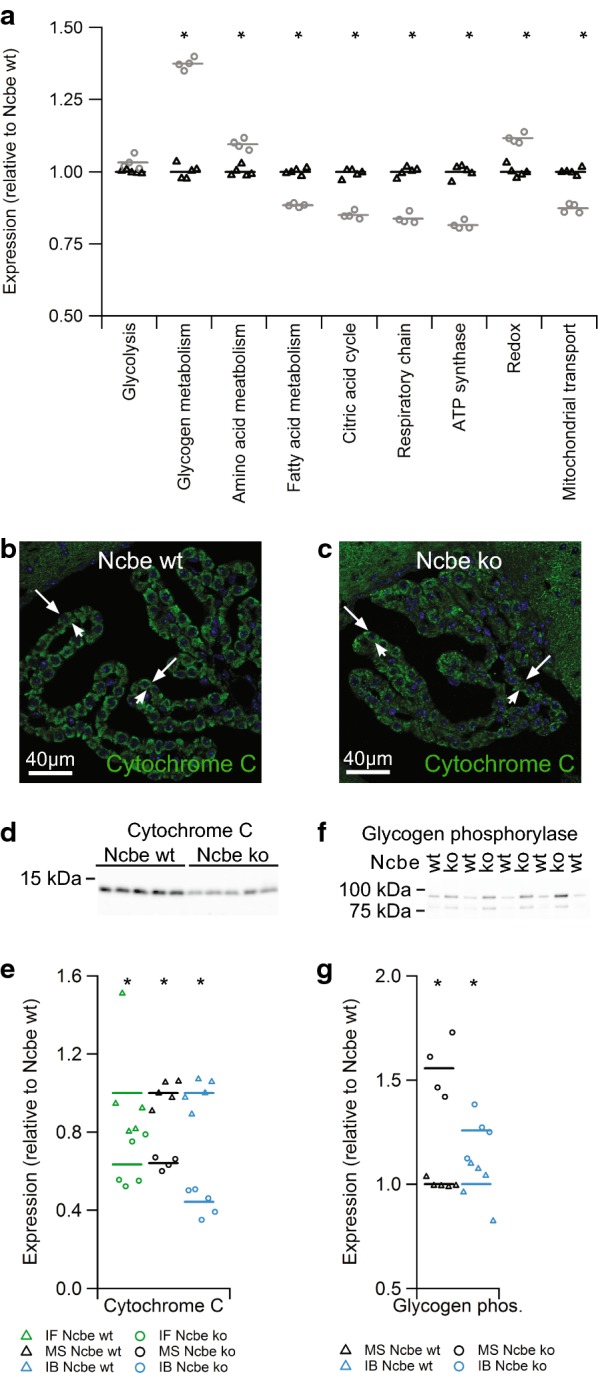
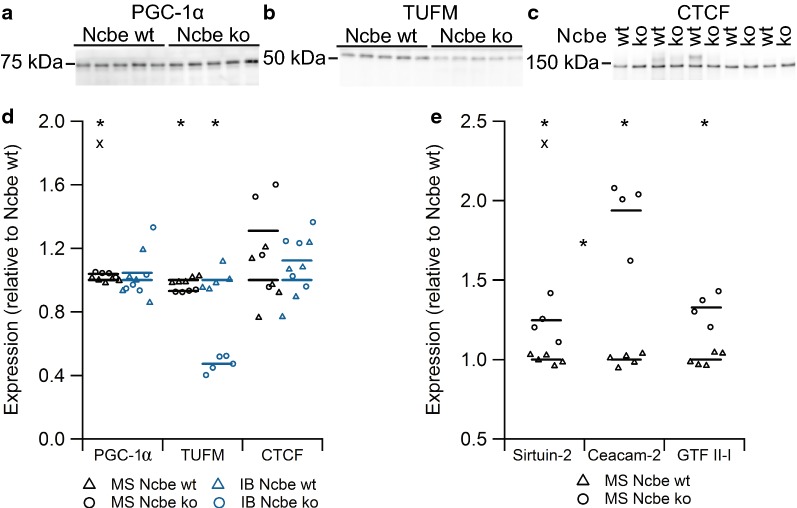
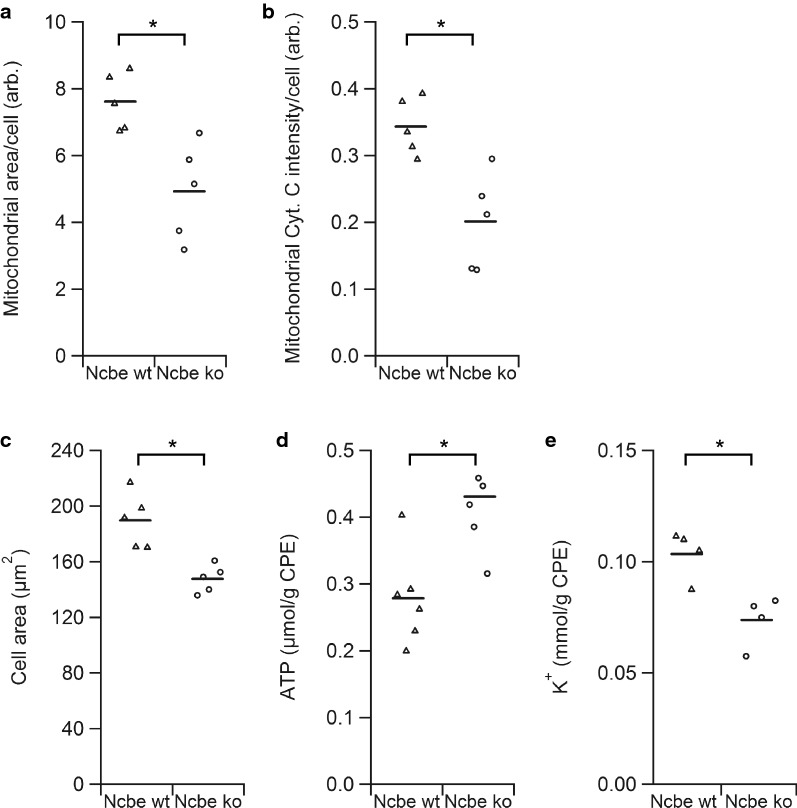
Results: The abundance of 601 proteins were found significantly altered in the choroid plexus from Ncbe ko mice relative to Ncbe wt. In addition to a variety of transport proteins, particularly large changes in the abundance of proteins involved in cellular energy metabolism were detected in the Ncbe ko mice. In general, the abundance of rate limiting glycolytic enzymes and several mitochondrial enzymes were reduced following slc4a10 disruption. Surprisingly, this was accompanied by increased ATP levels in choroid plexus cells, indicating that the reduction in capacity for energy metabolism was adaptive to high ATP rather than causal for a decreased capacity for ion and water transport. Ncbe-deficient cells also had a reduced cell area and decreased K+ content.

Conclusion: Our findings suggest that the lack of effective Na+-entry into the epithelial cells of the choroid plexus leads to a profound change in the cellular phenotype, shifting from a high-rate secretory function towards a more dormant state; similar to what is observed during ageing or Alzheimer's disease.

Keywords: Cerebrospinal fluid; Choroid plexus; Mass spectrometry; Ncbe.


Conflict of interest statement

The authors declare that they have no competing interests.

Figures

Fig. 1
Fig. 1
Proteomic and bioinformatic profile of the CP from Ncbe wt and Ncbe ko mice. a Volcano plot of the peptide quantification in Ncbe wt and Ncbe ko CP, where the primary axis shows the log2 (mean peptide abundance ratio), while the secondary axis designates the −log10(p value). The horizontal red line represents the Benjamini–Hochberg false discovery rate threshold (p = 0.05). The red dot marks the data point for Ncbe peptides encoded by pre-STOP codons. Pie and bar graphs visualizing the distribution of proteins detected in both groups classified by gene ontology (GO) terms for molecular functions (b, c), cellular components (d, e), and biological processes (f, g). The bar graphs illustrate the percent wise distribution of proteins among GO-terms topics for all detected proteins (black bars), and proteins that are either increased (green bars) or decreased (red bars) in Ncbe ko CP compared to Ncbe wt
Fig. 2
Fig. 2
Analysis of plasma membrane transporter expression. Immunoblot analysis of the protein abundance in the CP from Ncbe wt and Ncbe ko mice for a Ncbe, b AQP1, c Na,K-ATPase β1 subunit, d Proteasome 20 s, e Na,K-ATPase α1 subunit, f NKCC1, g Ae2, and h Proteasome 20 s. Immunofluorescence histochemistry was applied to compare protein expression of NKCC1 (green) in the IVth ventricle CP from i Ncbe wt and j Ncbe ko mice. Arrows indicate the luminal plasma membrane, while arrowheads indicate the basolateral membrane labyrinth. Nuclei are stained blue. k Scatter plot comparing the relative changes in transporter protein abundance obtained by immunofluorescence microscopy (IF), proteomic mass spectrometry analysis (MS), and immunoblotting (IB) (*p < 0.05, n = 5). Mean values are normalized to control (Ncbe wt) and indicated by horizontal bars. Triangles indicate data points from Ncbe wt CP, whereas circles represent data from Ncbe ko CP. Mean data for the IF semi-quantitation, except for NKCC1 are from previous publications [–15]
Fig. 3
Fig. 3
Protein abundance of proteins in selected metabolic pathways. a Scatter plot showing the relative changes in abundance between Ncbe wt and Ncbe ko CP among proteins involved in the glycolysis, glycogen, amino acid, and fatty acid metabolism, the tricarboxylic acid (TCA) cycle, respiratory chain, subunits of the ATP synthase, redox enzymes and mitochondrial transport proteins (*p > 0.05, n = 5). Mean values are normalized to control (Ncbe wt) and indicated by horizontal bars. Triangles indicate data point from Ncbe wt CP, whereas circles represent data from Ncbe ko CP. b, c Representative immunofluorescence micrographs comparing the protein expression of cytochrome C (green) in Ncbe wt and Ncbe ko 4th ventricle CP, respectively. Nuclei are stained blue. d Immunoblot analysis of cytochrome C protein abundance in the CP from Ncbe wt and Ncbe ko mice. e Scatter plot comparing relative changes in cytochrome C protein abundance obtained by immunofluorescence microscopy (IF), proteomic mass spectrometry analysis (MS), and immunoblotting (IB) (*p < 0.05, n = 5). Mean values are normalized to control (Ncbe wt) and indicated by horizontal bars. Triangles indicate data points from Ncbe wt CP, whereas circles represent data from Ncbe ko CP. f Immunoblot analysis of glycogen phosphorylase (brain type) protein abundance in the CP from Ncbe wt and Ncbe ko mice. g Scatter plot comparing relative changes in glycogen phosphorylase abundance obtained by proteomic mass spectrometry analysis (MS), and immunoblotting (IB) (*p < 0.05, n = 5). Mean values are normalized to control (Ncbe wt) and indicated by horizontal bars. Triangles indicate data points from Ncbe wt CP, whereas circles represent data from Ncbe ko CP
Fig. 4
Fig. 4
Analysis of the relative expression of proteins involved in the regulation of energy metabolic pathways. Immunoblot analysis of the protein abundance in the CP from Ncbe wt and Ncbe ko mice for a PGC-1α, b TUFM, and c CTCF. d Scatter plot comparing relative changes in protein abundance obtained by proteomic mass spectrometry analysis (MS), and immunoblotting (IB) (*p < 0.05, X: Failed FDR of 1%, n = 5). Mean values are normalized to control (Ncbe wt) and indicated by horizontal bars. Triangles indicate data point from Ncbe wt CP, whereas circles represent data from Ncbe ko CP. e Scatter plot showing the comparative mass spectrometry analysis of additional regulatory proteins Sirtuin-2, Ceacam-2 and general transcription factor II-I between Ncbe wt and Ncbe ko CP (*p < 0.05, X: Failed FDR of 1%, n = 5). Mean values are normalized to control (Ncbe wt) and indicated by horizontal bars. Triangles indicate data points from Ncbe wt CP, whereas circles represent data from Ncbe ko CP
Fig. 5
Fig. 5
Evaluation of mitochondrial abundance, cell size, ATP, and K+ levels. a Scatter plot comparing the average mitochondrial area determined by the cytochrome C positive area within cells from Ncbe wt and Ncbe ko CP (*p < 0.05, n = 5, representing 364 Ncbe wt cells and 482 Ncbe ko cells). Mean values indicated by horizontal bars. Triangles indicate data points from Ncbe wt CP, whereas circles represent data from Ncbe ko CP. b The mean cytochrome C immunostaining intensity per cell from the Ncbe wt and Ncbe ko CP epithelium, respectively (*p < 0.05, n = 5, representing 364 Ncbe wt cells and 482 Ncbe ko cells). Mean values indicated by horizontal bars. Triangles indicate data points from Ncbe wt CP, whereas circles represent data from Ncbe ko CP. c Estimation of the average cell size in Ncbe wt and Ncbe ko CP epithelium from micrographs of background fluorescence (*p < 0.05, n = 5, representing 1214 Ncbe wt cells and 1222 Ncbe ko cells). Mean values indicated by horizontal bars. Triangles indicate data points from Ncbe wt CP, whereas circles represent data from Ncbe ko CP. d Scatter plot showing the mean ATP levels in the CP from Ncbe wt and Ncbe ko mice by chemiluminescence (*p < 0.05, n = 6). Mean values indicated by horizontal bars. Triangles indicate data points from Ncbe wt CP, whereas circles represent data from Ncbe ko CP. e Estimation of the mean cellular K+ content in the CP from Ncbe wt and Ncbe ko mice by flame photometry (*p < 0.05, n = 4). Mean values indicated by horizontal bars. Triangles indicate data points from Ncbe wt CP, whereas circles represent data from Ncbe ko CP
Fig. 6
Fig. 6
Comparison of the expression of ion transport regulators OSR1 and SPAK in Ncbe wt and Ncbe ko mouse CP. a Scatter plot illustrating the difference in mean CP OSR1 and SPAK expression between Ncbe wt and Ncbe ko mice, as assessed by comparative mass spectrometry (*p < 0.05, X: Failed FDR of 1%, n = 5). Mean values are normalized to control (Ncbe wt) and indicated by horizontal bars. Triangles indicate data points from Ncbe wt CP, whereas circles represent data from Ncbe ko CP. b Immunofluorescence micrograph showing the cellular distribution of pSPAK/pOSR1 (green) at high magnification of the CP from an Ncbe wt mouse. c A similar micrograph of pSPAK/pOSR1 staining in the CP from an Ncbe ko mouse. The fluorescence images are overlaid onto the corresponding differential interference contrast (DIC) images. Arrows indicate the luminal plasma membrane, while arrowheads indicate the basolateral membrane labyrinth. d, e Immunoblot analysis of the pSPAK/pOSR1 abundance in the CP from Ncbe wt and Ncbe ko mice with two antibodies (“M” and “S”, respectively). Sp indicates the expected migration of pSPAK, whereas O indicates the expected pOSR1 size. f Scatter plot comparing relative changes in pOSR1 and pSPAK abundances obtained by immunoblotting (IB) with the two antibodies (*p < 0.05, n = 5). Mean values are normalized to control (Ncbe wt) and indicated by horizontal bars. Triangles indicate data points from Ncbe wt CP, whereas circles represent data from Ncbe ko CP
Fig. 7
Fig. 7
Comparison of the expression of ion transport regulator IRBIT in Ncbe wt and Ncbe ko mouse CP. a Double immunofluorescence micrograph stained for Ncbe (red) and IRBIT (green) at high magnification of the CP from a Ncbe wt mouse. b The same micrograph showing only the anti-IRBIT immunoreactivity. c A similar micrograph of IRBIT staining in the CP from an Ncbe ko mouse. The fluorescence images are overlaid onto the corresponding DIC images. Arrows indicate the luminal plasma membrane, while arrowheads indicate the basolateral membrane labyrinth. d Immunoblot analysis of the IRBIT abundance in the CP from Ncbe wt and Ncbe ko mice. e Scatter plot comparing relative changes in IRBIT abundance obtained by immunofluorescence microscopy (IF), proteomic mass spectrometry analysis (MS), and immunoblotting (IB)(*p < 0.05, n = 5). Mean values are normalized to control (Ncbe wt) and indicated by horizontal bars. Triangles indicate data points from Ncbe wt CP, whereas circles represent data from Ncbe ko CP. f, g Representative images resulting from PLA assays using anti-Ncbe and anti-IRBIT antibodies on Ncbe wt CP. h, i Similar representative images using the same antibodies on Ncbe ko CP (run in parallel). Positive reaction products are shown in red. Nuclei are shown in blue and the fluorescence signals are overlaid onto the corresponding DIC image

Similar articles

Cited by

References

    1. de Rougemont J, Ames A, 3rd, Nesbett FB, Hofmann HF. Fluid formed by choroid plexus; a technique for its collection and a comparison of its electrolyte composition with serum and cisternal fluids. J Neurophysiol. 1960;23:485–495. doi: 10.1152/jn.1960.23.5.485. - DOI - PubMed
    1. Damkier HH, Brown PD, Praetorius J. Cerebrospinal fluid secretion by the choroid plexus. Physiol Rev. 2013;93(4):1847–1892. doi: 10.1152/physrev.00004.2013. - DOI - PubMed
    1. Welch K. Secretion of Cerebrospinal Fluid by Choroid Plexus of the Rabbit. Am J Physiol. 1963;205:617–624. doi: 10.1152/ajplegacy.1963.205.3.617. - DOI - PubMed
    1. Davson H, Segal MB. The effects of some inhibitors and accelerators of sodium transport on the turnover of 22Na in the cerebrospinal fluid and the brain. J Physiol. 1970;209(1):131–153. doi: 10.1113/jphysiol.1970.sp009159. - DOI - PMC - PubMed
    1. Wright EM. Mechanisms of ion transport across the choroid plexus. J Physiol. 1972;226(2):545–571. doi: 10.1113/jphysiol.1972.sp009997. - DOI - PMC - PubMed

MeSH terms

Substances