. 2020 Jan 6;11(1):15.
doi: 10.1038/s41419-019-2207-8.

MicroRNA-26a/b have protective roles in oral lichen planus

Affiliations

MicroRNA-26a/b have protective roles in oral lichen planus

Jie Du et al. Cell Death Dis. .

Abstract

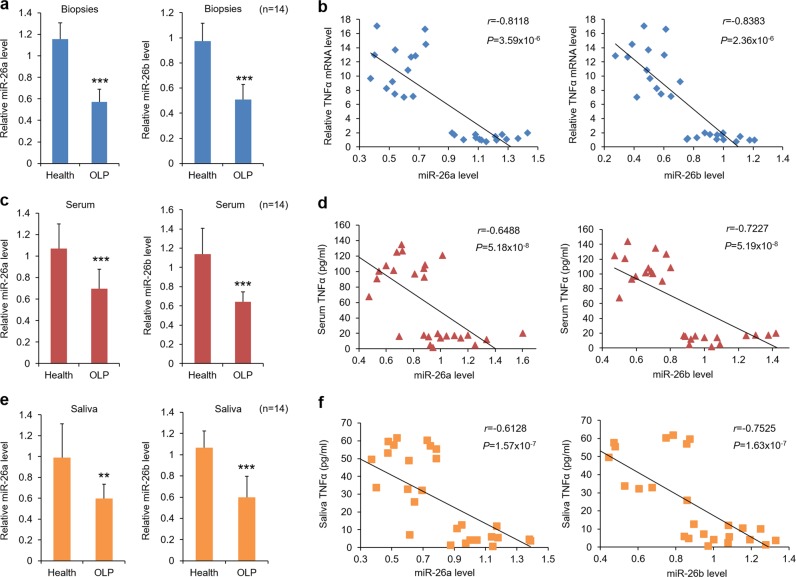
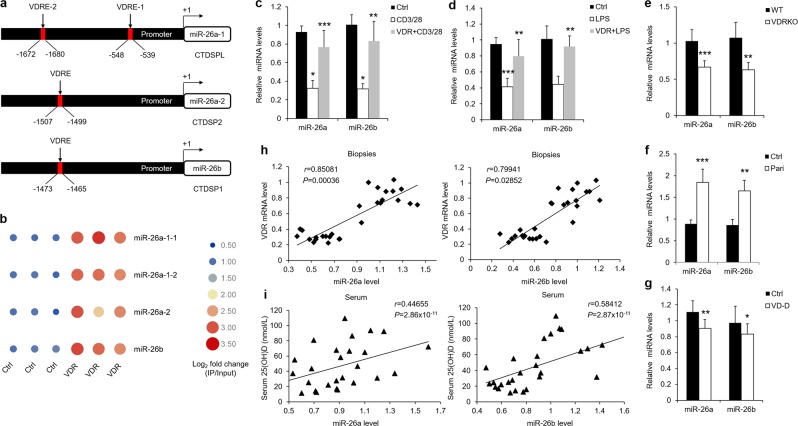
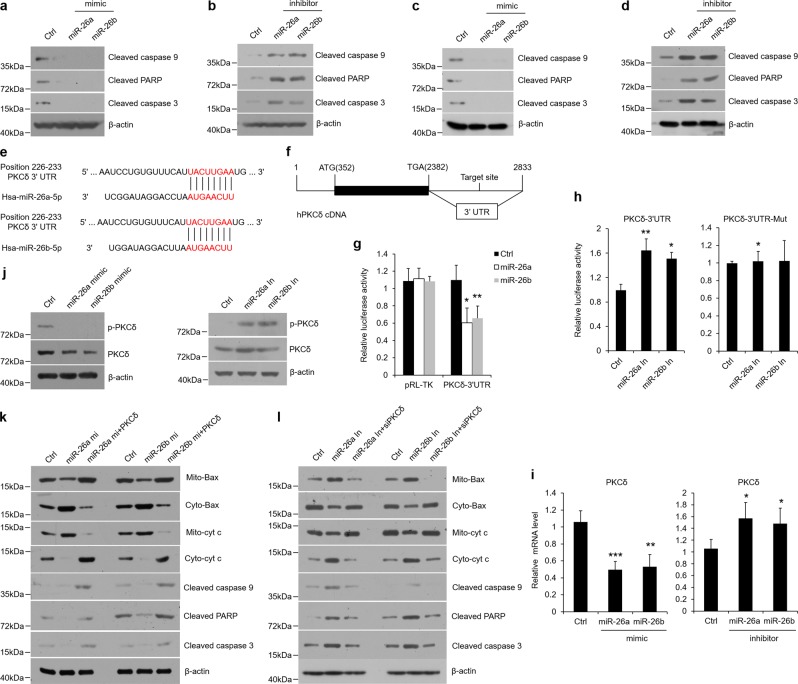
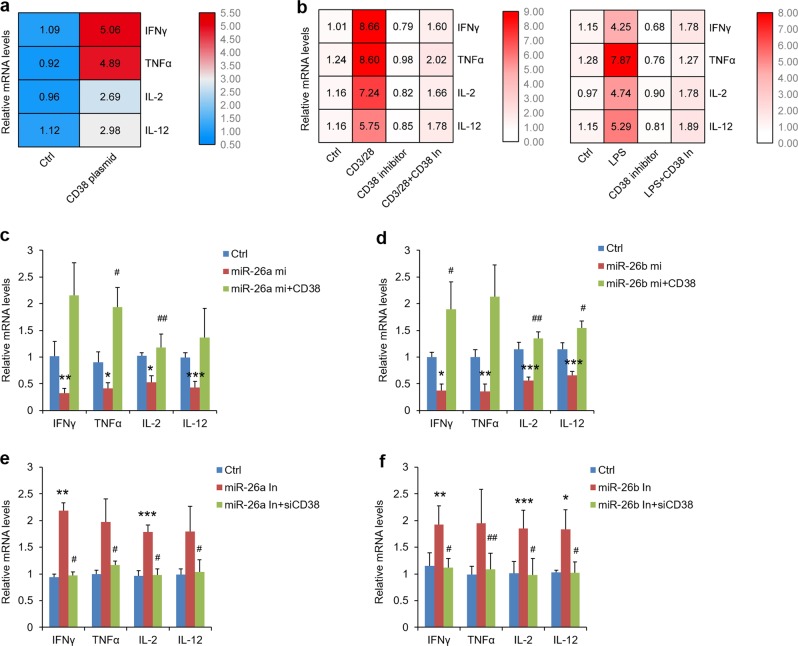
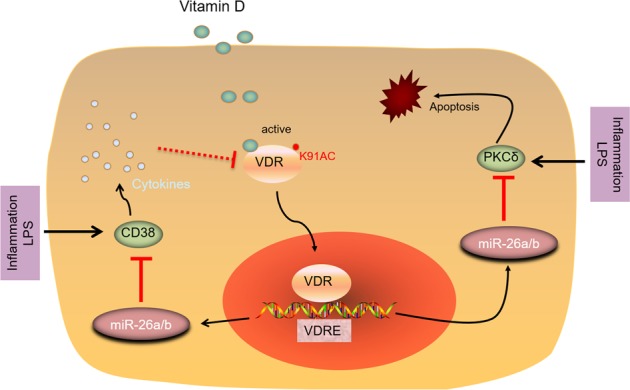
Oral lichen planus (OLP) is a kind of oral epithelial disorder featured with keratinocyte apoptosis and inflammatory reaction. The pathogenesis of OLP remains an enigma. Herein, we showed that the levels of miR-26a/b were robustly down-regulated in oral mucosal biopsies, serum and saliva in OLP patients compared with healthy control. Moreover, we found the binding sites of vitamin D receptor (VDR) in the promoter regions of miR-26a/b genes and proved that the induction of miR-26a/b was VDR dependent. The reduction of miR-26a/b expression was also detected in the oral epithelium of vitamin D deficient or VDR knockout mice. miR-26a/b inhibitors enhanced apoptosis and Type 1T helper (Th1) cells-related cytokines production in oral keratinocytes, whereas miR-26a/b mimics were protective. Mechanistically, we analyzed miRNA target genes and confirmed that miR-26a/b blocked apoptosis by directly targeting Protein Kinase C δ (PKCδ) which promotes cellular apoptotic processes. Meanwhile, miR-26a/b suppressed Th1-related cytokines secretion through targeting cluster of the differentiation 38 (CD38). In accordant with miR-26a/b decreases, PKCδ and CD38 levels were highly elevated in OLP patients' samples. Taken together, our present investigations suggest that vitamin D/VDR-induced miR-26a/b take protective functions in OLP via both inhibiting apoptosis and impeding inflammatory response in oral keratinocytes.


Conflict of interest statement

The authors declare that they have no conflict of interest.

Figures

Fig. 1
Fig. 1. miR-26a/b are decreased in OLP patients.
a miR-26a/b levels in human oral epithelial samples determined by real-time PCR. b Correlation of fold change between TNFα and miR-26a/b in oral epitheliums from OLP patients (r = −0.8118, P = 3.59 × 10−6, Spearman’s correlation test for miR-26a; r = -0.8383, P = 2.36 × 10-6, Spearman’s correlation test for miR-26b). c miR-26a/b levels in serum of participants measured by real-time PCR. d Correlation between TNFα concentrations and miR-26a/b levels in serum of OLP patients (r = −0.6488, P = 5.18 × 10-8, Spearman’s correlation test for miR-26a; r = −0.7227, P = 5.19 × 10-8, Spearman’s correlation test for miR-26b). e qPCR analysis of OLP saliva showing 40% decreases of miR-26a/b versus healthy controls. f Correlation between TNFα status and miR-26a/b expression in saliva derived from OLP patients (r = −0.6128, P = 1.57 × 10−7, Spearman’s correlation test for miR-26a; r = −0.7525, P = 1.63 × 10−7, Spearman’s correlation test for miR-26b). **P < 0.01, ***P < 0.001 vs. corresponding healthy controls; n = 14 each group.
Fig. 2
Fig. 2. VDR induces miR-26a/b by binding with VDRE in HOKs.
a Schematic illustration of VDR binding sites in the promoter regions of miR-26a/b genes. b ChIP analysis showing the increases of miR-26a/b levels after 36-hour VDR plasmids transfection in HOKs, bar indicates log2 fold change, n = 3. qPCR analysis of miR26-a/b expression in HOKs challenged by activated CD4+ T cells (c) or LPS (d) with or without VDR plasmids, n = 3. Differential expression of miR-26a/b in oral keratinocytes of VDRKO (e), paricalcitol-treated (f), or vitamin D-deficient (g) mice, n = 5. Paricalcitol is an analog of vitamin D. h Correlation of fold change in OLP biopsies between VDR and miR-26a/b (r = 0.85081, P = 0.00036, Spearman’s correlation test for miR-26a; r = 0.79941, P = 0.02852, Spearman’s correlation test for miR-26b), n = 14. i Correlation between 25(OH)D concentrations and miR-26a/b levels in serum from OLP patient (r = 0.44655, P = 2.86 × 10−11, Spearman’s correlation test for miR-26a; r = 0.58412, P = 2.87 × 10-11, Spearman’s correlation test for miR-26b), n = 14. *P < 0.05, **P < 0.01, ***P < 0.001 vs. corresponding control. Ctrl control, VDRKO VDR knockout, Pari paricalcitol, VD-D vitamin D deficiency.
Fig. 3
Fig. 3. miR-26a/b target PKCδ to inhibit apoptosis in oral keratinocytes.
ad Western blot showing changes of cleaved caspase 9, cleaved PARP, and cleaved caspase 3 levels in HOKs added with miR-26a/b mimics (a) or inhibitors (b). c-d Western blot analysis of cleaved caspase 9, cleaved PARP, and cleaved caspase 3 expression in mouse oral keratinocytes. C57BL/6 mice were subject to miR-26a/b mimics (c) or inhibitors (d) by tail vein injection. e Putative miR-26a/b binding site in the 3′UTR of PKCδ mRNA. f Schematic illustration of binding site location in the 3′UTR of hPKCδ cDNA. g Luciferase reporter assay showing miR-26a/b target binding site in the 3′UTR of hPKCδ in HOKs which were transfected with Luc-PKCδ-3′UTR or pRL-TK (control) plasmids. Luciferase activity was quantified after 24 h. h HOKs were co-transfected with Luc-PKCδ-3′UTR or Luc-PKCδ-3′UTR-Mut and miR-26a/b inhibitors as indicated. i–j PKCδ expression and phosphorylation in HOKs with miR-26a/b mimics or inhibitors were measured by real-time PCR (i) or western blot (j). Western blot showing Bax translocation, cyt c release, and downstream apoptotic factors expression in HOKs during miR-26a/b mimics (k) or inhibitors (l) treatment with or without PKCδ plasmids or siRNA transfection as indicated. *P < 0.05, **P < 0.01, ***P < 0.001 vs. corresponding control; n = 3 for assays in vitro and n = 5 for assays in vivo. Ctrl control, Mito mitochondria, Cyto cytoplasm, cyt c cytochrome c, mi mimic, In inhibitor, Mut mutation.
Fig. 4
Fig. 4. miR-26a/b regulate cytokines and target CD38.
a Heat map showing alterations of cytokines and corresponding receptors expression in HOKs with activated CD4+ T cells or LPS stimulation by real-time PCR. b Real-time PCR analysis of relative IFNγ status in activated CD4+ T cells or LPS-stimulated HOKs with 36-h miR-26a/b pre-treatment. c Putative miR-26a/b binding site in the 3′UTR of CD38 mRNA. d Schematic showing binding site location in the 3′UTR of hCD38 cDNA. e Luciferase reporter assay showing miR-26a/b target binding site in the 3′UTR of hCD38 in HOKs. f–g Luciferase activity quantification in HOKs. Cells were co-transfected with Luc-CD38-3′UTR or Luc-CD38-3′UTR-Mut and miR-26a/b inhibitors as shown. *P < 0.05, **P < 0.01, ***P < 0.001 vs. corresponding control; n = 3. Ctrl control, In inhibitor, Mut mutation.
Fig. 5
Fig. 5. miR-26a/b suppress cytokines via targeting CD38.
a IFNγ, TNFα, IL-2, and IL-12 levels detected by real-time PCR in HOKs after CD38 plasmids transfection. (b) qPCR showing IFNγ, TNFα, IL-2 and IL-12 levels in activated CD4+ T cells or LPS-stimulated HOKs, following CD38 inhibitor treatment. Real-time PCR analysis of IFNγ, TNFα, IL-2 and IL-12 levels in HOKs during miR-26a (c) or miR-26b (d) mimic treatment with or without CD3 plasmids transfection as indicated. Real-time PCR analysis of IFNγ, TNFα, IL-2, and IL-12 levels in HOKs during miR-26a (e) or miR-26b (f) inhibitor treatment with or without siRNA transfection. *P < 0.05, **P < 0.01, ***P < 0.001 vs. corresponding control; #P < 0.05, ##P < 0.01 vs miR-26a/b mi or In group; n = 3. Ctrl control, mi mimic, In inhibitor.
Fig. 6
Fig. 6. Apoptosis and inflammatory response are enhanced in oral keratinocytes derived from OLP biopsies.
a Western blot analysis of oral epithelial cells from OLP patients (I) or healthy individuals (NI) with a set of antibodies as indicated. b TUNEL staining of biopsies harvested from OLP patients or healthy control. c Average TUNEL positive-oral keratinocytes per microscopic field (magnification, ×400), 20 random fields were counted for each group. d Violin plot showing CD38 mRNA expression in healthy or OLP oral epitheliums determined by real-time PCR. e Real-time PCR analysis of IFNγ, IL-2 and IL-12 mRNA levels in human biopsies. n = 14 each group, NI non-inflammation, I inflammation.
Fig. 7
Fig. 7
Schematic illustration recapitulates biological process and function of miR-26a/b in oral keratinocytes.

References

    1. Cheng YS, Gould A, Kurago Z, Fantasia J, Muller S. Diagnosis of oral lichen planus: a position paper of the American academy of oral and maxillofacial pathology. Oral. Surg. Oral. Med. Oral. Pathol. Oral. Radiol. 2016;122:332–354. doi: 10.1016/j.oooo.2016.05.004. - DOI - PubMed
    1. De Rossi SS, Ciarrocca K. Oral lichen planus and lichenoid mucositis. Dent. Clin. North Am. 2014;58:299–313. doi: 10.1016/j.cden.2014.01.001. - DOI - PubMed
    1. Lodi G, et al. Current controversies in oral lichen planus: report of an international consensus meeting. Part 2. Clinical management and malignant transformation. Oral. Surg. Oral. Med. Oral. Pathol. Oral. Radiol. Endod. 2005;100:164–178. doi: 10.1016/j.tripleo.2004.06.076. - DOI - PubMed
    1. Parashar P. Oral lichen planus. Otolaryngol. Clin. North. Am. 2011;44:89–107. doi: 10.1016/j.otc.2010.09.004. - DOI - PubMed
    1. Zhao Z, et al. Total glucosides of paeony improves the immunomodulatory capacity of MSCs partially via the miR-124/STAT3 pathway in oral lichen planus. Biomed. Pharmacother. 2018;105:151–158. doi: 10.1016/j.biopha.2018.05.076. - DOI - PubMed

Publication types

MeSH terms