. 2020 Feb;23(2):260-270.
doi: 10.1038/s41593-019-0555-4. Epub 2020 Jan 6.

Long-term stability of cortical population dynamics underlying consistent behavior

Affiliations

Long-term stability of cortical population dynamics underlying consistent behavior

Juan A Gallego et al. Nat Neurosci. 2020 Feb.

Abstract

Animals readily execute learned behaviors in a consistent manner over long periods of time, and yet no equally stable neural correlate has been demonstrated. How does the cortex achieve this stable control? Using the sensorimotor system as a model of cortical processing, we investigated the hypothesis that the dynamics of neural latent activity, which captures the dominant co-variation patterns within the neural population, must be preserved across time. We recorded from populations of neurons in premotor, primary motor and somatosensory cortices as monkeys performed a reaching task, for up to 2 years. Intriguingly, despite a steady turnover in the recorded neurons, the low-dimensional latent dynamics remained stable. The stability allowed reliable decoding of behavioral features for the entire timespan, while fixed decoders based directly on the recorded neural activity degraded substantially. We posit that stable latent cortical dynamics within the manifold are the fundamental building blocks underlying consistent behavioral execution.


Conflict of interest statement

COMPETING INTERESTS STATEMENT

The authors declare no competing interests.

Figures

Extended Data Fig. 1
Extended Data Fig. 1. Additional data: task description and consistent behavior.
(a-f) Correlation between direction-matched single trial X and Y hand velocities across all pairs of days (single dots: individual trials; lines: linear fits) from Monkey CL (a), Monkey J (b), Monkey M (c), Monkey T (d), Monkey P (e), and Monkey H (f). The inset in (a) shows X and Y hand trajectories for three example sessions. Trajectories are color coded by target as in Figure 2.
Extended Data Fig. 2
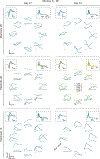
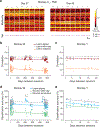
Extended Data Fig. 2. Additional data: example neural activity during reaching on two days from Monkey CR.
Each row shows the firing rates on a different electrode for Day 27 (left column) and Day 43 (right column). Each color represents a different sorted neuron. The eight plots arranged in a circular manner show the firing rate as a function of time during a reach to each of the eight targets, aligned on movement onset and averaged across all trials to the same target. The inset in the top left of each panel shows the average waveform of each sorted neuron; the inset at the top right shows the ISI distribution for each sorted neuron. Inset scale bars: horizontal, 400 µs; vertical, 200 µV.
Extended Data Fig. 3
Extended Data Fig. 3. Additional data: neural recording stability.
(a) We manually spike-sorted the neural recordings from Monkeys C, M, and T to establish whether the same neurons were recorded across days (Methods; Extended Data 2 shows example neurons). Plots show the average action potential waveform of example sorted neurons for two datasets: Day 27 and Day 43 from Monkey CL. Note the large apparent turnover after 15 days. Right insets: example action potential waveforms and inter-spike interval (ISI) histograms for two neurons that were matched across days. (b) To quantify the turnover effect, we tracked both firing rate statistics and waveform shape of each neuron; these figures show the percentage of individual sorted M1 neurons that were matched across pairs of days based on action potential waveforms and inter-spike interval (ISI) histograms. Data from Monkey CL (top), Monkey CR (middle; inset highlights the first 35 days), and Monkey M (bottom; inset highlights the first 50 days). (c) Percentage of individual sorted PMd neurons that were matched across pairs of days as in (a). Data from Monkey CL (top), Monkey M (middle), and Monkey T (bottom).
Extended Data Fig. 4
Extended Data Fig. 4. Additional data: neural tuning stability.
For each implant: change in mean firing rate (top plot), modulation depth (middle plot), and preferred direction (bottom plot) of standard cosine tuning fits to multiunit activity across all pairs of days. Line and shaded areas: mean ± s.e.m. Plots are grouped by implant and brain area (M1: left; PMd: middle; S1: right). Error bars: 95% confidence interval of linear fit. N: number of across-day comparisons.
Extended Data Fig. 5
Extended Data Fig. 5. Additional data: controls for the alignment procedure using M1 data.
(a) Correlation of the aligned (CCs; red) and unaligned (Pearson’s r; orange) M1 latent dynamics averaged over the top four neural modes across all pairs of days from Monkey CL using a 6-D manifold (single dots: pairs of days; lines: linear fits). (b) Normalized similarity of the aligned and unaligned M1 latent dynamics in the 6-D neural manifold for Monkey CL. (c) Mean and s.e.m. for normalized similarity distributions as shown in (b), for all four M1 implants for 6, 8, 10, and 12-D manifolds. The 10-D data presented here summarizes the distributions shown in Fig. 4. The significance of the separation between aligned and unaligned distributions held regardless of the choice of neural manifold dimensionality. N values are the same as for the corresponding distributions in Fig. 4. (d) Correlation (CCs) of the M1 latent dynamics averaged over the top four neural modes across all pairs of days from Monkey CL using sorted neurons rather than multiunit activity (single dots: pairs of days; lines: linear fits). (e) Normalized similarity of the aligned and unaligned M1 latent dynamics in the 10-D manifold obtained using sorted neurons for Monkeys CL, CR, and M. Error bars: mean ± s.d. N: number of across-day comparisons.
Extended Data Fig. 6
Extended Data Fig. 6. Additional data: movement decoding-based controls for the alignment procedure.
(a) Predictive accuracy when decoding hand velocity for all pairs of days from Monkey CL, using the unaligned latent dynamics as inputs instead of the multiunit activity used in Fig. 5. (b) Predictive accuracy when using as inputs the latent dynamics within-day, and across-day both before and after alignment, for Monkeys CL, CR, and M. *** denotes p < 0.001, two-sided Wilcoxon rank-sum test. Error bars: mean ± s.d. N: number of across-day comparisons.
Extended Data Fig. 7
Extended Data Fig. 7. Additional data: Altering neural temporal dynamics prevents their alignment.
(a) Simulation showing that movement tuning does not account for unchanging latent dynamics, as in Fig. 6a–d. Latent dynamics from Day 1 (purple curves) are nonlinearly but smoothly transformed into latent dynamics of Day n (pink curves). The latent dynamics are shown as projections onto the four leading neural modes. (b) This transformation preserves neural firing statistics across the population. N=88 neurons; box plot shows median and 25th/75th percentiles, whiskers show range. (c,d) The statistics of preferred directions are also well-preserved across the population. Panels (a-d) present data pooled across all sessions from Monkey CL. (e) As an additional control, we used the TME method to generate simulated population neural activity that preserved the covariance across neurons and conditions (targets), while the covariance over time (dynamics) was not constrained to be preserved. Example data from Monkey CR. Legend: Cov. T: covariance over time; Cov. N: covariance across neurons; Cov. Tgt: covariance across targets. (f) Distribution of the averaged top four CCs between the simulated data and the recorded data for M1 recordings from three monkeys (grey). The distribution for the within-day averaged top four CCs for the recorded data (black) is shown for reference. ***: p< 0.001, two-sided Wilcoxon rank-sum test. Error bars: mean ± s.d. N: number of within-session comparisons.
Extended Data Fig. 8
Extended Data Fig. 8. Additional control data: Stable latent dynamics are not a byproduct of single neuron tuning to movement.
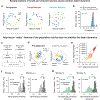
(a) Contribution to the latent dynamics from tuned vs untuned neurons: The neural population was divided into two subpopulations based on the quality of a cosine fit to the activity of each neuron. The average activity in the neural manifold for reaches to each of the eight targets are shown for one example session; one data point per reach. The clustering by target direction observed in the full population (left) was preserved for the tuned subpopulation (middle) but not for the untuned subpopulation (right). (b) Distribution of the averaged top four CCs between the tuned subpopulation and the full population (red), and between the untuned subpopulation and the full population (blue) for all M1 sessions. The dynamics of the untuned population could be well aligned with the dynamics of the full population. Data pooled over all sessions from Monkey CL. (c) A static model based on movement tuning properties of individual neurons represents reaches to each target with one data point per trial and results in target-specific clusters that can be aligned. (d) Left: each point represents a reach to one of the eight targets (color code in inset) on Day 1 (closed circles) and Day n (open squares). Target specificity is mostly lost when these points are projected onto their respective manifolds. Right: after alignment, similar target-specific structure is present for both days. (e) Pairwise comparisons of the CCs after projecting the latent dynamics onto the manifold axes found by aligning the clusters (vertical axis) and onto the manifold axes found by aligning the latent dynamics (horizontal axis). Data shown for the top six neural modes (see legend for color code). Each dot represents one session comparison. All dots lie below the diagonal (dashed grey), indicating that aligning the statistics of the population activity based on target-specific clusters does not reach the CC values obtained by aligning the latent dynamics. (f) Canonical correlation values were significantly lower when the static clusters as opposed to the latent dynamics were aligned, illustrating the importance of the precise temporal dynamics for accurate alignment. (g) Consequently, across-day decoding was notably worse when aligning the static clusters.***: p < 0.001, two-sided Wilcoxon rank-sum test. Error bars: mean ± s.d. N: number of across-day comparisons.
Extended Data Fig. 9
Extended Data Fig. 9. Additional data: PMd alignment and decoding.
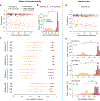
(a) Example mean neural firing rates for 51 PMd multiunits recorded on Day 27 and Day 43 from Monkey CL (top; each multiunit is shown in a different row) and corresponding hand velocity (bottom). Each column represents the average of all trials to each of the eight reach directions (indicated by the arrows above each column). Data was recorded during the pre-movement planning and the transition to movement; hand velocities are thus largely zero. Note the substantial changes in the planning activity of the recorded PMd multiunits across days. Velocity scale bars: horizontal, 300 ms; vertical, 10 cm/s. (b) Correlation of the aligned (CCs; red) and unaligned (Pearson’s r ; orange) PMd latent dynamics averaged over the top four neural modes across all pairs of days from Monkey M (single dots: pairs of days; lines: linear fits). (c) Same as (b) for Monkey T. (d) Classification accuracy for classifiers trained and tested on all different pairs of days for Monkey M (left). (e) Same as (d) for Monkey T.
Extended Data Fig. 10
Extended Data Fig. 10. Additional data: S1 alignment and decoding.
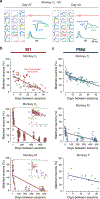
(a) Example mean neural firing rates aligned to movement onset for 65 S1 multiunits recorded on Day 1 and Day 29 from Monkey P (top; each multiunit shown in a different row) and corresponding hand velocity (bottom). Each column represents the average of all trials to each of the eight reach directions (indicated by the arrows above each column). Velocity scale bars: horizontal, 300 ms; vertical, 10 cm/s. (b) Correlation of the aligned (CCs; red) and unaligned (Pearson’s r; orange) S1 latent dynamics averaged over the top four neural modes across all pairs of days from Monkey H (single dots: pairs of days; lines: linear fits). (c) Predictive accuracy for decoders trained and tested on all different pairs of days for Monkey P. (d) Same as (c) for Monkey H.
Figure 1.
Figure 1.
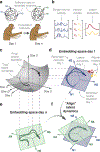
Hypothesis. (a) Subjects perform the same behavior over days, yet in typical experimental setups the same neurons cannot be recorded over this period. (b) In our model, the single neuron activity results from a weighted combination of the latent dynamics of the neural modes. (c) The latent dynamics (black line, arrow indicates passage of time) underlying a behavior are mostly confined to a “true” manifold (gray surface) within the full D-dimensional neural space that involves all neurons modulated by the task. (d) The activity of the recorded neurons (N1, N2, N3 in this example) is represented in an empirical neural space in which each axis corresponds to the activity of one recorded neuron. During behavior, the recorded population activity describes a trajectory (blue trace). During movement, such trajectories are typically confined to a low-dimensional neural manifold (blue plane). The projections of the population activity onto the two axes that define the neural manifold in this example are the empirical latent dynamics. (e) Latent dynamics during the same behavior but on a different day, with a different set of recorded neurons. We hypothesize that the true latent dynamics for a given behavior will be stable during repeated execution across days, even when the empirical manifold to which the latent dynamics are confined is embedded in a different empirical neural space. (f) We predict that, in the face of neural turnover, the stable latent dynamics can be recovered by linear alignment.
Figure 2.
Figure 2.
Task and repeatability of behavior. (a) Monkeys performed an instructed-delay reaching task using a planar manipulandum. The schematic of the task indicates the approximate time windows used for analysis; these varied across cortical areas (PMd, M1, and S1). (b) Left: Example hand trajectories for three days spanning 731 days from Monkey CR. Each trace is an individual trial; traces are color-coded based on target location. Right: Example X and Y hand velocity traces for all reaches to the upper-right target on each of the three days. (c) Correlation (Pearson’s r) between direction-matched single trial X and Y hand velocities across all pairs of days from Monkey CR (single dots: individual pair of days; lines: linear fits). (d) Distribution of across-day hand velocity correlations (Pearson’s r) for all pairs of days for each of the seven sets of implants. Top error bars: mean ± s.d. N: number of across-day comparisons.
Figure 3.
Figure 3.
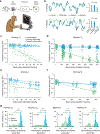
Neural recording and changes in neural activity across days. (a) Approximate location of all nine arrays; each color represents a different set of implants (legend). AS, arcuate sulcus; PCD, precentral dimple; CS, central sulcus; IPS, intraparietal sulcus. (b) Multi-unit threshold crossings for example recording channels on Day 27 and Day 43 for Monkey CL. (c) Example mean neural firing rates aligned to movement onset for 30 recording channels on the same two days (top; each neuron shown in a different row) and corresponding hand velocity (bottom). The columns represent the average of all trials to each of the eight reach directions (indicated by the arrows above each column). Note the substantial changes in neural activity, reflected in altered firing rates and spatial tuning on each electrode, despite the consistency of the behavior. Scale bars: horizontal, 300 ms; vertical, 10 cm/s. (d-e) Representative Day 27 (d) and Day 43 (e) original (‘unaligned”) M1 latent trajectories for Monkey CL. Top plots show the latent dynamics in the manifold spanned by the three leading neural modes (dots indicate movement onset), and the lower plots show their projection onto each mode. Data averaged over all trials for each target and aligned to movement onset, only for visualization purposes. Correlation (Pearson’s r) between pairs of corresponding neural modes is indicated. (f) We aligned the trajectories using the CCA matrices M (see Methods). The “aligned” Day 27 (g) and Day 43 (h) latent trajectories show that the magnitude of the correlations were greatly increased by the alignment procedure.
Figure 4.
Figure 4.
Stability of M1 latent dynamics over time. (a) Correlation of the aligned (CCs; red) and unaligned (Pearson’s r; orange) M1 latent dynamics averaged over the top four neural modes across all pairs of days from Monkey CL (single dots: pairs of days; lines: linear fits). The aligned latent dynamics maintained a higher correlation across days than the unaligned dynamics, and were almost as correlated across different days as the latent dynamics across different blocks of trials from the same day (gray). (b)-(d) Same as (a) for the other three M1 implants. (e) Normalized similarity of the aligned and unaligned across-days M1 latent dynamics during movement execution for each monkey (each shown in a different panel). The mean normalized similarity of the aligned latent dynamics across different days is close to 1; this indicates that their canonical correlations are almost as strong as the canonical correlations of the latent dynamics across two blocks of trials from the same day. *** indicates P < 0.001, two-sided Wilcoxon rank-sum test. Error bars: mean ± s.d. N: number of across-day comparisons.
Figure 5.
Figure 5.
Stable decoding of movement kinematics based on the aligned latent dynamics. (a) We trained linear decoders to predict movement kinematics based on different types of inputs. (b) Example velocity predictions for two recordings made 16 days apart. Predictions based on the aligned latent dynamics were almost as good as predictions based on the recorded neural activity when trained and tested on the same day (bars on the right show the R2 for the entire day). Scale bars: horizontal, 300 ms; vertical, 10 cm/s. (c) Predictive accuracy for decoders trained and tested on all pairwise combinations of days (single dots: pairs of days; lines: linear fits). Decoders based on the aligned latent dynamics (green) performed almost as well as decoders trained and tested on the same day (gray), and much better than decoders trained on the recorded neural activity when tested across days (blue). (d)-(f) Same as (c) for the other three M1 implants. (g) Normalized predictive accuracy for fixed decoders based on the aligned latent dynamics (green) and the recorded neural activity (blue), both tested on a different day. Each panel shows one monkey; each data point is one pairwise comparison between different days. The mean normalized predictive accuracies of decoders based on aligned latent dynamics are close to 1 for all monkeys; this indicates that they are nearly as predictive about behavior as same-day decoders. *** indicates P < 0.001, two-sided Wilcoxon rank-sum test. Error bars: mean ± s.d. N: number of across-day comparisons.
Figure 6.
Figure 6.
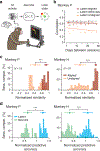
Control analyses establish the importance of latent dynamics. (a) We created surrogate population activity by applying a nonlinear transformation to the latent dynamics of the recorded neural data and projecting them back onto the neural space (see Methods). (b) Both real and surrogate population activity exhibited target-specific clustering within the manifold. Each point represents the average activity during a reach in one session from Monkey CL. (c) Across all sessions from Monkey CL, CCs between the populations (black) were lower than CCs within the real (dark purple) and surrogate (light purple) populations. Box plots show median and 25th/75th percentiles, whiskers show range. N=14 sessions. (d) Decoders trained using real population activity performed poorly on the surrogate dataset, even after alignment. (e) We simulated population activity on two different days by passing movement kinematics of each day through tuning curves fit to the neural data of that day. (f) Example firing rates aligned to movement onset for real and simulated multiunit activity. Traces are colored by target as in (b). Vertical scale bar: 2 Hz. (g) Across all sessions from all M1 implants, canonical correlations between simulated latent dynamics (blue) were lower than those obtained from the actual latent dynamics from the same two days (red); the within-day CCs (gray) provide an upper bound. (h) Normalized similarity of the real latent dynamics (red) and of the simulated latent dynamics (blue). *** indicates P < 0.001, two-sided Wilcoxon rank-sum test. Error bars: mean ± s.d. N: number of simulated-to-real comparisons.
Figure 7.
Figure 7.
Stability of PMd latent dynamics during movement planning. (a) We trained classifiers to predict the intended target based on neural activity. (b) Example confusion matrices showing classification performance. Within-day classifiers (left) performed well (73% correct). The performance of across-day classifiers (middle) based on the aligned latent dynamics was well above chance (54%), while classifiers based on recorded neural activity (right) performed poorly (23%) when trained and tested on different days. Gray scale: classification accuracy. (c) Average correlations for aligned (CCs; red) and unaligned (Pearson’s r; orange) PMd latent dynamics across all pairs of days from Monkey CR compared to within-day correlations (gray). Dots: pairs of days; lines: linear fits. (d) Normalized similarity of the PMd latent dynamics during movement planning for each monkey. A value of one indicates that the dynamics are as correlated as within-day. N: number of across-day comparisons. (e) Classification accuracy for classifiers trained and tested on all different pairs of days. Classifiers based on the aligned latent dynamics (green) performed almost as well as classifiers trained and tested on the same day (gray), and much better than classifiers trained and tested on different days (blue). (f) Normalized predictive accuracy for classifiers using aligned latent dynamics (green) and recorded neural activity (blue) tested on a different day. The mean normalized accuracies of the aligned classifiers are near one. *** indicates P < 0.001, two-sided Wilcoxon rank-sum test. Error bars: mean ± s.d. N: number of across-day comparisons.
Figure 8.
Figure 8.
Stability of S1 latent dynamics during feedback control. (a) We trained decoders to predict movement kinematics from S1 activity. (b) Average correlation of aligned (CCs; red) and unaligned (Pearson’s r; orange) S1 latent dynamics for all pairs of days from Monkey P (single dots: pairs of days; lines: linear fits). The aligned latent dynamics have higher correlations across days than the unaligned dynamics, almost as high as within-day (gray). (c) Normalized similarity of the aligned (red) and unaligned (orange) S1 latent dynamics. N: number of across-day comparisons. (d) Normalized predictive accuracy for decoders based on the aligned latent dynamics (blue) and recorded neural activity (green) when tested on a different day. *** indicates P < 0.001, two-sided Wilcoxon rank-sum test. Error bars: mean ± s.d. N: number of across-day comparisons.

Similar articles

Cited by

References

    1. Gallego JA, Perich MG, Miller LE & Solla SA. Neural Manifolds for the Control of Movement. Neuron 94, 978–984 (2017). - PMC - PubMed
    1. Elsayed GF & Cunningham JP. Structure in neural population recordings: an expected byproduct of simpler phenomena? Nat Neurosci 20, 1310–1318 (2017). - PMC - PubMed
    1. Sadtler PT. et al. Neural constraints on learning. Nature 512, 423–6 (2014). - PMC - PubMed
    1. Stopfer M, Jayaraman V & Laurent G. Intensity versus Identity Coding in an Olfactory System. Neuron 39, 991–1004 (2003). - PubMed
    1. Gallego JA. et al. Cortical population activity within a preserved neural manifold underlies multiple motor behaviors. Nat Commun 9, 4233 (2018). - PMC - PubMed

Publication types