. 2020 Feb;17(2):175-183.
doi: 10.1038/s41592-019-0687-1. Epub 2020 Jan 6.

Biophysical prediction of protein-peptide interactions and signaling networks using machine learning

Affiliations

Biophysical prediction of protein-peptide interactions and signaling networks using machine learning

Joseph M Cunningham et al. Nat Methods. 2020 Feb.

Abstract

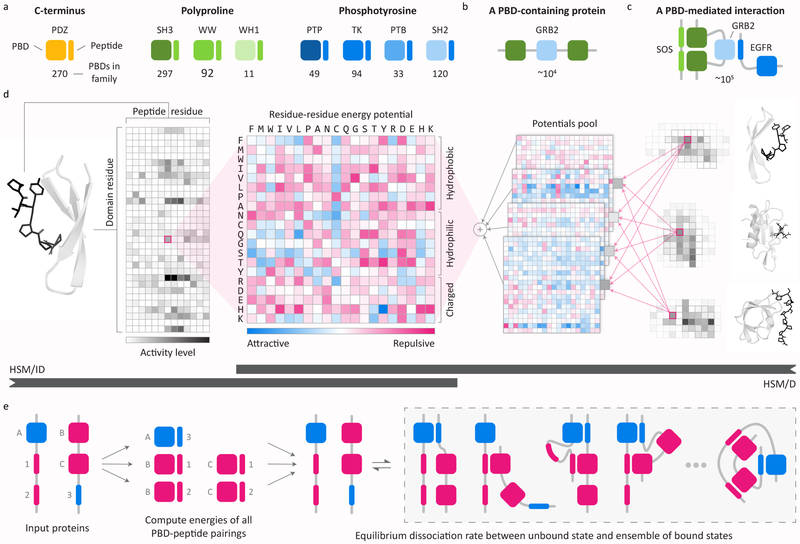
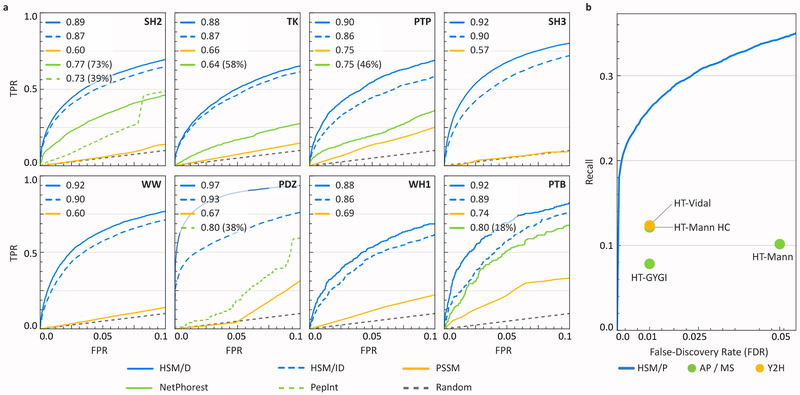
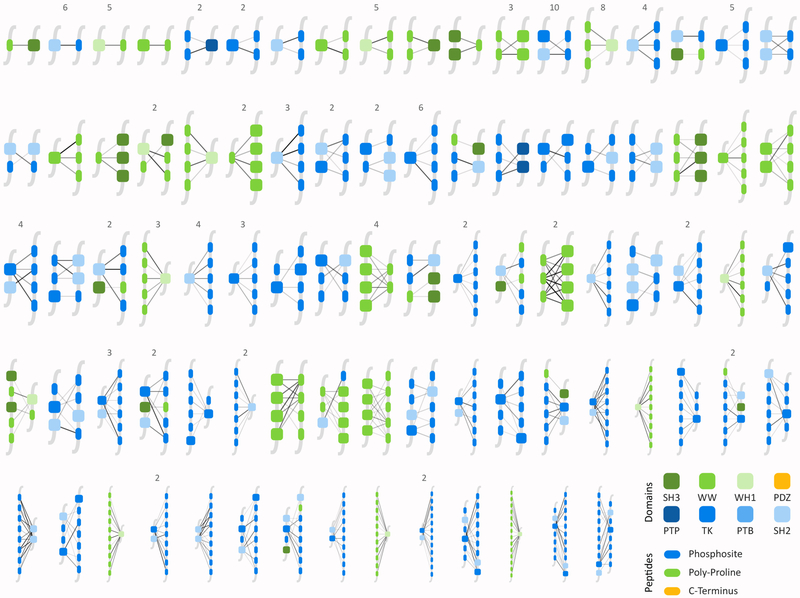
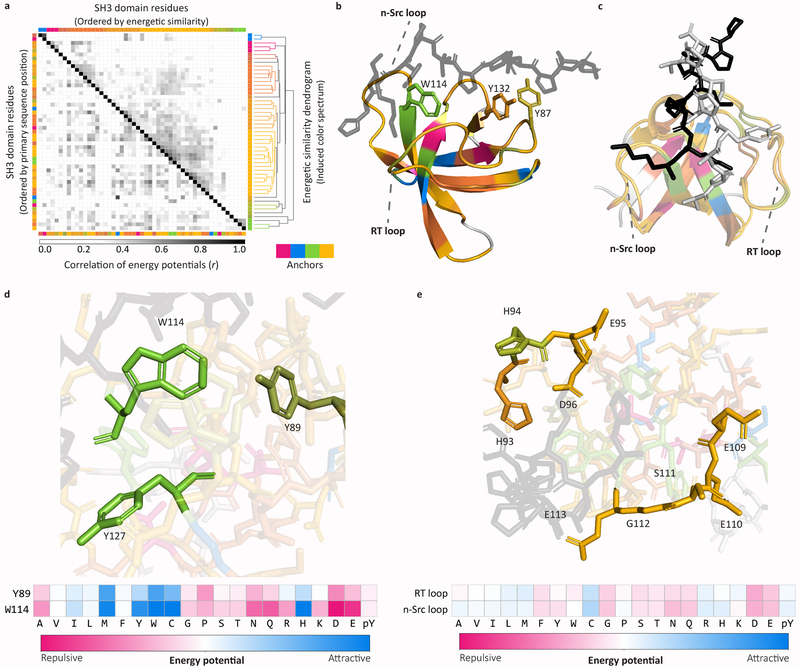
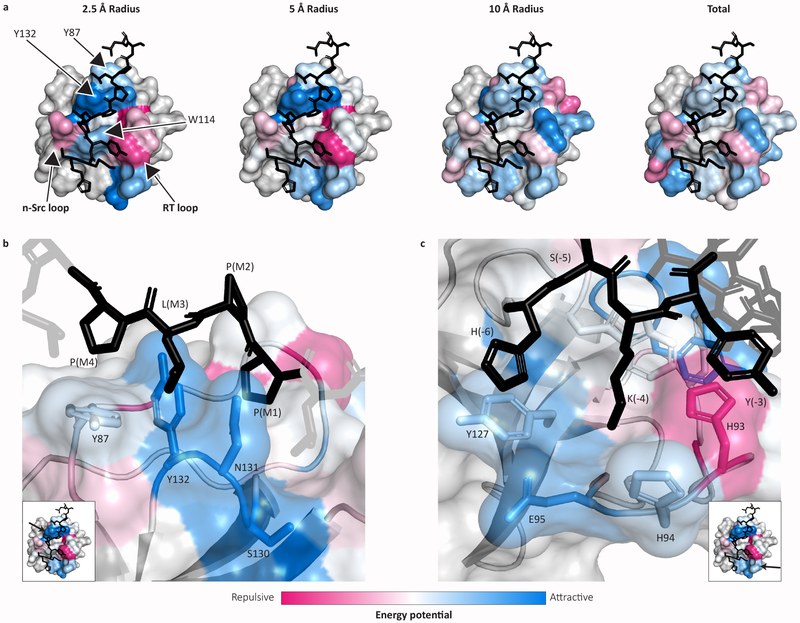
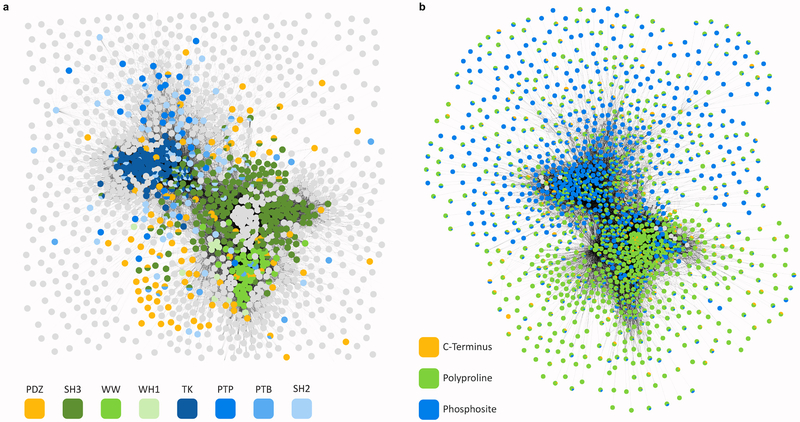
In mammalian cells, much of signal transduction is mediated by weak protein-protein interactions between globular peptide-binding domains (PBDs) and unstructured peptidic motifs in partner proteins. The number and diversity of these PBDs (over 1,800 are known), their low binding affinities and the sensitivity of binding properties to minor sequence variation represent a substantial challenge to experimental and computational analysis of PBD specificity and the networks PBDs create. Here, we introduce a bespoke machine-learning approach, hierarchical statistical mechanical modeling (HSM), capable of accurately predicting the affinities of PBD-peptide interactions across multiple protein families. By synthesizing biophysical priors within a modern machine-learning framework, HSM outperforms existing computational methods and high-throughput experimental assays. HSM models are interpretable in familiar biophysical terms at three spatial scales: the energetics of protein-peptide binding, the multidentate organization of protein-protein interactions and the global architecture of signaling networks.


Conflict of interest statement

COMPETING INTERESTS

PKS is a member of the SAB or Board of Directors of Merrimack Pharmaceutical, Glencoe Software, Applied Biomath and RareCyte Inc. and has equity in these companies; Sorger declares that none of these relationships are directly or indirectly related to the content of this manuscript.

Figures

Figure 1.
Figure 1.. Peptide-binding domains (PBDs) and modeling frameworks.
(a-c) Schematic representations of the (a) PBD families modeled by HSM, (b) GRB2, a representative PBD-containing protein with one SH2 and two SH3 domains, and (c) a PBD-mediated ternary complex involving SOS, GRB2, and EGFR. The numbers of estimated (a) modeled human PBD domains, (b) PBD-containing proteins, and (c) interactions mediated by PBDs are shown below each schematic. (d) Two models of PBD-peptide interactions: HSM for independent domains (HSM/ID; left-to-right, model extent denoted by black bar) and HSM for domains (HSM/D, right-to-left). HSM/ID decomposes a PBD-peptide interaction into pairwise residue-residue interactions (grayscale matrix). Every pair of residue positions (one on the PBD, one on the peptide) within a PBD family is associated with a residue-residue energy potential (colored matrix, middle) that is machine-learned from data. Predictions for a given PBD/peptide combination are made by summing the energies associated with their amino acid sequences, then converting the summed energy into a probability. HSM/D learns a shared set of residue-residue potentials (overlapping colored matrices) across all position pairs and PBD families (grayscale matrix cutouts with associated structures, right). From this shared pool, a weighted mixture of potentials (grayscale blocks in “potentials pool”) is assigned to every position pair in every PBD family in a machine-learned fashion. Predictions are made by summing energies in the same way as for HSM/ID. (e) Multidentate PPIs are handled using the protein model (HSM/P) by predicting the energies of all possible PBD (A–C) and peptidic site (1–3) combinations using HSM/D and then computing the equilibrium dissociation rate between the unbound state and the ensemble of all possible bound states (dashed gray box) using statistical mechanics techniques.
Figure 2.
Figure 2.. Model performance and newly predicted PPIs.
(a) Receiver operating characteristic (ROC) curves plotting the true positive rate (TPR) of HSM predictions and other methods as a function of the false positive rate (FPR) over a high-confidence region (FPR ≤ 0.1). Individual lines are labelled with the Area Under the ROC curve (AUROC) and the fraction of PBDs (in parentheses) covered by the method indicated relative to HSM. PSSM refers to Position-Specific Scoring Matrix; NetPhorest and PepInt are collections of (independent) PBD models. AUROC is reported over the entire curve (i.e. over FPR ranging from 0 to 1). The complete ROC curves are plotted in Supplementary Figure 3a. (b) Recall vs. false discovery rate (FDR) of physically-validated PPIs (e.g. by isothermal titration calorimetry; n = 32,504 interactions; see Methods) for HSM/P (blue curve) and for two affinity purification/mass spectrometry datasets, (AP/MS) HT-GYGI, and HT-MANN/HT-MANN High-Confidence (HT-MANN HC; green points; Supplementary Table 5) and one yeast two-hybrid (Y2H; orange point) dataset, HT-VIDAL.
Figure 3.
Figure 3.. Predicted mechanisms for newly predicted interactions.
Schematics of PBD-peptide interactions driving 161 newly reported PPIs as predicted by HSM/P. Numbers denote how many examples of each PBD/peptide configuration were identified. The complete set of annotated interaction mechanisms is shown in Supplementary Fig. 4. PBD-peptide interaction strength is denoted by edge opacity. Experimental data confirming these interactions were obtained from BioGRID (n = 37), HT-VIDAL (n = 31), HT-MANN (n = 32) and HT-GYGI (n = 86). No PDZ-mediated interactions were observed, likely owing to experimental bias: the attachment of a tag to the C-terminus of a protein, necessary for affinity purification, disrupts PDZ-mediated interactions.
Figure 4.
Figure 4.. Mechanistic analysis of SH3 domain binding.
(a) Correlation matrix of energy potentials at every residue position in the SH3 domain model. Correlation (Pearson’s r, n = 7,056 energies comprising each domain residue - peptide potential (21 amino acids x 21 amino acids x 16 peptide residue positions)) level is shown in grayscale. Lower-left half of the matrix is ordered by sequence position. Upper-right half of the matrix is ordered by bi-clustering distance (shown as a dendrogram). Colors (top, right) are assigned based on cophenetic distance (see text) and mapped to the sequence (bottom, left). (b) Structure of the HCK SH3 domain in complex with a bound peptide (black; PDB accession code 2OI3). Domain residues are color coded based on the clustering patterns shown in panel (a). The aromatic triplet residues in the HCK SH3 domain (Y87, W114, Y132) and specificity-defining loops (RT, n-Src) are labeled. (c) Overlaid SH3-peptide co-complexes (PDB accession codes 1FYN, 1CKA) highlighting the conformational flexibility of bound peptides between the n-Src and RT-loops. SH3 domains are colored using the energetic color spectrum from panel (a). Peptides are highlighted in black (1CKA) and white (1FYN). (d) Close-up of the SH3 tryptophan switch (W114) and energetically-related residues (Y89, Y127). HSM infers a similar energetic profile (similar colors) for W114 and the spatially adjacent residues Y89 (shared functional similarity with Y87-associated cluster) and Y127. This energetic similarity implies a common functional role for this triplet that is complementary to the role played by three previously recognized canonical aromatic residues (Y87, W114, Y132). Energy potentials for the interaction of W114 and Y89 with a single peptide position (bottom) show strong energetic concordance. (e) Close-up of the RT (top) and n-Src (bottom) loops exhibit a set of energetically similar, acidic residues, supporting peptidic conformational flexibility. Mean HSM energy potentials for each loop are shown below.
Figure 5 |
Figure 5 |. Energy surface of SH3-peptide co-complex.
(a) Energy surfaces for the interaction between the SH3 domain of HCK and a peptide with the sequence HSKYPLPPLPSL. Each SH3 residue is colored with its mean predicted energy of interaction with peptidic residues lying within a specified distance (2.5Å, 5Å, 10Å; residue-residue distances are measured between the closest pair of atoms) and with all peptidic residues (“Total”; not bounded by a distance). (b-c) Close-up view of energy surfaces for <5Å interactions. Position and orientation are indicated by arrows on inset structures. (b) Close-up of the core proline-binding motif (Y87, Y132) along with adjacent residues (S130, N131) that interact with the peptide proline motif (HSKYPLPPLPSL). Motif positions are denoted by ‘Mx’ where x is the position within the motif in the N-to-C orientation. (c) Close-up of the specificity defining RT-loop in the SH3 domain with the N-terminal region of the bound peptide (HSKYPLPPLPSL). An adjacent SH3 residue, Y127 (on the β-sheet), is included in the highlighted residues.
Figure 6 |
Figure 6 |. Hierarchical organization of the human PBD-mediated PPI network.
(a-b) Human PPI network with nodes corresponding to proteins and edges to predicted interactions (HSM/P, p > 0.7). Nodes were automatically laid out using a force-directed layout. Each node is represented by a pie chart that denotes (a) domain or (b) peptidic site composition. Blue denotes phosphotyrosine-associated mechanisms, green, proline-associated mechanisms, orange, C-terminus-associated mechanisms, and white, no-associated mechanisms (i.e. a protein that contains no modeled PBDs in (a)). For visualization, maximal adjacency for each node is limited to the 50 most probable partners. (See Supplementary Fig. 7 for networks per PBD family; see website for higher quality images)

References

    1. Gao A et al. Evolution of weak cooperative interactions for biological specificity. Proc. Natl. Acad. Sci 115, E11053–E11060 (2018). - PMC - PubMed
    1. Perkins JR, Diboun I, Dessailly BH, Lees JG & Orengo C Transient Protein-Protein Interactions: Structural, Functional, and Network Properties. Structure 18, 1233–1243 (2010). - PubMed
    1. Mayer BJ The discovery of modular binding domains: building blocks of cell signalling. Nat. Rev. Mol. Cell Biol 16, 691–698 (2015). - PubMed
    1. Tompa P, Davey NE, Gibson TJ & Babu MM A Million Peptide Motifs for the Molecular Biologist. Mol. Cell 55, 161–169 (2014). - PubMed
    1. Scott JD & Pawson T Cell Signaling in Space and Time: Where Proteins Come Together and When They’re Apart. Science 326, 1220–1224 (2009). - PMC - PubMed

References (Online Methods-only)

    1. Wilson D et al. SUPERFAMILY—sophisticated comparative genomics, data mining, visualization and phylogeny. Nucleic Acids Res. 37, D380–D386 (2009). - PMC - PubMed
    1. Sokal RR & Michener CD A Statistical Methods for Evaluating Relationships. Univ. Kans. Sci. Bull 38, 1409–1448.
    1. DeLong ER, DeLong DM & Clarke-Pearson DL Comparing the areas under two or more correlated receiver operating characteristic curves: a nonparametric approach. Biometrics 44, 837–845 (1988). - PubMed
    1. Hornbeck PV et al. PhosphoSitePlus, 2014: mutations, PTMs and recalibrations. Nucleic Acids Res. 43, D512–D520 (2015). - PMC - PubMed
    1. Peng J & Xu J Raptorx: Exploiting structure information for protein alignment by statistical inference. Proteins Struct. Funct. Bioinforma 79, 161–171 (2011). - PMC - PubMed

Publication types